Sex Differences in Tuberculosis Burden and
Notifications in Low- and Middle-Income
Countries: A Systematic Review and
Meta-analysis
Katherine C. Horton
1,2*
, Peter MacPherson
3,4, Rein M. G. J. Houben
2,5, Richard
G. White
2,5, Elizabeth L. Corbett
1,61Department of Clinical Research, London School of Hygiene & Tropical Medicine, London, United Kingdom,2Tuberculosis Modelling Group, Tuberculosis Centre, London School of Hygiene & Tropical Medicine, London, United Kingdom,3Department of Public Health and Policy, University of Liverpool, Liverpool, United Kingdom,4Department of Clinical Sciences, Liverpool School of Tropical Medicine, Liverpool, United Kingdom,5Department of Infectious Disease Epidemiology, London School of Hygiene & Tropical Medicine, London, United Kingdom,6Malawi–Liverpool–Wellcome Trust Clinical Research Programme, Blantyre, Malawi
Abstract
Background
Tuberculosis (TB) case notification rates are usually higher in men than in women, but
notifi-cation data are insufficient to measure sex differences in disease burden. This review set
out to systematically investigate whether sex ratios in case notifications reflect differences
in disease prevalence and to identify gaps in access to and/or utilisation of diagnostic
services.
Methods and Findings
In accordance with the published protocol (CRD42015022163), TB prevalence surveys in
nationally representative and sub-national adult populations (age
15 y) in low- and
mid-dle-income countries published between 1 January 1993 and 15 March 2016 were identified
through searches of PubMed, Embase, Global Health, and the Cochrane Database of
Systematic Reviews; review of abstracts; and correspondence with the World Health
Orga-nization. Random-effects meta-analyses examined male-to-female (M:F) ratios in TB
preva-lence and prevapreva-lence-to-notification (P:N) ratios for smear-positive TB. Meta-regression
was done to identify factors associated with higher M:F ratios in prevalence and higher P:N
ratios. Eighty-three publications describing 88 surveys with over 3.1 million participants in
28 countries were identified (36 surveys in Africa, three in the Americas, four in the Eastern
Mediterranean, 28 in South-East Asia and 17 in the Western Pacific). Fifty-six surveys
reported in 53 publications were included in quantitative analyses. Overall random-effects
weighted M:F prevalence ratios were 2.21 (95% CI 1.92
–
2.54; 56 surveys) for
bacteriologi-cally positive TB and 2.51 (95% CI 2.07
–
3.04; 40 surveys) for smear-positive TB. M:F
a11111
OPEN ACCESS
Citation:Horton KC, MacPherson P, Houben RMGJ, White RG, Corbett EL (2016) Sex Differences in Tuberculosis Burden and Notifications in Low- and Middle-Income Countries: A Systematic Review and Meta-analysis. PLoS Med 13(9): e1002119. doi:10.1371/journal.pmed.1002119
Academic Editor:John Z Metcalfe, University of California San Francisco, UNITED STATES
Received:December 17, 2015
Accepted:July 29, 2016
Published:September 6, 2016
Copyright:© 2016 Horton et al. This is an open access article distributed under the terms of the Creative Commons Attribution License, which permits unrestricted use, distribution, and reproduction in any medium, provided the original author and source are credited.
Data Availability Statement:All relevant data are within the paper and its Supporting Information files.
prevalence ratios were highest in South-East Asia and in surveys that did not require
self-report of signs/symptoms in initial screening procedures. The summary random-effects
weighted M:F ratio for P:N ratios was 1.55 (95% CI 1.25
–
1.91; 34 surveys). We intended to
stratify the analyses by age, HIV status, and rural or urban setting; however, few studies
reported such data.
Conclusions
TB prevalence is significantly higher among men than women in low- and middle-income
countries, with strong evidence that men are disadvantaged in seeking and/or accessing
TB care in many settings. Global strategies and national TB programmes should recognise
men as an underserved high-risk group and improve men
’
s access to diagnostic and
screening services to reduce the overall burden of TB more effectively and ensure gender
equity in TB care.
Author Summary
Why Was This Study Done?
•
Global health initiatives have tended to treat
“
gender
”
issues in health as being
synony-mous with women
’
s health. However, for infectious diseases, policy and practice need to
be guided by epidemiological data and consideration of transmission dynamics.
•
Many more men than women are diagnosed with, and die from, tuberculosis (TB) globally.
•
Data from population-level surveys for undiagnosed TB, carried out in a number of
coun-tries during the last two decades, can be combined with data on diagnosed (notified) cases
to provide more complete insight into the magnitude and nature of sex differences in TB.
What Did the Researchers Do and Find?
•
Surveys conducted to identify adult cases of TB in communities in low- and
middle-income countries between 1993 and 2016 were analysed by sex.
•
TB prevalence among men was over twice as high as among women and was
substan-tially higher even in settings with high HIV prevalence.
•
Case notification rates were also higher for men, and the ratio of prevalent-to-notified
cases of TB
—
an indication of how long patients take to be diagnosed, on average
—
was
1.5 times higher among men than women, suggesting that men are less likely than
women to achieve a timely diagnosis.
What Do These Findings Mean?
•
Given that undiagnosed TB is the key driver for transmission in communities, our data
show that greater effort and investment are needed to improve awareness of TB in men
as an individual and public health issue.
funded by a Wellcome Trust Senior Research Fellowship in Clinical Science (grant number: WT091769). The funders had no role in the study design, data collection and analysis, decision to publish, or preparation of the manuscript.
Competing Interests:The authors have declared that no competing interests exist.
•
Policies on gender and TB should place greater emphasis on the high burden of disease
in men and the need to invest in male-friendly diagnostic and screening services, with
the aim of reducing undiagnosed TB.
Introduction
Over the past twenty years, tuberculosis (TB) case notifications among men have exceeded
those among women in most settings [
1
]. In 2014, the male-to-female (M:F) ratio in
smear-positive pulmonary TB case notification was 1.7 globally and ranged from 1.0 in the Eastern
Mediterranean Region to 2.1 in the Western Pacific Region [
2
]. The excess of notified cases
among men has often been explained as a result of barriers faced by women in seeking care for
and being diagnosed with TB [
3
,
4
]. However, notification data alone are insufficient to
deter-mine whether this is true, or whether sex differences in case notifications reflect an excess in
the burden of disease among men and even a disadvantage among men in seeking and
access-ing TB care.
Prevalence surveys offer a robust measure of disease burden in the community, reducing or
eliminating the care-seeking biases that affect case notifications: a higher proportion of men in
case notifications could reflect either higher incidence of TB disease or more complete
registra-tion for treatment by men. Prevalence surveys predominantly identify infectious TB patients
with previously undiagnosed TB disease who have, therefore, not contributed to routine
notifi-cation data before participation in the survey. As such, comparison of the characteristics of
diagnosed TB patients (notification data) with those of undiagnosed TB patients (prevalence
survey data) provides a unique insight into diagnosis and treatment access barriers. For
exam-ple, finding a similar male predominance in undiagnosed TB (prevalence surveys) patients as
in notified TB cases would support the hypothesis that men genuinely have a higher burden of
TB disease, while finding a greater male predominance in undiagnosed TB patients than in
notified TB cases would suggest male-specific access barriers or male sex being a risk factor for
TB disease.
A previous analysis in 2000 found that male TB prevalence exceeded female TB prevalence
in 27 (93%) of 29 prevalence surveys conducted in 14 countries between 1953 and 1997 [
5
].
The same analysis calculated the patient diagnostic rate (the inverse of the
prevalence-to-notifi-cation ratio) and found that female cases were more likely to be notified than male cases in 21
(72%) surveys.
Despite these findings, men are often overlooked in discussions of gender and TB. While
global TB reports and meetings on gender acknowledge the fact that the majority of TB cases
and TB-associated deaths occur among men, greater focus is usually placed on women. More
broadly in global health discussions, there is a tendency to use the word
“
gender
”
when really
“
women
”
is meant, as exemplified by the Millennium Development Goals [
6
] and Sustainable
Development Goals [
7
]. Subsequently, an emphasis on men runs contrary to global norms [
8
],
and strategies to assess and address men
’
s barriers to TB care are notably absent from the
global research agenda.
in previous analysis [
5
], men should be considered a high-risk group for TB [
11
], and national
TB programmes should more actively target men with routine diagnostic and/or screening
ser-vices. This action is necessary to reduce the burden of TB in the whole population more
effec-tively [
12
] and to ensure that principles of gender equity are upheld.
This review set out to systematically investigate sex differences in the prevalence of
bacterio-logically positive TB and smear-positive TB in adult participants in cross-sectional surveys
conducted in low- and middle-income countries to determine whether sex ratios in adult case
notifications reflect population sex differences in disease and to compare
prevalence-to-notifi-cation (P:N) ratios for men and women. The current study adds to previous analysis [
5
] by
including surveys conducted since the widespread availability of anti-TB chemotherapy in
low-resource settings and the implementation of the directly observed treatment short course
(DOTS) strategy, as well as the rise of the HIV/AIDS pandemic and the implementation of
interventions against it
—
all factors that may have different effects on TB in men and women.
The current study also provides more detailed meta-analyses of sex differences in TB
preva-lence and P:N ratios.
Methods
Search Strategy
In accordance with the published protocol [
13
], studies describing national and sub-national
TB prevalence surveys in adult populations (age
15 y) in low- and middle-income countries
published between 1 January 1993 and 15 March 2016 were identified through searches of
PubMed, Embase, Global Health, and the Cochrane Database of Systematic Reviews (
Table 1
).
The WHO
Global Tuberculosis Report 2015
[
2
] and abstract books from the Union World
Con-ference on Lung Health (2012
–
2015) were also searched by hand, as were the reference lists of
included studies. Researchers in the field and at WHO were contacted to assist with
identifica-tion of relevant studies.
Two authors (K. C. H. and P. M.) independently reviewed titles and abstracts in parallel to
identify relevant studies for full-text review. A third author (E. L. C.) resolved any
discrepan-cies. The same authors reviewed full texts to determine whether studies met inclusion criteria
and then extracted data on study methodology and TB prevalence in parallel using piloted
elec-tronic forms.
Study authors were contacted for additional information if studies did not report the
num-ber of participants and the numnum-ber of bacteriologically positive and/or smear-positive TB cases
Table 1. Search strategy. Set Search Algorithm
PubMed Embase/Global Health Cochrane Library
1 ((“tuberculosis”[MeSH terms] OR“tuberculosis”OR“Tuberculoses”) OR (“Mycobacterium tuberculosis”[MeSH terms])) NOT
((“animals”[MeSH terms] NOT (“humans”[MeSH terms] AND
“animals”[MeSH terms])))
((tuberculos*or Mycobacterium tuberculosis) NOT (animals not (humans and animals))).hw,ti.
(tuberculos*or
“Mycobacterium tuberculosis”): ti,kw
2 (cross-sectional[MeSH terms] OR mass screening[MeSH terms] OR prevalence[MeSH terms] OR (prevalence[tw] AND study[tw]) OR (prevalence[tw] AND studies[tw]))
(cross-sectional or mass screening or prevalence).hw,ti.
(cross-sectional or“mass screening”or prevalence):ti,kw
3 Cochrane LMIC search terms [14] Cochrane LMIC search terms [14] Cochrane LMIC search terms
[14]
4 “1993/01/01”[Date—Publication]:“3000”[Date—Publication] 1 and 2 and 3 (#1 AND #2 AND #3)
5 English [la] Limit 4 to time period from 1993–present Limit 4 to time period 1993–
present
6 1 AND 2 AND 3 AND 4 AND 5 Limit 5 to English language
by sex for adult participants. Authors were also contacted if sex-specific prevalence data were
not available by age group.
Inclusion and Exclusion Criteria
The review included cross-sectional prevalence surveys conducted in low- and middle-income
countries [
15
]. Studies conducted among symptomatic or care-seeking individuals, children,
individuals of a single sex, occupational settings, or other sub-populations (e.g., only
HIV-posi-tive individuals) were excluded. Studies reporting prevalence of
Mycobacterium tuberculosis
infection but not TB disease were excluded. Individuals under 15 y of age were excluded since
diagnosis of childhood TB is more complicated than diagnosis of adult disease, especially
within the context of community-based surveys [
16
]. Studies including both adults and
chil-dren were included in the qualitative review but were excluded from quantitative analyses
unless the study reported participation and prevalence for adults. Studies published in
lan-guages other than English were excluded due to limited resources for translation. Where more
than one report was identified for a single survey, the most complete source was included and
the others were excluded.
Study Quality
The risk of bias in included studies was assessed in parallel by K. C. H. and P. M. Each study
was ranked on eight criteria from a tool developed to assess the risk of bias in prevalence
sur-veys [
17
]. These criteria assessed factors related to the selection of the study population, the
risk of nonresponse bias, data collection methods, and case definitions. The eight criteria were
summarised to give an assessment of the overall risk of bias.
Definitions
Study participants were defined as individuals who were interviewed and/or underwent initial
screening procedures, according to study-specific procedures. Participation was defined as the
number of participants divided by the number of individuals who were eligible or invited to
participate. High relative male participation was defined as a M:F ratio in participation
0.90.
Case definitions for TB were based on internationally recognised terminology, where
avail-able, and study-specific definitions otherwise. Bacteriologically positive TB was defined as
posi-tive smear microscopy, culture, or WHO-approved rapid diagnostic results (such as from
Xpert MTB/RIF) [
18
].
Sex-specific prevalence of bacteriologically and smear-positive TB was defined as the
num-ber of individuals with bacteriologically or smear-positive TB divided by the numnum-ber of study
participants, by sex. Reported prevalence was used to estimate the number of cases or the
num-ber of participants where one of these values was missing. No adjustments were made for
non-participation or nonsampling.
Sex-specific P:N ratios were calculated as the ratio of smear-positive TB prevalence per
100,000 individuals to smear-positive TB case notifications per 100,000 individuals among
adults [
5
,
19
]. WHO case notification data [
20
] and United Nations population estimates [
21
]
were matched to each prevalence survey by country and year. For surveys that took place over
more than one calendar year, the annual case notification rate was averaged over all survey
years (excluding years with no reported data). No adjustments were made for sub-national
surveys.
defined using the median value for included studies, which was an estimated national TB
prevalence
300 per 100,000 individuals [
22
]. High HIV prevalence was defined as estimated
national HIV prevalence
1% in the general population [
23
,
24
], and high HIV prevalence in
incident TB was defined as estimated HIV prevalence
20% in new and relapse TB cases
[
22
,
25
].
Data Analysis
Prevalence of bacteriologically positive TB and smear-positive TB was calculated for included
studies by sex. Prevalence of bacteriologically positive TB by sex and age was also calculated,
where possible. Sub-group prevalence was estimated for sub-groups based on survey
character-istics including WHO geographical region, survey setting (national versus sub-national),
national estimates of TB and HIV burden (both in the general population; the latter also in
incident TB), study quality, initial screening procedures, case definitions, and relative male
par-ticipation. Clopper-Pearson confidence intervals [
26
] and M:F ratios were calculated for all
prevalence estimates. P:N ratios for smear-positive TB were estimated with confidence
inter-vals based on the estimated variance using a continuity correction of 0.5 in the corresponding
prevalence estimates.
Heterogeneity was assessed using the
I
2statistic [
27
]. Due to substantial heterogeneity
between studies, random-effects models were used for meta-analyses, weighting for the inverse
of the variance. Random-effects weighted summary M:F ratios were calculated for
participa-tion, prevalence of bacteriologically positive TB and smear-positive TB, age-specific prevalence
of bacteriologically positive TB, and P:N ratios.
Meta-regression was performed for M:F ratios in prevalence and M:F ratios in P:N ratios to
examine associations with the survey characteristics mentioned above, plus the starting year of
each survey. Univariate meta-regression of M:F ratios in prevalence was conducted separately
for bacteriologically positive TB and smear-positive TB. If either univariate meta-regression
suggested evidence of an association with a particular characteristic, that characteristic was
included as a variable in the multivariate meta-regression models for both bacteriologically
positive and smear-positive TB. Similarly, multivariate meta-regression of M:F ratios in P:N
ratios was based on evidence of associations in univariate analysis.
All analyses were performed using R version 3.2.2 [
28
] (
S1 Data
;
S1 Analysis
).
Results
Study Characteristics
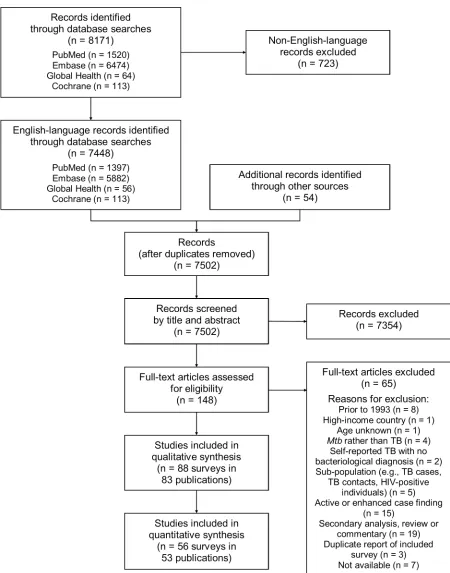
Of 7,502 potentially relevant English-language studies screened by title and abstract, 148 were
reviewed in full; of these, 65 were excluded after full-text review (
S1 Table
) and 83 were eligible for
inclusion (
Fig 1
;
S2 Table
) [
29
–
111
]. Included studies describe 88 surveys in 28 countries: 36
sur-veys in 13 countries in the African Region, three sursur-veys in two countries in the Region of the
Americas, four surveys in two countries in the Eastern Mediterranean Region, 28 surveys in five
countries in the South-East Asia Region, and 17 surveys in six countries in the Western Pacific
Region (
Fig 2
). There were 22 nationally representative surveys and 66 sub-national surveys, with at
least 20 of the latter conducted in urban settings and eight among tribal populations. Over 3.1
mil-lion adult participants were included; 16 surveys did not report the number of adult participants.
Study Quality
only an abstract was available were characterised as unknown risk of bias due to limited
infor-mation on study methodology [
34
,
54
,
57
,
62
,
63
,
75
,
76
,
79
,
80
,
95
,
104
]. The quantitative analyses
included a slightly higher proportion of surveys with low risk of bias than the qualitative
sum-mary. In all, 84% to 94% of the surveys in the quantitative analyses had low to moderate risk of
bias (
S2 Fig
).
Participation by Sex
Female participation equalled or exceeded male participation in all of the 28 surveys for which
participation was reported by sex (
Fig 3
). Of 687,926 men eligible or invited to participate,
521,934 (75.9%) participated, while 611,901 (82.5%) of 741,705 eligible or invited women
par-ticipated. The overall random-effects weighted M:F ratio in participation was 0.90 (95% CI
0.86
–
0.93; range 0.50 to 1.00).
TB Prevalence by Sex
The prevalence of bacteriologically positive TB was reported by sex in 56 surveys with 2.2 million
participants in 24 countries [
29
,
30
,
32
,
33
,
35
,
36
,
38
–
44
,
47
–
51
,
53
,
55
,
56
,
58
–
60
,
65
–
67
,
69
–
74
,
82
,
84
,
85
,
87
,
89
–
94
,
97
,
101
,
102
,
104
,
105
,
107
,
110
–
112
]. Forty surveys with 1.7 million participants in 22
countries reported the prevalence of smear-positive TB by sex [
35
,
40
,
43
,
44
,
48
–
51
,
53
,
55
,
56
,
58
–
60
,
65
–
67
,
69
–
71
,
73
,
74
,
85
,
87
,
89
,
90
,
92
,
94
,
97
,
101
,
102
,
105
,
107
,
110
,
111
]. The overall random-effects
weighted prevalence per 100,000 individuals was 488 (95% CI 382
–
623) among men and 231
(95% CI 166
–
321) among women for bacteriologically positive TB and 314 (95% CI 245
–
403)
among men and 129 (95% CI 89
–
189) among women for smear-positive TB (
S3 Table
).
Fig 2. Global map showing countries in which prevalence surveys have been conducted.Yellow indicates low- and middle-income countries for which sex-disaggregated data are available from at least one prevalence survey (n =24). Red indicates low- and middle-income countries in which at least one prevalence survey has been conducted but sex-disaggregated data are not available (n =4). Dark gray indicates low- and middle-income countries where no prevalence survey has been identified (n =107). Labels show the total number of surveys identified within each country for which at least one prevalence survey was identified (n =88).Excluding the Region of the Americas
—
because it had only two small sub-national surveys
included in the quantitative analysis
—
the prevalence of bacteriologically positive TB and
smear-positive TB was highest in the African Region. There was strong evidence that male and
female prevalence of bacteriologically positive TB per 100,000 individuals was higher in
tings with high HIV prevalence in the general population (high versus low HIV prevalence
set-tings: for men, 1,162, 95% CI 735
–
1,834, versus 360, 95% CI 275
–
471,
p
<
0.001; for women,
735, 95% CI 448
–
1202, versus 157, 95% CI 110
–
223,
p
<
0.001). This same relationship (higher
prevalence of undiagnosed TB in settings with high HIV prevalence) was also apparent when
HIV data from diagnosed TB patients, rather than the general population, were used (for men:
907, 95% CI 582
–
1,413, versus 359, 95% CI 270
–
477,
p
= 0.001; for women: 553, 95% CI 341
–
896, versus 153, 95% CI 105
–
224,
p
<
0.001) (
S4 Table
). Prevalence of smear-positive TB per
100,000 individuals was also higher in settings with high HIV prevalence in the general
popula-tion (high versus low HIV prevalence settings: for men, 548, 95% CI 303
–
990, versus 275, 95%
CI 208
–
364,
p =
0.039; for women, 273, 95% CI 131
–
568, versus 110, 95% CI 71
–
169,
p =
0.036) and in settings with high HIV prevalence in diagnosed TB patients for women (229,
95% CI 126
–
416, versus 103, 95% CI 64
–
165,
p =
0.040) but not for men (459, 95% CI 289
–
727, versus 270, 95% CI 200
–
366,
p =
0.060) (
S4 Table
).
Fig 3. Male-to-female ratios of participation among eligible or invited individuals (n =29).Analysis includes surveys that report the number of individuals who were eligible for screening and the number of individuals screened by sex. SeeS2 Tablefor survey details and references. Lao PDR, Lao People’s Democratic Republic.
Male-to Female Ratios in TB Prevalence
The overall random-effects weighted M:F prevalence ratio was 2.21 for bacteriologically
posi-tive TB (95% CI 1.92
–
2.54; range 0.62 to 6.18; 56 surveys in 24 countries) and 2.51 for
smear-positive TB (95% CI 2.07
–
3.04; range 0.25 to 5.91; 40 surveys in 22 countries). Random-effects
weighted M:F prevalence ratios for bacteriologically positive TB and smear-positive TB were
significantly greater than one in all regions except the Region of the Americas, where analyses
included only two small sub-national surveys (
Fig 4
).
Among countries with multiple surveys, an excess of male TB cases was observed in all
stud-ies in eight (73%) of 11 countrstud-ies. Exceptions with inconsistent results were Ethiopia, South
Africa, and Viet Nam, although overall random-effects weighted M:F prevalence ratios
exceeded one for each of these countries.
Univariate Meta-regression of Male-to-Female Ratios in Prevalence
In univariate meta-regression of M:F ratios in bacteriologically positive TB (
Table 2
), there was
strong evidence that M:F prevalence ratios were 1.95 times higher in the South-East Asia
Region than in the African Region (95% CI 1.54
–
2.48; 56 surveys). M:F prevalence ratios were
lower in settings with high HIV prevalence in the general population (0.67, 95% CI 0.49
–
0.90;
54 surveys) or in incident TB (0.69, 95% CI 0.53
–
0.93; 54 surveys).
M:F prevalence ratios were also higher in the South-East Asia Region than in the African
Region in univariate meta-regression of smear-positive TB (1.91, 95% CI 1.33
–
2.75; 39
sur-veys). In this analysis there was also evidence that M:F prevalence ratios were lower in surveys
that required individuals to report signs or symptoms of TB during initial screening procedures
(0.63, 95% CI 0.42
–
0.96; 39 surveys) compared to surveys within which initial screening
proce-dures included criteria such as chest X-ray, self-reported history of TB, or self-reported contact
with a TB case, instead of or in addition to self-reported signs or symptoms.
In univariate meta-regression models for M:F ratios in bacteriologically positive TB and M:
F ratios in smear-positive TB, none of the following survey characteristics were associated with
differences in M:F ratios in TB prevalence: survey setting (national versus sub-national), survey
starting year, TB prevalence, risk of bias, case definitions, or relative sex ratios in participation.
Multivariate Meta-regression of Male-to-Female Ratios in Prevalence
In multivariate meta-regression of M:F ratios in bacteriologically positive TB, there was
evi-dence that M:F ratios remained higher in the South-East Asia Region than in the African
Region after adjusting for HIV prevalence and initial screening procedures, although the
rela-tive M:F ratio between these two regions was slightly lower than in univariate analysis (1.78,
95% CI 1.13
–
2.80; 54 surveys).
There was evidence in the multivariate meta-regression of M:F ratios in smear-positive TB
that M:F ratios were 2.21 times higher in the South-East Asia Region than in the African region
(95% CI 1.23
–
4.04; 38 surveys). There was also evidence in the multivariate meta-regression
that M:F ratios in surveys that required individuals to self-report signs or symptoms of TB in
initial screening procedures were lower than those in surveys with broader initial screening
procedures (0.65, 95% CI 0.45
–
0.93; 38 surveys).
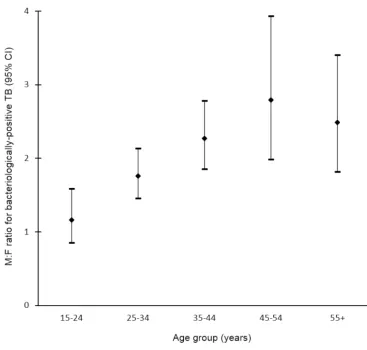
TB Prevalence by Sex and Age
1.92; range 0.29 to 5.06) among individuals aged 15
–
24 y to 3.18 (95% CI 2.24
–
4.53; range 0.57
to 11.34) among individuals aged 45
–
54 y (
Fig 5
).
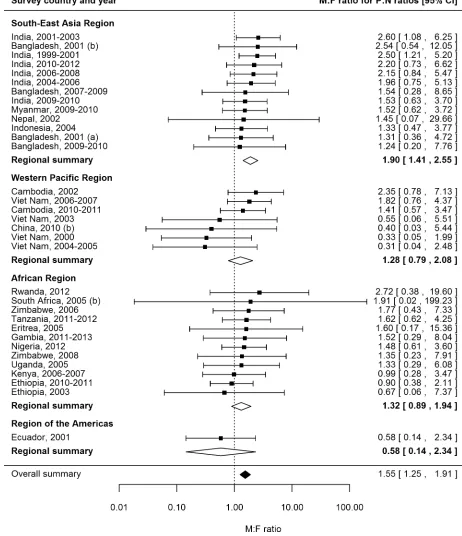
Prevalence-to-Notification Ratios by Sex
P:N ratios for smear-positive TB exceeded one for both men and women in 25 (74%) of 34
sur-veys in 20 countries with available data (
Fig 6
). The median number of prevalent cases per
noti-fied case was 2.6 (interquartile range 1.3
–
3.4) for men and 1.6 (interquartile range 1.2
–
2.7) for
women, and the overall random-effects weighted M:F ratio for P:N ratios was 1.55 (95% CI
1.25
–
1.91).
Univariate Meta-regression for Male-to-Female Ratios in
Prevalence-to-Notification Ratios
There was no evidence in univariate meta-regression that any of the study or setting
character-istics examined were associated with M:F ratios in P:N ratios (
S5 Table
). Due to the lack of
evi-dence of associations in univariate analyses, multivariate meta-regression was not performed
for M:F ratios in P:N ratios.
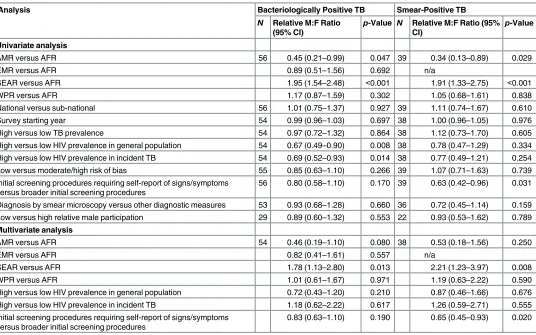
Table 2. Univariate and multivariate random-effects meta-regression results for male-to-female ratios in bacteriologically positive TB and smear-positive TB.
Analysis Bacteriologically Positive TB Smear-Positive TB
N Relative M:F Ratio (95% CI)
p-Value N Relative M:F Ratio (95% CI)
p-Value
Univariate analysis
AMR versus AFR 56 0.45 (0.21–0.99) 0.047 39 0.34 (0.13–0.89) 0.029
EMR versus AFR 0.89 (0.51–1.56) 0.692 n/a
SEAR versus AFR 1.95 (1.54–2.48) <0.001 1.91 (1.33–2.75) <0.001
WPR versus AFR 1.17 (0.87–1.59) 0.302 1.05 (0.68–1.61) 0.838
National versus sub-national 56 1.01 (0.75–1.37) 0.927 39 1.11 (0.74–1.67) 0.610
Survey starting year 54 0.99 (0.96–1.03) 0.697 38 1.00 (0.96–1.05) 0.976
High versus low TB prevalence 54 0.97 (0.72–1.32) 0.864 38 1.12 (0.73–1.70) 0.605
High versus low HIV prevalence in general population 54 0.67 (0.49–0.90) 0.008 38 0.78 (0.47–1.29) 0.334 High versus low HIV prevalence in incident TB 54 0.69 (0.52–0.93) 0.014 38 0.77 (0.49–1.21) 0.254
Low versus moderate/high risk of bias 55 0.85 (0.63–1.10) 0.266 39 1.07 (0.71–1.63) 0.739
Initial screening procedures requiring self-report of signs/symptoms versus broader initial screening procedures
56 0.80 (0.58–1.10) 0.170 39 0.63 (0.42–0.96) 0.031
Diagnosis by smear microscopy versus other diagnostic measures 53 0.93 (0.68–1.28) 0.660 36 0.72 (0.45–1.14) 0.159 Low versus high relative male participation 29 0.89 (0.60–1.32) 0.553 22 0.93 (0.53–1.62) 0.789 Multivariate analysis
AMR versus AFR 54 0.46 (0.19–1.10) 0.080 38 0.53 (0.18–1.56) 0.250
EMR versus AFR 0.82 (0.41–1.61) 0.557 n/a
SEAR versus AFR 1.78 (1.13–2.80) 0.013 2.21 (1.23–3.97) 0.008
WPR versus AFR 1.01 (0.61–1.67) 0.971 1.19 (0.63–2.22) 0.590
High versus low HIV prevalence in general population 0.72 (0.43–1.20) 0.210 0.87 (0.46–1.66) 0.676
High versus low HIV prevalence in incident TB 1.18 (0.62–2.22) 0.617 1.26 (0.59–2.71) 0.555
Initial screening procedures requiring self-report of signs/symptoms versus broader initial screening procedures
0.83 (0.63–1.10) 0.190 0.65 (0.45–0.93) 0.020
AFR, African Region; AMR, Region of the Americas; EMR, Eastern Mediterranean Region; n/a, not applicable; SEAR, South-East Asia Region; WPR, Western Pacific Region.
Discussion
Meta-analysis of 56 TB prevalence surveys including 2.2 million participants in 28 countries
pro-vides strong evidence that TB prevalence is higher among men than women, with a higher M:F
ratio than that reported for case notification data. The number of prevalent cases per notified case of
smear-positive TB was also higher among men than women, adding evidence that men may be less
likely than women to seek or access care in many settings. Further evidence of men
’
s barriers to
seeking or accessing care is provided by results showing that men were less likely than women to
participate in prevalence surveys and that relatively fewer prevalent cases were found among men in
surveys that required participants to self-report signs or symptoms in initial screening procedures.
The excess male prevalence observed in surveys conducted between 1953 and 1997 [
5
]
per-sists in more recent surveys, despite widespread implementation of the DOTS strategy and
interventions against the HIV pandemic that have decreased overall TB prevalence. Regional
summary M:F ratios in the current study were similar to those previously reported for
South-East Asia (3.8 versus 3.2), where sex differences were greatest, and the Western Pacific (1.9
ver-sus 2.0). However, in the current study, the summary M:F ratio for the African Region was
Fig 5. Random-effects weighted male-to-female prevalence ratios for bacteriologically positive TB by age group (n =19).Analysis includes surveys that report the number of individuals screened and the number of bacteriologically positive TB cases by sex and age. Horizontal axis shows age groups in years. Vertical axis shows random-effects weighted M:F ratios in prevalence of bacteriologically positive TB per 100,000 individuals with 95% confidence intervals.twice that previously reported (2.0 versus 1.0), suggesting that sex disparities in TB prevalence
in this region have increased over the past fifty years. The emergence of HIV during this time
has had a substantial impact on TB epidemiology, especially in the African Region. However,
Fig 6. Male-to-female ratios in prevalence-to-notification ratios (n =34).Analysis includes surveys that report the prevalence of smear-positive TB by sex and for which corresponding national notification and population data are available. SeeS2 Tablefor survey details and references.while the prevalence of HIV is slightly higher among women than men [
113
], this study shows
that the prevalence of TB is higher among men, even in countries with generalised HIV
epi-demics. Men also face a relative disadvantage in accessing and remaining in HIV care [
114
–
117
], and so men
’
s risk of TB is likely to be further increased as a result of undiagnosed and
untreated HIV co-infection and missed opportunities for TB screening within HIV care.
Comparisons of sex ratios in TB prevalence and notification highlight sex differences in time
to diagnosis and imply that in many settings women are more likely than men to have a timely
TB diagnosis. While these results could be attributed to men seeking care in private facilities and
therefore being less likely to be included in case notification numbers, this explanation would
require that the proportion of men who seek care in the public sector be only two-thirds the
pro-portion of women who seek care in that sector. Instead, there is wider evidence that men are less
well-served than women by health services [
118
,
119
]. Within the context of HIV, which has a
similarly lengthy pathway to diagnosis, there is also substantial evidence that men experience
greater attrition and worse outcomes [
114
–
117
]. Men are less likely than women to access
antire-troviral therapy, and in many countries this disparity has increased over time [
114
]. Similar
evi-dence showing men
’
s disadvantage in the TB care pathway is building [
120
–
122
]. Focusing
specifically on access to diagnosis, male TB patients often delay care-seeking longer than female
TB patients [
123
], and this review adds support that timely entry into the TB care pathway may
be more difficult for men than women in many settings.
Lower prevalence survey participation among men and evidence of lower M:F prevalence
ratios in studies that require individuals to self-report signs or symptoms of TB in initial
screen-ing procedures imply that symptom screenscreen-ing in community-based active case findscreen-ing may be a
less effective tool for identifying TB disease in men than women. It is not known whether this is
due to men refusing to report symptoms or whether the sub-clinical phase of disease may be
lon-ger for men [
124
]. Further investigation is needed to examine men
’
s acceptance of screening and
reporting of symptoms, even when barriers related to visiting a healthcare facility are removed.
Findings from this review suggest that case detection efforts, whilst not ignoring women,
should be greatly strengthened for men. This will require a detailed understanding of the
barri-ers that men face in accessing care. Previous studies have highlighted factors such as loss of
income and financial barriers, as well as stigma, that affect men
’
s healthcare decisions
[
125
,
126
]. Care-seeking decisions are further influenced by perceptions of masculinity that
dis-courage admission of illness, and systems of care that take away men
’
s sense of control and
leave feelings of inadequacy [
127
,
128
]. Interventions to improve case detection among men
must recognise and address these barriers. Healthcare providers should be sensitive to men
’
s
needs and consider offering dedicated clinic times and outreach services for men. TB
diagnos-tic services that incorporate men
’
s peer networks or workplaces to promote wellness and
reduce stigma may also be effective. In South Africa, a men-only after-hours clinic situated
close to a transport hub has been effective in improving men
’
s uptake of HIV testing and
adherence to antiretroviral therapy [
129
]. Comparable opportunities for TB strategies that
offer convenient access to care while maintaining men
’
s sense of control should be explored.
This review summarises evidence on sex ratios in TB prevalence from a large number of
prevalence surveys across geographic regions, an approach which introduces a number of
potential sources of bias. Surveys varied greatly in their methodology, particularly in screening
criteria and case definitions, and levels of participation varied within and between studies.
However, over 84% of the surveys in the analyses had low to moderate risk of bias.
national case notification rates, regardless of study setting. Stratifying by age and rural or
urban setting would improve P:N ratios; however, data on these characteristics were not
able at the time of analysis. Prevalence data by sex and HIV status were too infrequently
avail-able to be reported here. To our knowledge, no surveys that conducted drug susceptibility
testing reported the results of those analyses by sex, so it is not possible to comment on whether
the sex differences reported here are also relevant to drug-resistant TB. Given the significant
sex differences reported in prevalence, future surveys should analyse and report all results by
sex to facilitate greater understanding of the relationship between gender and TB.
Men have a higher prevalence of TB and, in many settings, remain infectious in the
commu-nity for a longer period of time than women. Men are therefore likely to generate a greater
number of secondary infections than women, and social mixing patterns have suggested that,
as a result, men are responsible for the majority of infections in men, women, and children
[
12
]. Addressing men
’
s burden of disease and disadvantage in TB care is therefore an issue not
only for men
’
s health but for broader TB prevention and care. Given the compelling evidence
presented here, global discourse and policy on key underserved populations need to include a
focus on men. Recommendations to address issues of gender and TB cannot continue to insist
on addressing the needs of women and girls [
130
] while ignoring the inequity faced by men
and boys, who carry the higher burden of disease, often with less access to timely diagnosis and
treatment. With a clear need and high burden, improving diagnosis and treatment among men
is essential to achieving the ambitious targets of the End TB Strategy.
Supporting Information
S1 Checklist. PRISMA checklist.
(PDF)
S2 Checklist. MOOSE checklist.
(PDF)
S1 Analysis. Markdown file including R code and output.
(HTML)
S1 Data. Data on all included surveys reporting TB prevalence by sex (
n =
56).
(TXT)
S1 Fig. Distribution of overall risk of bias by response to each assessment criterion.
(PDF)
S2 Fig. Distribution of overall risk of bias for each analysis.
(PDF)
S1 Table. Reasons for exclusion of studies with full-text review (
n =
65).
(PDF)
S2 Table. Characteristics of included surveys (
n =
88).
(PDF)
S3 Table. Male and female prevalence of bacteriologically positive TB (
n =
56) and
smear-positive TB (
n =
40) per 100,000 individuals.
(PDF)
S4 Table. Sub-group analysis of male and female prevalence of bacteriologically positive
TB and smear-positive TB.
S5 Table. Univariate random-effects meta-regression results for male-to-female ratios in
prevalence-to-notification ratios (
n =
33).
(PDF)
Acknowledgments
Authors acknowledge support from the London School of Hygiene & Tropical Medicine TB
Centre. Authors also appreciate support from Irwin Law (World Health Organization, Geneva,
Switzerland) in identifying and gathering national prevalence surveys for inclusion in this
review.
The contents of this document are the sole responsibility of the authors and can under no
circumstances be regarded as reflecting the positions of the International Union Against
Tuberculosis and Lung Disease nor those of its donors.
Author Contributions
Conceived and designed the experiments:
KCH ELC.
Performed the experiments:
KCH PM.
Analyzed the data:
KCH.
Wrote the first draft of the manuscript:
KCH.
Contributed to the writing of the manuscript:
PM RMGJH RGW ELC.
Agree with the manuscript
’
s results and conclusions:
KCH PM RMGJH RGW ELC.
Assisted with design of analyses and interpretation of results:
RMGJH RGW ELC.
All authors have read, and confirm that they meet, ICMJE criteria for authorship.
References
1. World Health Organization. Global tuberculosis control: WHO report 2011. WHO/HTM/TB/2011.16. 2011 [cited 2 Aug 2016]. Available:http://apps.who.int/iris/bitstream/10665/44728/1/
9789241564380_eng.pdf.
2. World Health Organization. Global tuberculosis report 2015. WHO/HTM/TB/2015.22. 2015 [cited 2 Aug 2016]. Available:http://apps.who.int/iris/bitstream/10665/191102/1/9789241565059_eng.pdf.
3. Long NH, Johansson E, Lonnroth K, Eriksson B, Winkvist A, Diwan V. Longer delays in tuberculosis diagnosis among women in Vietnam. Int J Tuberc Lung Dis. 1999; 3:388–393. PMID:10331727
4. Weiss MG, Auer C, Somma D, Abouihia A, Jawahar M, Karim F, et al. Gender and tuberculosis: cross-site analysis and implications of a multi-country study in Bandladesh, India, Malawi, and Colom-bia. 2006 [cited 2 Aug 2016]. Available:http://www.who.int/entity/tdr/publications/documents/ sebrep3.pdf?ua=1.
5. Borgdorff M, Nagelkerke N, Dye C, Nunn P. Gender and tuberculosis: a comparison of prevalence surveys with notification data to explore sex differences in case detection. Int J Tuberc Lung Dis. 2000; 4:123–132. PMID:10694090
6. United Nations General Assembly. United Nations millennium declaration. A/RES/55/2. 2000 Sep 8 [cited 2 Aug 2016]. Available:http://www.un.org/millennium/declaration/ares552e.htm.
7. United Nations General Assembly. Transforming our world: the 2030 agenda for sustainable develop-ment. A/RES/70/1. 2015 Sep 25 [cited 2 Aug 2016]. Available:http://www.un.org/ga/search/view_ doc.asp?symbol=A/RES/70/1&Lang=E.
8. Hawkes S, Buse K. Gender and global health: evidence, policy, and inconvenient truths. Lancet. 2013; 381:1783–1787. doi:10.1016/S0140-6736(13)60253-6PMID:23683645
10. World Health Organization. Systematic screening for active tuberculosis: principles and recommenda-tions. 2013 [cited 2 Aug 2016]. Available:http://www.who.int/tb/publications/Final_TB_Screening_ guidelines.pdf.
11. Lönnroth K, Corbett E, Golub J, Godfrey-Faussett P, Uplekar M, Weil D, et al. Systematic screening for active tuberculosis: rationale, definitions and key considerations. Int J Tuberc Lung Dis. 2013; 17:289–298. doi:10.5588/ijtld.12.0797PMID:23407219
12. Dodd PJ, Looker C, Plumb I, Bond V, Schaap A, Shanaube K, et al. Age- and sex-specific social con-tact patterns and incidence of Mycobacterium tuberculosis infection. Am J Epidemiol. 2016; 183:156– 166. doi:10.1093/aje/kwv160PMID:26646292
13. Horton K, MacPherson P, White R, Houben R, Corbett L. Gender differences in tuberculosis preva-lence in low- and middle-income countries. CRD42015022163. PROSPERO International Prospec-tive Register of Systematic Reviews. 2015 [cited 2 Aug 2016]. Available:http://www.crd.york.ac.uk/ PROSPERO/display_record.asp?ID=CRD42015022163.
14. Cochrane. LMIC filters. 2012 [cited 2 Aug 2016]. Available:http://epoc.cochrane.org/lmic-filters. 15. The World Bank. World Bank country and lending groups. 2015 [cited 26 May 2015]. Available:http://
data.worldbank.org/about/country-and-lending-groups.
16. World Health Organization. Tuberculosis prevalence surveys: a handbook. WHO/HTM/TB/2010.17. 2011 [cited 2 Aug 2016]. Available:http://apps.who.int/iris/bitstream/10665/44481/1/
9789241548168_eng.pdf?ua=1&ua=1.
17. Hoy D, Brooks P, Woolf A, Blyth F, March L, Bain C, et al. Assessing risk of bias in prevalence studies: modification of an existing tool and evidence of interrater agreement. J Clin Epidemiol. 2012; 65:934– 939. doi:10.1016/j.jclinepi.2011.11.014PMID:22742910
18. World Health Organization. Definitions and reporting framework for tuberculosis—2013 revision (updated December 2014). 2013 [cited 2 Aug 2016]. Available:http://apps.who.int/iris/bitstream/ 10665/79199/1/9789241505345_eng.pdf.
19. Onozaki I, Law I, Sismanidis C, Zignol M, Glaziou P, Floyd K. National TB prevalence surveys in Asia, 1990–2012: an overview of results and lessons learned. Trop Med Int Health. 2015; 20:1128–1145. doi:10.1111/tmi.12534PMID:25943163
20. World Health Organization. Tuberculosis (TB): case notifications. 2015 [cited 26 May 2015]. Available:
http://www.who.int/tb/country/data/download/en/.
21. United Nations Department of Economic and Social Affairs. World population prospects: the 2012 revision. New York: United Nations Department of Economic and Social Affairs; 2013.
22. World Health Organization. Tuberculosis (TB): WHO TB burden estimates. 2015 [cited 26 May 2015]. Available:http://www.who.int/tb/country/data/download/en/.
23. World Health Organization. Global Health Observatory data repository: prevalence of HIV among adults aged 15 to 49—estimates by WHO region. 2015 [cited 26 May 2015]. Available:http://apps. who.int/gho/data/node.main.622?lang=en.
24. Joint United Nations Programme on HIV/AIDS. UNAIDS terminology guidelines. 2011 Oct [cited 2 Aug 2016]. Available:http://files.unaids.org/en/media/unaids/contentassets/documents/ unaidspublication/2011/JC2118_terminology-guidelines_en.pdf.
25. World Health Organization. Global tuberculosis report 2014. WHO/HTM/TB/2014.08. 2014 [cited 2 Aug 2016]. Available:http://apps.who.int/iris/bitstream/10665/137094/1/9789241564809_eng.pdf.
26. Clopper C, Pearson E. The use of confidence or fiducial limits illustrated in the case of the binomial. Biometrika. 1934:404–413. doi:10.1093/biomet/26.4.404
27. Higgins J, Thompson S, Deeks J, Altman D. Measuring inconsistency in meta-analyses. BMJ. 2003; 327:557. doi:10.1136/bmj.327.7414.557PMID:12958120
28. R Core Team. R: a language and environment for statistical computing. Version 3.2.2. Vienna: R Foundation for Statistical Computing; 2015.
29. Aggarwal AN, Gupta D, Agarwal R, Sethi S, Thakur JS, Anjinappa SM, et al. Prevalence of pulmonary tuberculosis among adults in a north Indian district. PLoS ONE. 2015; 10:e0117363. doi:10.1371/ journal.pone.0117363PMID:25695761
30. Akhtar S, White F, Hasan R, Rozi S, Younus M, Ahmed F, et al. Hyperendemic pulmonary tuberculo-sis in peri-urban areas of Karachi, Pakistan. BMC Public Health. 2007; 7:70. doi: 10.1186/1471-2458-7-70PMID:17477870
32. Ayles H, Schaap A, Nota A, Sismanidis C, Tembwe R, De Haas P, et al. Prevalence of tuberculosis, HIV and respiratory symptoms in two Zambian communities: implications for tuberculosis control in the era of HIV. PLoS ONE. 2009; 4:e5602. doi:10.1371/journal.pone.0005602PMID:19440346
33. Ayles H, Muyoyeta M, Du Toit E, Schaap A, Floyd S, Simwinga M, et al. Effect of household and com-munity interventions on the burden of tuberculosis in southern Africa: the ZAMSTAR comcom-munity-ran- community-ran-domised trial. Lancet. 2013; 382:1183–1194. doi:10.1016/s0140-6736(13)61131-9PMID:23915882
34. Banda R, Munthali A, Mpunga J. Findings from the first Malawi TB prevalence survey. 46th Union World Conference on Lung Health; 2015 Dec 2–6; Cape Town, South Africa.
35. Banu S, Rahman MT, Uddin MK, Khatun R, Ahmed T, Rahman MM, et al. Epidemiology of tuberculo-sis in an urban slum of Dhaka City, Bangladesh. PLoS ONE. 2013; 8:e77721. doi:10.1371/journal. pone.0077721PMID:24204933
36. Basta PC, Coimbra CE Jr, Escobar AL, Santos RV, Alves LC, Fonseca L de S. Survey for tuberculosis in an indigenous population of Amazonia: the Surui of Rondonia, Brazil. Trans R Soc Trop Med Hyg. 2006; 100:579–585. doi:10.1016/j.trstmh.2005.07.014PMID:16274716
37. Basta PC, Coimbra CE Jr, Welch JR, Correa Alves LC, Santos RV, Bastos Camacho LA. Tuberculo-sis among the Xavante Indians of the Brazilian Amazon: an epidemiological and ethnographic assess-ment. Ann Hum Biol. 2010; 37:643–657. doi:10.3109/03014460903524451PMID:20113213
38. Berhe G, Enqueselassie F, Hailu E, Mekonnen W, Teklu T, Gebretsadik A, et al. Population-based prevalence survey of tuberculosis in the Tigray region of Ethiopia. BMC Infect Dis. 2013; 13:448. doi:
10.1186/1471-2334-13-448PMID:24073793
39. Bhat J, Rao VG, Gopi PG, Yadav R, Selvakumar N, Tiwari B, et al. Prevalence of pulmonary tubercu-losis amongst the tribal population of Madhya Pradesh, Central India. Int J Tuberc Lung Dis. 2009; 38:1026–1032. doi:10.1093/ije/dyp222
40. Bjerregaard-Andersen M, da Silva ZJ, Ravn P, Ruhwald M, Andersen PL, Sodemann M, et al. Tuber-culosis burden in an urban population: a cross sectional tuberTuber-culosis survey from Guinea Bissau. BMC Infect Dis. 2009; 10:96. doi:10.1186/1471-2334-10-96
41. Chadha VK, Kumar P, Anjinappa SM, Singh S, Narasimhaiah S, Joshi MV, et al. Prevalence of pulmo-nary tuberculosis among adults in a rural sub-district of South India. PLoS ONE. 2012; 7:e42625. doi:
10.1371/journal.pone.0042625PMID:22956993
42. Claassens M, van Schalkwyk C, den Haan L, Floyd S, Dunbar R, van Helden P, et al. High prevalence of tuberculosis and insufficient case detection in two communities in the Western Cape, South Africa. PLoS ONE. 2013; 8:e58689. doi:10.1371/journal.pone.0058689PMID:23560039
43. Corbett EL, Bandason T, Cheung YB, Makamure B, Dauya E, Munyati SS, et al. Prevalent infectious tuberculosis in Harare, Zimbabwe: burden, risk factors and implications for control. Int J Tuberc Lung Dis. 2009; 13:1231–1237. PMID:19793427
44. Corbett EL, Bandason T, Duong T, Dauya E, Makamure B, Churchyard GJ, et al. Comparison of two active case-finding strategies for community-based diagnosis of symptomatic smear-positive tubercu-losis and control of infectious tubercutubercu-losis in Harare, Zimbabwe (DETECTB): a cluster-randomised trial. Lancet. 2010; 376:1244–1253. doi:10.1016/s0140-6736(10)61425-0PMID:20923715
45. Demissie M, Zenebere B, Berhane Y, Lindtjorn B. A rapid survey to determine the prevalence of smear-positive tuberculosis in Addis Ababa. Int J Tuberc Lung Dis. 2002; 6:580–584. PMID:
12102296
46. den Boon S, White NW, van Lill SW, Borgdorff MW, Verver S, Lombard CJ, et al. An evaluation of symptom and chest radiographic screening in tuberculosis prevalence surveys. Int J Tuberc Lung Dis. 2006; 10:876–882. PMID:16898372
47. Deribew A, Abebe G, Apers L, Abdissa A, Deribe F, Woldemichael K, et al. Prevalence of pulmonary TB and spoligotype pattern of Mycobacterium tuberculosis among TB suspects in a rural community in Southwest Ethiopia. BMC Infect Dis. 2012; 12:54. doi:10.1186/1471-2334-12-54PMID:22414165
48. Dhanaraj B, Papanna MK, Adinarayanan S, Vedachalam C, Sundaram V, Shanmugam S, et al. Prev-alence and risk factors for adult pulmonary tuberculosis in a metropolitan city of south India. PLoS ONE. 2015; 10:e0124260. doi:10.1371/journal.pone.0124260PMID:25905900
49. Gasana M, Uwizeye C, Migambi P, Klinkenberg E, Ndahindwa V. Report of the first national pulmo-nary tuberculosis prevalence survey in Rwanda. Kigali (Rwanda): Ministry of Health; 2014. 50. Gopi PG, Subramani R, Radhakrishna S, Kolappan C, Sadacharam K, Devi TS, et al. A baseline
sur-vey of the prevalence of tuberculosis in a community in south India at the commencement of a DOTS programme. Int J Tuberc Lung Dis. 2003; 7:1154–1162. PMID:14677890
52. Guwatudde D, Zalwango S, Kamya MR, Debanne SM, Diaz MI, Okwera A, et al. Burden of tuberculo-sis in Kampala, Uganda. Bull World Health Organ. 2003; 81:799–805. PMID:14758406
53. Hamid Salim MA, Declercq E, Van Deun A, Saki KA. Gender differences in tuberculosis: a prevalence survey done in Bangladesh. Int J Tuberc Lung Dis. 2004; 8:952–957. PMID:15305476
54. Hamusse S, Demissie M, Lindtjorn B. Prevalence and incidence of smear positive pulmonary tubercu-losis in the Hetosa District of Arsi Zone, Oromia Regional State, Central Ethiopia. 46th Union World Conference on Lung Health; 2015 Dec 2–6; Cape Town, South Africa.
55. Hoa NB, Sy DN, Nhung NV, Tiemersma EW, Borgdorff MW, Cobelens FG. National survey of tubercu-losis prevalence in Viet Nam. Bull World Health Organ. 2010; 88:273–280. doi:10.2471/blt.09. 067801PMID:20431791
56. Horie T, Lien LT, Tuan LA, Tuan PL, Sakurada S, Yanai H, et al. A survey of tuberculosis prevalence in Hanoi, Vietnam. Int J Tuberc Lung Dis. 2007; 11:562–566. PMID:17439682
57. John S, Gidado M, Tahir D, Nyako N, Ray T. Active tuberculosis case finding among nomadic pasto-ralists of northern Nigeria. Int J Tuberc Lung Dis. 2013; 17(12 Suppl 2):S446–S447.
58. Joshi YP, Mishra PN, Joshi DD. Prevalence of pulmonary tuberculosis in far Western Nepal. JNMA J Nepal Med Assoc. 2005; 44:47–50. PMID:16554871
59. Kolappan C, Subramani R, Radhakrishna S, Santha T, Wares F, Baskaran D, et al. Trends in the prevalence of pulmonary tuberculosis over a period of seven and half years in a rural community in south India with DOTS. Indian J Tuberc. 2013; 60:168–176. PMID:24000495
60. Law I, Sylavanh P, Bounmala S, Nzabintwali F, Paboriboune P, Iem V, et al. The first national TB prev-alence survey of Lao PDR (2010–2011). Trop Med Int Health. 2015; 20:1146–1154. doi:10.1111/tmi. 12536PMID:25939366
61. Legesse M, Mamo G, Ameni G, Medhin G, Bjune G, Abebe F. Community-based prevalence of undi-agnosed mycobacterial diseases in the Afar Region, north-east Ethiopia. Int J Mycobacteriol. 2013; 2:94–102. doi:10.1016/j.ijmyco.2013.04.001PMID:26785896
62. Ley SD. Tuberculosis active case detection in sentinel sites across Papua New Guinea. Am J Trop Med Hyg. 2011; 1:74.
63. Lolong D, Pangaribuan I, Musadad A, Dwihardiani M, Mustikawati D. Results from the national TB prevalence survey of Indonesia. Int J Tuberc Lung Dis. 2014; 18(11 Suppl 1):S43.
64. Lorent N, Choun K, Thai S, Kim T, Huy S, Pe R, et al. Community-based active tuberculosis case find-ing in poor urban settlements of Phnom Penh, Cambodia: a feasible and effective strategy. PLoS ONE. 2014; 9:e92754. doi:10.1371/journal.pone.0092754PMID:24675985
65. Mao TE, Okada K, Yamada N, Peou S, Ota M, Saint S, et al. Cross-sectional studies of tuberculosis prevalence in Cambodia between 2002 and 2011. Bull World Health Organ. 2014; 92:573–581. doi:
10.2471/BLT.13.131581PMID:25177072
66. Middelkoop K, Bekker LG, Myer L, Whitelaw A, Grant A, Kaplan G, et al. Antiretroviral program associ-ated with reduction in untreassoci-ated prevalent tuberculosis in a South African township. Am J Respir Crit Care Med. 2010; 182:1080–1085. doi:10.1164/rccm.201004-0598OCPMID:20558626
67. Cambodia Ministry of Health. Report of the national TB prevalence survey, 2002. Phnom Penh: Cam-bodia Ministry of Health; 2005.
68. Ethiopia Ministry of Health. First Ethiopian national population based tuberculosis prevalence survey. Addis Ababa: Ethiopia Ministry of Health; 2011.
69. Myanmar Ministry of Health. Sputum positive point prevalence survey (1994). Yangon: Myanmar Ministry of Health; 1994.
70. Myanmar Ministry of Health. Report on national TB prevalence survey 2009–2010, Myanmar. Yan-gon: Myanmar Ministry of Health; 2011.
71. Nigeria Ministry of Health. First national TB prevalence survey 2012, Nigeria. Abuja: Nigeria Ministry of Health; 2012.
72. Zambia Ministry of Health. National tuberculosis prevalence survey 2013–2014 technical report. Lusaka: Zambia Ministry of Health; 2015.
73. Tanzania Ministry of Health and Social Welfare. The first national tuberculosis prevalence survey. Pri-mary analysis. Final report. Dar es Salaam: Tanzania Ministry of Health and Social Welfare; 2013.
74. Gambia Ministry of Health and Social Welfare. The Gambian survey of tuberculosis prevalence (GAM-STEP). Banjul: Gambia Ministry of Health and Social Welfare; 2014.
76. Mukhopadhyay S, Cornelius S, Biswal S, Edward V, Jose M, Shukla V, et al. Improving tuberculosis case detection in difficult-to-reach villages of Chhattisgarh and Madhya Pradesh, India, through a door-to-door tuberculosis campaign. Int J Tuberc Lung Dis. 2014; 17(12 Suppl 2):S344. 77. Murhekar MV, Kolappan C, Gopi PG, Chakraborty AK, Sehgal SC. Tuberculosis situation among
tribal population of Car Nicobar, India, 15 years after intensive tuberculosis control project and imple-mentation of a national tuberculosis programme. Bull World Health Organ. 2004; 82:836–843. PMID:
15640919
78. Nduba V, Van’t Hoog AH, Mitchell E, Onyango P, Laserson K, Borgdorff M. Prevalence of tuberculosis in adolescents, western Kenya: implications for control programs. Int J Infect Dis. 2015; 35:11–17. doi:10.1016/j.ijid.2015.03.008PMID:25770911
79. Nguyen T, Nguyen P, Nhung N, Nguyen B, Tran K, Ho J, et al. Prevalent tuberculosis detected by active case finding among adults in the community in Ca Mau, Viet Nam. 46th Union World Confer-ence on Lung Health; 2015 Dec 2–6; Cape Town, South Africa.
80. Onazi O, Gidado M, Onoh M, Yisa J, Obasanya J, Eneogu R, et al. Innovative approaches for increased case finding: the role of house-to-house in TB case finding. Int J Tuberc Lung Dis. 2014; 18 (11 Suppl 1):S461.
81. Pronyk PM, Joshi B, Hargreaves JR, Madonsela T, Collinson MA, Mokoena O, et al. Active case find-ing: understanding the burden of tuberculosis in rural South Africa. Int J Tuberc Lung Dis. 2001; 5:611–618. PMID:11467367
82. Qadeer E, Fatima R, Tahseen S, Samad Z, Kalisvaart N, Tiemersma E, et al. Prevalence of pulmo-nary tuberculosis among the adult population in Pakistan 2010–2011. Islamabad (Pakistan): National TB Control Program; 2013.
83. Rao VG, Bhat J, Yadav R, Gopi PG, Selvakumar N, Wares DF. Prevalence of pulmonary tuberculosis among the Bharia, a primitive tribe of Madhya Pradesh, central India. Int J Tuberc Lung Dis. 2010; 14:368–370. PMID:20132630
84. Rao VG, Gopi PG, Bhat J, Selvakumar N, Yadav R, Tiwari B, et al. Pulmonary tuberculosis: a public health problem amongst the Saharia, a primitive tribe of Madhya Pradesh, Central India. Int J Infect Dis. 2010; 14:e713–6. doi:10.1016/j.ijid.2010.02.2243PMID:20605504
85. Rao VG, Bhat J, Yadav R, Gopalan GP, Nagamiah S, Bhondeley MK, et al. Prevalence of pulmonary tuberculosis—a baseline survey in central India. PLoS ONE. 2012; 7:e43225. doi:10.1371/journal. pone.0043225PMID:22952651
86. Rekha Devi K, Narain K, Mahanta J, Deori R, Lego K, Goswami D, et al. Active detection of tuberculo-sis and paragonimiatuberculo-sis in the remote areas in North-Eastern India using cough as a simple indicator. Pathog Glob Health. 2013; 107:153–156. doi:10.1179/2047773213y.0000000086PMID:23683370
87. Romero-Sandoval NC, Flores-Carrera OF, Sanchez-Perez HJ, Sanchez-Perez I, Mateo MM. Pulmo-nary tuberculosis in an indigenous community in the mountains of Ecuador. Int J Tuberc Lung Dis. 2007; 11:550–555. PMID:17439680
88. Rumman KA, Sabra NA, Bakri F, Seita A, Bassili A. Prevalence of tuberculosis suspects and their healthcare-seeking behavior in urban and rural Jordan. Am J Trop Med Hyg. 2008; 79:545–551. PMID:18840742
89. Sebhatu M, Kiflom B, Seyoum M, Kassim N, Negash T, Tesfazion A, et al. Determining the burden of tuberculosis in Eritrea: a new approach. Bull World Health Organ. 2007; 85:593–599. PMID:
17768517
90. Sekandi JN, Neuhauser D, Smyth K, Whalen CC. Active case finding of undetected tuberculosis among chronic coughers in a slum setting in Kampala, Uganda. Int J Tuberc Lung Dis. 2009; 13:508– 513. PMID:19335958
91. Sekandi JN, List J, Luzze H, Yin XP, Dobbin K, Corso PS, et al. Yield of undetected tuberculosis and human immunodeficiency virus coinfection from active case finding in urban Uganda. Int J Tuberc Lung Dis. 2014; 18:13–19. doi:10.5588/ijtld.13.0129PMID:24365547
92. Shargie EB, Yassin MA, Lindtjorn B. Prevalence of smear-positive pulmonary tuberculosis in a rural district of Ethiopia. Int J Tuberc Lung Dis. 2006; 10:87–92. PMID:16466043
93. Sharma SK, Goel A, Gupta SK, Mohan K, Sreenivas V, Rai SK, et al. Prevalence of tuberculosis in Faridabad district, Haryana State, India. Indian J Med Res. 2015; 141:228–235. PMID:25900959
94. Soemantri S, Senewe FP, Tjandrarini DH, Day R, Basri C, Manissero D, et al. Three-fold reduction in the prevalence of tuberculosis over 25 years in Indonesia. Int J Tuberc Lung Dis. 2007; 11:398–404. PMID:17394685
96. Tadesse T, Demissie M, Berhane Y, Kebede Y, Abebe M. Two-thirds of smear-positive tuberculosis cases in the community were undiagnosed in Northwest Ethiopia: population based cross-sectional study. PLoS ONE. 2011; 6:e28258. doi:10.1371/journal.pone.0028258PMID:22164256
97. Thorson A, Hoa NP, Long NH, Allebeck P, Diwan VK. Do women with tuberculosis have a lower likeli-hood of getting diagnosed? Prevalence and case detection of sputum smear positive pulmonary TB, a population-based study from Vietnam. J Clin Epidemiol. 2004; 57:398–402. doi:10.1016/j.jclinepi. 2002.11.001PMID:15135842
98. Tupasi TE, Radhakrishna S, Rivera AB, Pascual ML, Quelapio MI, Co VM, et al. The 1997 nationwide tuberculosis prevalence survey in the Philippines. Int J Tuberc Lung Dis. 1999; 3:471–477. PMID:
10383058
99. Tupasi TE, Radhakrishna S, Quelapio MI, Villa ML, Pascual ML, Rivera AB, et al. Tuberculosis in the urban poor settlements in the Philippines. Int J Tuberc Lung Dis. 2000; 4:4–11. PMID:10654637
100. Tupasi T, Radhakrishna S. Significant decline in the tuberculosis burden in the Philippines ten years after initiating DOTS. Int J Tuberc Lung Dis. 2009; 13:1224–1230. PMID:19793426
101. van’t Hoog AH, Laserson KF, Githui WA, Meme HK, Agaya JA, Odeny LO, et al. High prevalence of pulmonary tuberculosis and inadequate case finding in rural western Kenya. Am J Respir Crit Care Med. 2011; 183:1245–1253. doi:10.1164/rccm.201008-1269OCPMID:21239690
102. Vree M, Hoa NB, Sy DN, Co NV, Cobelens FG, Borgdorff MW. Low tuberculosis notification in moun-tainous Vietnam is not due to low case detection: a cross-sectional survey. BMC Infect Dis. 2007; 7:109. doi:10.1186/1471-2334-7-109PMID:17880701
103. Wang L, Zhang H, Ruan Y, Chin DP, Xia Y, Cheng S, et al. Tuberculosis prevalence in China, 1990– 2010; a longitudinal analysis of national survey data. Lancet. 2014; 383:2057–2064. doi:10.1016/ s0140-6736(13)62639-2PMID:24650955
104. Wang Y. Analysis of tuberculosis screening results in six remove villages in Yunnan Province. Int J Tuberc Lung Dis. 2013; 17(12 Suppl 2):S464–S465.
105. Wei X, Zhang X, Yin J, Walley J, Beanland R, Zou G, et al. Changes in pulmonary tuberculosis preva-lence: Evidence from the 2010 population survey in a populous province of China. BMC Infect Dis. 2014; 14:21. doi:10.1186/1471-2334-14-21PMID:24410932
106. Woldesemayat EM, Datiko DG, Lindtjorn B. Follow-up of chronic coughers improves tuberculosis case finding: results from a community-based cohort study in Southern Ethiopia. PLoS ONE. 2015; 10:e0116324. doi:10.1371/journal.pone.0116324PMID:25719541
107. Wood R, Middelkoop K, Myer L, Grant AD, Whitelaw A, Lawn SD, et al. Undiagnosed tuberculosis in a community with high HIV prevalence: implications for tuberculosis control. Am J Respir Crit Care Med. 2007; 175:87–93. doi:10.1164/rccm.200606-759OCPMID:16973982
108. Yadav R, Rao V, Bhat J, Gopi P, Selvakumar N, Wares D. Prevalence of pulmonary tuberculosis amongst the Baigas—a primitive tribe of Madhya Pradesh, Central India. Indian J Tuberc. 2010; 57:114–116. PMID:21114182
109. Yimer S, Holm-Hansen C, Yimaldu T, Bjune G. Evaluating an active case-finding strategy to identify smear-positive tuberculosis in rural Ethiopia. Int J Tuberc Lung Dis. 2009; 13:1399–1404. PMID:
19861013
110. Zaman K, Yunus M, Arifeen SE, Baqui AH, Sack DA, Hossain S, et al. Prevalence of sputum smear-positive tuberculosis in a rural area in Bangladesh. Epidemiol Infect. 2006; 134:1052–1059. doi:10. 1017/s0950268806006108PMID:16569271
111. Zaman K, Hossain S, Banu S, Quaiyum MA, Barua PC, Salim MA, et al. Prevalence of smear-positive tuberculosis in persons aged15 years in Bangladesh: results from a national survey, 2007–2009. Epidemiol Infect. 2012; 140:1018–1027. doi:10.1017/s0950268811001609PMID:21880168
112. Kebede AH, Alebachew Wagaw Z, Tsegaye F, Lemma E, Abebe A, Agonafir M, et al. The first popula-tion-based national tuberculosis prevalence survey in Ethiopia, 2010–2011. Int J Tuberc Lung Dis. 2014; 18:635–639. doi:10.5588/ijtld.13.0417PMID:24903931
113. Joint United Nations Programme on HIV/AIDS. The gap report. UNAIDS/JC2656. Geneva: Joint United Nations Programme on HIV/AIDS; 2014 [cited 2 Aug 2016]. Available:http://www.unaids.org/ sites/default/files/media_asset/UNAIDS_Gap_report_en.pdf.
114. Auld A, Shiraishi R, Mbofana F, Couto A, Fetogang E, El-Halabi S, et al. Lower levels of antiretroviral therapy enrollment among men with HIV compared with women—12 countries, 2002–2013. MMWR Morb Mortal Wkly Rep. 2014; 64:1281–1286. doi:10.15585/mmwr.mm6446a2
116. Geng EH, Nash D, Kambugu A, Zhang Y, Braitstein P, Christopoulos KA, et al. Retention in care among HIV-infected patients in resource-limited settings: emerging insights and new directions. Curr HIV/AIDS Rep. 2010; 7:234–244. doi:10.1007/s11904-010-0061-5PMID:20820972
117. Bor J, Rosen S, Chimbindi N, Haber N, Herbst K, Mutevedzi T, et al. Mass HIV treatment and sex dis-parities in life expectancy: demographic surveillance in rural South Africa. PLoS Med. 2015; 12: e1001905. doi:10.1371/journal.pmed.1001905PMID:26599699
118. Lim SS, Vos T, Flaxman AD, Danaei G, Shibuya K, Adair-Rohani H, et al. A comparative risk assess-ment of burden of disease and injury attributable to 67 risk factors and risk factor clusters in 21 regions, 1990–2010: a systematic analysis for the Global Burden of Disease Study 2010. Lancet. 2013; 380:2224–2260. doi:10.1016/S0140-6736(12)61766-8
119. Wang H, Dwyer-Lindgren L, Lofgren KT, Rajaratnam JK, Marcus JR, Levin-Rector A, et al. Age-spe-cific and sex-speAge-spe-cific mortality in 187 countries, 1970–2010: a systematic analysis for the Global Bur-den of Disease Study 2010. Lancet. 2013; 380:2071–2094. doi:10.1016/S0140-6736(12)61719-X
120. Uplekar M, Rangan S, Weiss M, Ogden J, Borgdorff M, Hudelson P. Attention to gender issues in tuberculosis control. Int J Tuberc Lung Dis. 2001; 5:220–224. PMID:11326820
121. MacPherson P, Houben R, Glynn JR, Corbett E, Kranzer K. Pre-treatment loss to follow-up in tubercu-losis patients in low- and lower-middle-income countries and high-burden countries: a systematic review and meta-analysis. Bull World Health Organ. 2014; 92:77–152. doi:10.2471/BLT.13.124800
122. Waitt CJ, Squire SB. A systematic review of risk factors for death in adults during and after tuberculo-sis treatment. Int J Tuberc Lung Dis. 2011; 15:871–885. doi:10.5588/ijtld.10.0352PMID:21496360
123. van den Hof S, Najlis CA, Bloss E, Straetemans M. A systematic review on the role of gender in tuber-culosis control. KNCV Tubertuber-culosis Foundation. 2010 [cited 2 Aug 2016]. Available:https://www. kncvtbc.org/uploaded/2015/09/Role_of_Gender_in_TB_Control.pdf.
124. Dowdy DW, Basu S, Andrews JR. Is passive diagnosis enough? The impact of subclinical disease on diagnostic strategies for tuberculosis. Am J Respir Crit Care Med. 2013; 187:543–51. doi:10.1164/ rccm.201207-1217OC.PMID:23262515
125. World Health Organization. Gender and tuberculosis Geneva, Switzerland: WHO, Department of Gender and Women’s Health; 2002 [cited 2 Aug 2016]. Available:http://apps.who.int/iris/bitstream/ 10665/68891/1/a85584.pdf.
126. Chikovore J, Hart G, Kumwenda M, Chipungu GA, Corbett L.‘For a mere cough, men must just chew Conjex, gain strength, and continue working’: the provider construction and tuberculosis care-seeking implications in Blantyre, Malawi. Glob Health Action. 2015; 8:26292. doi:10.3402/gha.v8.26292
PMID:25833138
127. Chikovore J, Hart G, Kumwenda M, Chipungu GA, Desmond N, Corbett L. Control, struggle, and emergent masculinities: a qualitative study of men’s care-seeking determi