Experimental and Computational
Study of
Flames Venting Externally
During Full Scale Flashover Fires
.v^-'' ^ o;^.-^
Suzana Klopovic
A thesis submitted to Victoria University of Technology for the
Doctor of Philosophy Degree (Mechanical Engineering)
Victoria University of Technology
FTS THESIS 628.9222 KLO 30001005875242 Klopovic, Suzana Experimental and
DEDICATION
Mama i Tata
Za Ijubav, pomoc i painju kroz godine
va'sa kterka
ACKNOWLEDGMENTS
/ would especially like to thank my principle supervisor Dr. Ozden Turan for her kind
support and invaluable guidance. Her dedication and professionalism helped me develop both as researcher, and academic. Her sincere encouragement, patience and friendship have heen an inspirational example during the arduous task of completing this thesis.
I must thank my co-supervisor Prof. Vaughan Beck for his assistance and commitment. The world class experimental fire facility created by him via the Centre for Environmental Safety and Risk Engineering, allowed the study of full scale fires, without which none ofm-y research would have been possible. As such I wish to extend my sincerest thanks to Scott Steward and Martin Cole, who run the facility. Their experience in experimental testing and instrumentation has shown me the difficulties and challenges associated with researching fiashover fires. I must also acknowledge the efforts of Dr. Mingchun Luo in the computer modelling aspects of this thesis, of Dr. Yaping He for his help in finding references along with the discussions we had, and of Prof. Paula Beeverfor her invaluable insight and guidance in reviewing this thesis. Finally, I must extend m-y thanks and appreciation to Teresa Alam whose project management skills and professionalism, along with her support and friendship helped considerably.
I would like to thank the Department of Mechanical Engineering for their unrelenting belief in my abilities. I am especially grateful to Dr. Michael Sek who first suggested I do a PhD. It was his initial encouragement and his thirst for knowledge and understanding which allowed me to see the rewards of doing research. I should also thank Denise Colledge, Marlene Schutt, Ray Mcintosh, and all the other teaching and technical staff of the Department. Finally, my gratitude must be extended to my fellow postgraduate students and friends, Ben Bruscella, Katya Nyankina, fulie Han, Dana Stanca, Simone Lewis, Anthony Fernando andferemy Anderson who helped me keep my sanity.
ABSTRACT
In this study, externally venting flames have been examined during two series of full scale flashover fires. The purpose of the work is to investigate the likelihood of external fire spread from a burn room window with standard glass, when the extemal facade is non-combustible. The effects on externally venting flames of internal ventilation conditions, burning rate, burn room size and wind have been studied in detail. Secondary fires and glass breakage have been examined.. Repeatable experimental data and reliable information on externally venting flames have been generated for numerical model validation and performance based design code development.
During the first series of tests, polyurethane fuel was used in a standard burn room. With the results of the first series, the second series of tests were designed to be repeatable to generate reliable data. The second series of tests were performed in a larger burn room with furniture as fuel. In addition to repeatability, a new data averaging method was developed. Extensive comparisons were made with available experimental data and empirical approximations from the literature. Curve fits to the experimental data were developed for communication purposes. The experimental results were compared with limited numerical predictions.
SUMMARY
This thesis focuses on the effect of compartment ventilation conditions on flames as they emerge/vent from window openings in buUdings with non-combustible external facades during full-scale flashover fires. As such, it is the first comprehensive fuU-scale study which focuses on the characteristics of emerging flames in a three-dimensional region above the window opening. The three major reasons for carrying out this work were to investigate the UkeUhood of extemal fire spread from a bum room window with standard glass, to produce repeatable experimental data for numerical model vaUdation and to provide reliable information for performance based design code development and evaluation.
Two series of full-scale flashover experiments were designed to investigate externally venting flames. The first series of four tests was designed as a preUminary investigation into the venting of external flames during flashover fires, with polyurethane (PU) as the fuel source in a standard size burn room with a glazed window. This particular feature is rarely discussed elsewhere in the literature. The slabs of PU were arranged to mimic a bed and carpet, and the effects of a closed or open door on the growth of the fire were studied. As the fire developed, the burn room window faUed, although it was closed initiaUy. Failing of the glass allowed flames and smoke to vent from the window opening. Temperatures were measured on a two-dimensional cross section of the plume above the burn room window. The centre plane had been chosen for this purpose, between the burn room window and the window above. Total and racUative heat flux measurements on the external facade of the building were also taken, along with velocity and gas composition measurements. The effect of two different window arrangements were investigated, with a constant window size and fuel load.
possible on the floor above. Observations of flame envelope were consistent with earher empirical approximations for residential type buildings based on full-scale tests using mostly wood crib fires. However, the centre-line temperatures were over-estimated using similar approximations, most likely due to the tilting of the plume with respect to the external 2D thermocouple rack. The tiking caused the rack to miss the centre plane of the venting plume. This result was one of the reasons for developing a 3D external thermocouple grid for the second series of tests.
The second series of eight tests was designed based on the results of the first series. The second series also focused on the effeas of the internal ventilation conditions on the venting flames and plume. To produce more reaUstic results, a larger burn room, representative of a living or lounge room was used, with commercially available (real) furniture. Temperature measurements were expanded to allow a three-dimensional map of the venting plume to be made. The new three-dimensional thermocouple grid extended approximately along the width of the burn room window, up to the window above and away from the external facade. ExtemaUy, total and radiative heat flux measurements were also taken. InternaUy, flow velocities into the burn room, gas composition, temperature and mass loss rates were recorded. The Smoke Management System (SMS) was activated during two of the tests to determine how it would influence the fire. Also, combustible lining was mounted in the corridor for one of the tests.
and Class 2 is when the burn room door is closed, and the window is opened according to another WLC. Depending on the intemal ventUation conditions, the standard glass in the burn room window affected fire spread differently. During Class 1 tests, failure of the burn room window resulted in extemal fire spread, while during Class 2 tests, the window did not fail on its own. However, flashover was faciUtated by lowering the entire window to determine what would have happened if the window had failed (such as due to type or manufacturing defects). Consequently, bowing of the bum room window was an important factor due to its possible contribution to window faUure.
Consistent External Flaming, CEF, covers a period during the fuUy developed phase, where externally venting flames consistently cover the region above the opening. This time period was determined for each test using bum room temperature and mass loss data, external temperatures and visual observations. Once CEF was defined, all extemal temperature and heat flux data were averaged over this period. Given the large volume of instantaneous data coUected during these series of tests, CEF averaging allowed the data to be compiled into a form compatible with model outputs. It also eUminated randomness of the data over time due to turbulence.
The 3D external temperature measurements were presented using contour plots which focused on three specific planes: the centre plane (Plane 3), which corresponds to the same region as used during the first series of tests; a plane paraUel to the external waU above the burn room window (Face 1), and a horizontal plane (Level 4) corresponding to the centre of the window above the room of fire origin. Three-dimensional temperature contour plots were also generated to provide an overall impression of the venting plume.
The conclusions reached at the end of the second series of tests were as follows. The implementation of the WLC, CEF averaging, non-dimensionalisation and grouping the tests according to specific mternal ventilation conditions aUowed repeatability to be gauged. It was found that the tests were very repeatable, with the exception of two tests which were unduly influenced by external wind.
Temperature and heat flux resuhs were evaluated in terms of the initiation of secondary fires, and it was found that direct flame contact posed a greater risk than radiative heat transfer alone, through the wmdow above the room or level of fire origin. The activation of the smoke management system (SMS) was observed to facUitate flashover during a Class 2 test which would not have otherwise progressed mto a fuUy developed fire, by contributing to the bowmg and subsequent failure of the burn room window. Bowing of the burn room window was also observed durmg these tests when external wind speeds were higher than anticipated. Such winds also contributed to the substantial swirUng of the venting plume during three of the tests. The swirling plume was observed to have a diameter of approximately the width of the burn room window with a period of just over 1 second. FinaUy, the use of combustible waU linings in the corridor were not found to significantly influence the extemaUy venting flames, however, within the building, higher temperatures and smoke levels were recorded.
CONTENTS
DEDICATION ii ACKNOWLEDGMENTS iii
ABSTRACT iv SUMMARY v
TABLE OF CONTENTS ix
LIST OF TABLES xiv LIST OF FIGURES xvi NOMENCLATURE xxii
1. INTRODUCTION
1.1 THE DEVELOPMENT OF Two SERIES OF TESTS 2
1.1.1 VENTILATION CONDITIONS 3
1.1.2 TEST METHODOLOGY 4
1.2 CONSISTENT EXTERNAL FLAMING (CEF) 6
1.3 THESIS STRUCTURE 7
2. BACKGROUND
2.1 COMPARTMENT FIRES 9
2.1.1 THE PRE-FLASHOVER COMPARTMENT l o
2.1.2 FLASHOVER/FULLY DEVELOPED FIRES 11
2.2 FIRE SPREAD BEYOND THE ROOM OF FIRE ORIGIN 13
2.3 FIRE PLUMES 15
2.4EARLYE5A>ERIMENRALSRUDIESCXVEXTERNAIIA'VENNNGELAMES 1 8
2.4.1 THE VENTING PLUME 23
2.4.1.1 Rate of Burning 23 2.4.1.2 Extemal Plume Shape 24 2.4.1.3 Centre-Line Temperature 26 2.4.1.4 Convective & Radiative Heat Transfer 27
2.4.1.5 Excess Fuel Factor 29
2.6 EXTERNALLY VENTING FLAMES - ADDITIONAL CONSTOERATIONS 33
2.6.1 SMOKE MANAGEMENT SYSTEMS 33
2.6.2 GLASS BREAKAGE 34
2.6.3 HORIZONTAL AND VERTICAL PROJECTIONS 35
2.6.4 ENVIRONMENTAL EFFECTS 3 6
2.7 NUMERICAL MODELLING 39
2.7.1 MODELLING OF EXTERNALLY VENTING FLAMES 39
3. EXPERIMENTAL SETUP 43
3.1 POLYURETHANE BURNS 43
3.1.1 THE BUILDING AND THE BURN ROOM 43
3.1.2 FUEL CONFIGURATION 47
3.1.3 EXPERIMENTAL CONDITIONS 48
3.1.4 INTERNAL INSTRUMENTATION 49
3.1.4.1 Mass Loss Platform 50
3.1.5 EXTERNAL INSTRUMENTATION 50
3.1.5.1 The Co-ordinate System for the 2D Extemal Rack 50
3.1.5.2 Thermocouples 51 3.1.5.3 Heat Flux Transducers 5 3
3.1.5.4 Velocity Probes 55 3.1.5.5 Gas Analysis 55
3.2 REAL FURNITURE BURNS 56
3.2.1 THE BURN ROOM 56
3.2.2 WINDOW LOWERING CRITERIA 56
3.2.3 FUEL CONFIGURATION ' 5-7
3.2.4 EXPERIMENTAL CONDITIONS 61
3.2.5 INTERNAL INSTRUMENTATION 62
3.2.5.1 Mass Loss Platforms 65 3.2.5.2 Velocity Probes 65 3.2.5.3 Ignition Source 65
3.2.6 EXTERNAL INSTRUMENTATION 66
3.2.6.1 The Co-Ordinate System for the 3D Extemal Thermocouple Grid 66
3.2.6.2 Heat Flux Transducers 67
3.2.7.1 Data Logging System 69 3.2.7.2 Data Analysis Using MATLAB 71
3.2.8 COMBUSTIBLE LINING IN THE CORRIDOR 72
3.2.9 AIR HANDLING AND SMOKE MANAGEMENT SYSTEMS 72
4. POLYURETHANE BURNS - DISCUSSION OF RESULTS 74
4.1 INTRODUCTION 74 4.2 EXTERNAL TEMPERATURE RESULTS 76
4.2.1 TEMPERATURES ABOVE THE CENTRE OF THE BURN ROOM WINDOW 76
4.2.2 TEMPERATURE CONTOUR MAPS OF THE 2D RACK AND 3D GRID 80
4.2.3 EXCESS FUEL FACTOR 87
4.2.4 ESTIMATING FLAME ENVELOPE AND CENTRE-LINE TEMPERATURES 8 8
4.3 EXTERNAL HEAT FLUX RESULTS 93 4.3.1 VERTICAL AND HORIZONTAL HEAT FLUX VARIATION 93
4.3.2 HEAT FLUX ALONG THE BOTTOM OF W1M02 95
4.3.3 TOTALANDRADIATIVEHEATRUXATTHEBOTTOMCENTREOFW1M02 98
4.3.4 CALCULATED HEAT FLUX 99
4.4 WINDOW GLASS BREAKAGE 103 4.5 EXHAUST FLOW VELOCITIES 105 4.6 OXYGEN CONCENTRATIONS/GAS ANALYSIS 107
4.7 CONCLUSIONS FROM THE POLYURETHANE BURNS 110
5. REAL FURNITURE BURNS - DISCUSSION OF RESULTS US
5.1 INTRODUCTION 115 5.2 VENTILATION CLASSES AND THE VENTING PLUME 117
5.3 CONSISTENT EXTERNAL FLAMING (CEF) 127
5.4 TEMPERATURE CONTOUR PLOTS 130 5.4.1 VENTILATION CLASS 1A - BURN 1 & BURN 2 132
5.4.2 VENTILATION CLASS 1B - BURN 5 & BURN 8 138
5.4.2.1 Plane 3 138
5.4.2.2 Face 1 139
5.4.2.3 Level 4 140
5.4.2.4 Level 1 to Level 5 14^
5.4.3 VENTILATION CLASS 2 - BURN 4 & BURN 7 l'*2
5.4.3.1 Plane 3 142 5.4.3.2 Face 1 143 5.4.3.3 Level 4 143 5.4.3.4 Level 1 to Level 5 " 144
5.5 REPEATABILITY 146 5.5.1 MASS LOSS RATES 146
5.5.2 REPEATABILITY OF EXTERNAL TEMPERATURE MEASUREMENTS 149
5.5.3 QUANTIFYING THE REPEATABILITY OF EXTERNAL TEMPERATURE
MEASUREMENTS 155
5.6 ESTIMATING PLUME FLAME ENVELOPE AND CENTRE-LINE TEMPERATURE 157
5.6.1 THE FLAME ENVELOPE AND COMPARISON WITH OTHER WORK 157
5.6.2 THE CENTRE-LINE TEMPERATURE AND COMPARISON WITH OTHER WORK 163
5.6.3 FURTHER COMPARISONS WITH OTHER WORK: CENTRE-LINE TEMPERATURE,
RE-ATTACHMENT. SPANDREL LENGTH AND EXCESS FUEL FACTOR 168
5.6.4 CENTRE PLANE TEMPERATURE DISTRIBUTION ON FACE 1, FACE 2 & FACE 3 175
5.6.5 TEMPERATURE DISTRIBUTION ACROSS EACH FACE OF THE GRID 178
5.7 SECONDARY FIRES 184 5.7.1 DIRECT FLAME CONTACT 184
5.7.1.1 Window Cracking Times ~ WlOl and W1M02 185
5.7.2 HEAT TRANSFER 187
5.8 EFFECTS DUE TO WIND AND SMOKE MANAGEMENT SYSTEM 194
5.8.1 BURN 3 194
5.8.2 SWIRLING 197
5.8.3 SMOKE MANAGEMENT SYSTEMS 201
5.8.4 BOWING OF THE BURN ROOM WINDOW AND SMS 202
6. NUMERICAL PREDICTION OF THE EXTERNAL TEMPERATURE FIELD 212
6.1 INTRODUCTION 212
6.2 NUMERICAL RESULTS AND COMPARISON WITH EXPERIMENTAL DATA 214
6.3 CONCLUSIONS FROM THE NUMERICAL PREDICTIONS 221
7. CONCLUSIONS 222
REFERENCES 228
APPENDICES 237 Appendix A: Calculated Spandrel Heights 238
Appendix B: Experimental Building Fire Facility Plans 239
Appendix C: Fuel Load and Layout for Burn 1 246
Appendix D: MATLAB Programs 247
Appendix E: Estimating Compartment Temperature 267 Appendix F: Co-efficients for each Face for Burns 2,4 and 8 269
Appendix G: Sample Input and Output from CESARE-CFD 271
FOLDOUTS
List of Tables
Table 1.1: Class distinctions for the Polyurethane and Real Furniture Bums.
47
Table 3.1: Fud load for each of the PU tests. .
Table 3.2: Environmental conditions and test durations for PUl to PU4. _ 48
49
Table 3.3: Ventilation conditions. —
58
Table 3.4: Fuel breakdown for Bum 2. ^ .^ .
Table 3.5: Fuel load, ventilation conditions and additional factors. _____ ^i Table 3.6: Environmental conditions.
Table 4.1: Calculated flame envelope. °° Table 4.2: Observed flame shape during the CEF period. *^
Table 4.3: Measured bum room and extemal centre-line temperatures during CEF period. 90
Table 4.4: Calculated centre-line temperatures on Face 2. ^0
Table 4.5: Flame emissivity determined using constant and variable flame thickness. 100
Table 4.6 Center-line temperatures and buming rates measured during the CEF period. 100
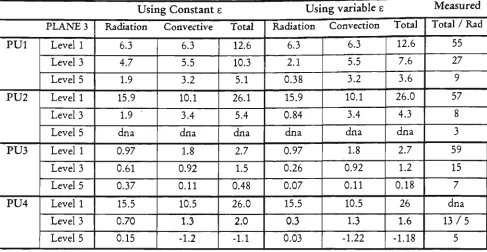
Table 4.7: Calculated radiative, convective and total heat flux and measured total and radiative heat
flux in kW/m^, at Level 1, Level 3 and Level 5 on the extemal wall. 102
Table 4.8: Measured heat flux, hf, in k W/m\ averaged over the CEF period. 102 Table 4.9: Time from ignition to initial cracking for PUl to PU3 and to lowering for PU4 of the bum
room window, WlOl, and time to dislodgment of the window in the floor above, W1M02. 104
Table 4.10: Summary of information gathered for the Polyurethane Bums. 110
Table 5.1: Summary of fuel load, environmental conditions, WLC and Class specifications, based on
Table3.5--and Table3.6": 118
Table 5.2: Class la event/time histories. 118 Table 5.3: Class lb event/time histories. 119 Table 5.4: Class 2 event/time histories.. 120 Table 5.5: Duration of CEF, T„^ and T^„i, used in non-dimensionalisation of the data. 128
Table 5.6: Statistical analysis of experimental data of extemal temperature contours to determine
repeatability. 156
Table 5.7: Calculated flame envelope. 159 Table 5.8: Observed flame shape. 159 Table 5.9: Measured peak and average bum room temperatures and extemal centre-line temperatures
averaged over CEF. 164
Table 5.11: Coefficients and variables of the 3D polynomial 180 Table 5.12: Time from ignition to window cracking, flashover and CEF. Failure times include time
of initial crack and of initial dislodgment of the Floor IM window. 187
Table 5.13: Flame emissivity determined using constant and variable flame thicknesses.. 188 Table 5.14: Center-line temperatures and buming rates measured during the CEF period. 189 Table 5.15: Calculated radiative, convective and total heat flux, k W/m^, at Level 1, Level 3 and Level
4. 189
Table 5.16: Measured heat flux, hf, in kW/m\
Table 5.17: Bowing of the hum room window, W102.
Table 5.18: Summary of information gathered for the Real Furniture Bums.
190
_203
204
Table Al: Calculated values of the necessary spandrel height 238
Table Cl: Fuel Breakdown for Bum 1 246
Table Fl: Co-efficients for Faces 2, 3 and 4 for Bum 2.
Table F2: Co-efficients for Faces 2, 3 and 4 for Bum 4. Table F3: Co-efficients for Faces 2, 3 and 4 for Bum 8.
269
269
List of Figures
Figure 2.1: Stages of afire's development in an enclosure. ^
Figure 2.2: Features of a fire plume. J^ Figure 2.3: Regions of a fire plume. 1^ Figure 2.4: Buoyant flow out of a window opening during a room fire. -^7
Figure 2.5: Topviewofan emerging plume for a through draft - Class 1 ventilation condition. 25 Figure 2.6: Side view of an emerging flame for a through draft - Class 1 ventilation condition. 25 Figure 2.7: Top view of an emerging plume for a no-through-draft Class 2 ventilation condition. 26 Figure 2.8: Side view of an emerging plume for a no-through-draft Class 2 ventilation condition. 26 Figure 2.9: Modified flame shape used to determine heat transfer effects to the extemal wall from the
emerging plume. _28
Figure 2.10: Original and modified shapes of a venting plume due to horizontal and vertical
projections. 36
Figure 3.1: Floor 1 - Plan view including instrumentation within the standard bum room for PUl to
PU3. 45
Figure 3.2: Plan view of the standard bum room, R102, and fuel load positions, and the extemal 2D
thermocouple rack for PUl to PU3. 45
Figure 3.3: Plan view of the large bum room, R102, fuel load positions and the extemal 3D
thermocouple grid for PU4. 46
Figure 3.4: Window construction. 46 Figure 3.5: Bed fuel configuration. 47 Figure 3.6: Chair fuel load. 47 Figure 3.7: Extemal 2D thermocouple rack. _^___^_ 51
Figure 3.9: Southem elevation - extemal instrumentation. 53
Figure 3.10: Plan view of bum room. 5^ Figure 3.11: Fuel distribution in the bum room for Bum 2 to Bum 8. 59
Figure 3.12: Bum room layout showing the intemal N-S thermocouple rack, bookshelf and arm chair,
for Bum 2 to Bum 8. _____^_ ^Q
Figure 3.13: Bum room layout showing window, couch and ignition source, tables, arm chairs and the
intemal N-S and E- W thermocouple racks, for Bum 2 to Bum 8. ^ ^ ^ ^0
Figure 3.14: Intemal instrumentation layout on Floor 1. 63 Figure 3.15: Dimensions of the North-South and East-West thermocouple racks in the bum room. _ 64
Figure 3.16: Instrumentation layout on the mezzanine floor. Floor IM. 64 Figure 3.17: Front view of the extemal grid and bum room window. 68
Figure 3.19: Extemal 3D thermocouple grid. 68 Figure 3.20: Locations of the extemal 68 Figure 3.21: The original HP VEEprogram which performed temperature scans. 69
Figure 3.22: The modified HP VEE program which collected voltages and cold junction temperature. 70
Figure 3.23: Combustible lining locations in Floor 1 corridor. 72 Figure 3.24: Supply (S/A) and retum (R/A) air grill locations on Floor 1. 73
Figure 4.1: PUl - Vertical temperature distribution along the extemal wall 78 Figure 4.2: PU2 - Vertical temperature distribution along the extemal wall. 78 Figure 4.3: PU3 - Vertical temperature distribution along the extemal wall. 79 Figure 4.4: PU4 - Vertical temperature distribution along the extemal wall 79
Figure 4.5: Buming Rate during PUl. 81 Figure 4.6: Buming Rate during PU2. 82 Figure 4.7: Buming Rate during PU3. 82 Figure 4.8: Buming Rate during PU4. 82 Figure 4.9: PUl - temperature contour plot from the 2D rack. 84
Figure 4.10: PU2 - temperature contour plot from the 2D rack 84 Figure 4.11: PU3 - temperature contour plot from the 2D rack. 84 Figure 4.12: PU4 - temperature contour plot of the Centre Plane, Plane 3 of the 3D grid. 85
Figure 4.13: PU4 • temperature contour plot of Face 1 of the 3D grid. 85
Figure 4.14: PU4 - temperature contour plot of Level 4 of the extemal 3D grid. 85 Figure 4.15: CEF averaged and non-dimensionalised temperature contours from Level 1 to Level 5 of
the extemal grid for PU4, viewed from inside the hum room. 86
Figure 4.16: The plume envelope as it vents from the bum room window opening.. 89 Figure 4.17: Schematic view of the soot pattem on the extemal facade during PUl. 92 Figure 4.18: PUl - Vertical distribution of the total heat flux along the external wall. 94 Figure 4.19: PU2 - Vertical distribution of the total heat flux along the external wall. 94 Figure 4.20: PU3 - Vertical distribution of the total heat flux along the extemal wall. 94 Figure 4.21: PU4 - Vertical distribution of the total heat flux at the centre and bottom centre of
W1M02. 95
Figure 4.22: PUl • Horizontal distribution of the total heat flux along the bottom ofWlM02. 96 Figure 4.23: PU2 - Horizontal distribution of the total heat flux along the bottom of W1M02. 97 Figure 4.24: PU3 - Horizontal distribution of the total heat flux along the bottom of W1M02. 97 Figure 4.25: PU4 • Horizontal distribution of the total heat flux along the bottom of W1M02. 97 Figure 4.26: PU4 - Total (hf4) and radiative (hfl 1) heat flux at the bottom centre of W1M02. 98
Figure 4.30: PU4 - Velocity at the centre of the bum room door (Dl) where y is the distance above the
floor. A positive velocity indicates flow into the bum room from the corridor. 106
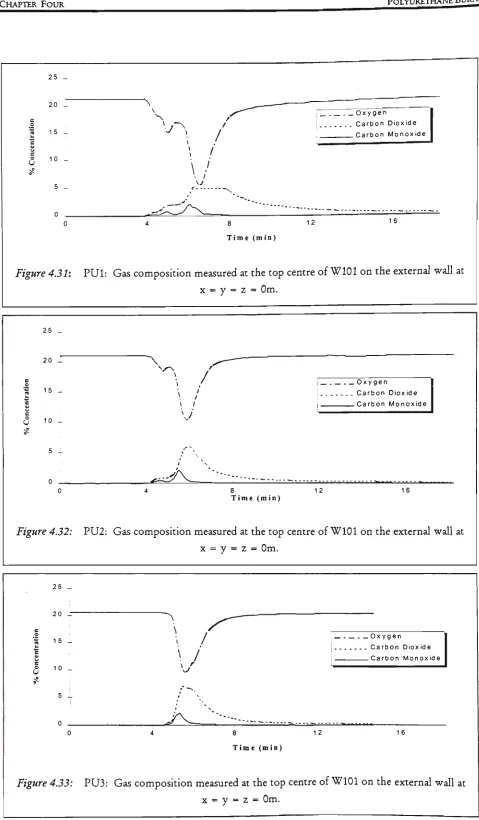
Figure 4.31: PUl: Gas composition measured at the top centre of WlOl on the extemal wall . 108
Figure 4.32: PU2: Gas composition measured at the top centre of WlOl on the extemal wall. . 108
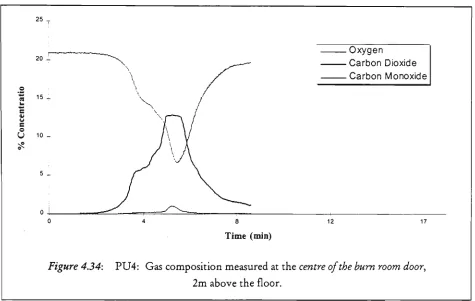
Figure 4.33: PU3: Gas composition measured at the top centre of WlOl on the extemal wall 108 Figure 4.34: PU4: Gas composition measured at the centre of the bum room door, 2m above the floor. 109
Figure 5.1: Bowing of the bum room window at approximately 3Vi minutes after ignition during Bum
7 (just prior to window failure). __^ •'••^•'•
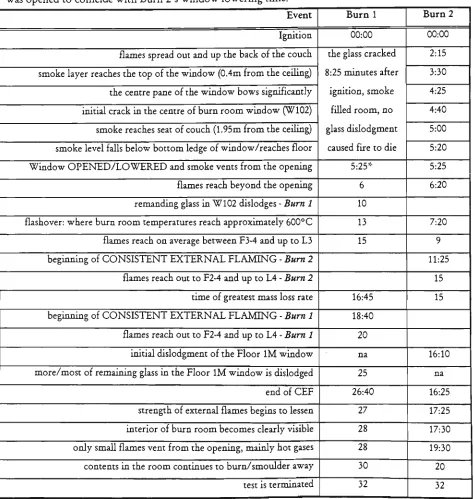
Figure 5.2: Growth at approximately SVi minutes after ignition during Bum 8. 121 Figure 5.3: Growth phase, side view, at approximately 6'A minutes after ignition during Bum 8. _ 122
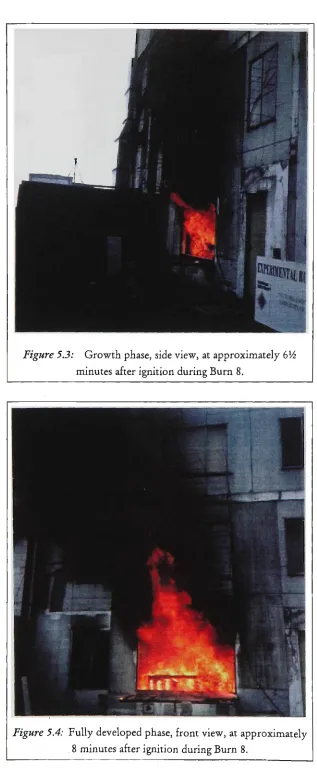
Figure 5.4: Fully developed phase, front view, at approximately 8 minutes after i^ition during Bum 8. _ 122 Figure 5.5: Fully developed phase, side view, at approximately 8 minutes after ignition during Bum 8. 123
Figure 5.6: Decay at approximately 14 minutes after ignition during Bum 8. 123 Figure 5.7; Velocity histories at the centre of the bum room door and at the indicated heights above the
bum room floor for Bum 2. 125
Figure 5.8: Velocity histories at the centre of the bum room door and at the indicated heists from the
bum room floor for Bum 5. 125
Figure 5.9: Bum 2 - CEF averaged temperature contours of Plane 3. 126 Figure 5.10: Bum 5 - CEF averaged temperature contour of Plane 3. 126 Figure 5.11: Bum 2 -19 point smoothed upper layer temperature. The dashed line marks the beginning
of flashover in the bum room. 128
Figure 5.12: Bum 2atx = 1.2m, y = Om and z = 0.5m at grid location P3/L1/F2. 128 Figure 5.14: Temperature during the CEF period for Bum 2 at x = 1.2m, y=Om and z = 0.5 m, grid
location P3/L1/F2. 129
Figure 5.15: Histogram of the temperature data given in Figure 5.14 (collected during the CEF period
ofBum2atx = 1.2m,y=0mandz = 0.5m, grid location P3/L1/F2). 129
Figure 5.16: BURN 1- Plane 3. 132 Figure 5.17: BURN 2 - Plane 3. 132 Figure 5.18: BURN 1 - Face 1. 134 Figure 5.19: BURN 2 • Face L 234 Figure 5.20: BURN 1 - Level 4. 135 Figure 5.21: BURN 2 - Level 4. 135 Figure 5.22: BURN 1 over the CEF penod from Level 1 to Level 5 of the extemal grid. 137
Figure 5.23: BURN 2 over the CEF period from Level 1 to Level 5 of the extemal grid. 137
Figure 5.27: BURN 8 - Face 1. 139 Figure 5.28: BURN 5 • Levd 4. 140 Figure 5.29: BURNS - Levd 4 140 Figure 5.30: BURN 5 over the CEF period from Level 1 to Level 5 of the extemal grid. 141
Figure 5.31: BURN 8 over the CEF period from Level 1 to Level 5 of the extemal grid. 141
Figure 5.32: BURN 4 - Plane 3. 142 Figure 5.33: BURN 7 - Plane 3. 142 Figure 5.34: BURN 4 - Face 1. 143
Figure 5.35: BURN 7 - Face 1. 143
. Figure 5.36: BURN 4 - Level 4 144
Figure 5.3 7: BURN 7 • Level 4. 144 Figure 5.38: BURN 4 over the CEF period from Level 1 to Level 5 of the extemal grid. 145
Figure 5.39: BURN 7 over the CEF period from Level 1 to Level 5 of the extemal grid. 145
Figure 5.40: Total mass loss history during Bum 1 and Bum 2. 148 Figure 5.41: Total mass loss history during Bum 5 and Bum 8. 148 Figure 5.42: Total mass loss history during Bum 3, Bum 4 and Bum 7. 148
Figure 5.43: Class la: Plane 3. 151 Figure 5.44: Class lb: Plane 3. 151 Figure 5.45: Class 2: Plane 3. 152 Figure 5.46: Class la: Face L 152 Figure 5.47: Class lb: Face 1. 153
Figure 5.48: Class 2: Face 1. 153
Figure 5.49: Class la: Levd 4. 154
Figure 5.50: Class lb: Levd 4. 154 Figure 5.51: Class 2: Levd 4. 154 Figure 5.52: Schematic side view of the plume. 161
Figure 5.53: Schematic top view of the plume. 161 Figure 5.54: Bum 4 Face 1 temperature variation across a venting plume. 161
Figure 5.55: Schematic representation of the emerging flame showing flame axis (plume centre-line),
flame height (H) and width (W), and flame (T^, opening (TJ and ambient (T^^i) temperatures. 164
Figure 5.56: Measured and calculated center-line temperature distribution for Bum 1 and Bum 2. 166 Figure 5.57: Measured and calculated center-line temperature distribution for Bum 5 and Bum 8. 166 Figure 5.58: Measured and calculated center-line temperature distribution for Bum 4 and Bum 7. 167 Figure 5.59: Measured and calculated (Equation 2.1 with total and modified Q) centre-line temperature
distributions for Bum 1 to Bum 8. 169
Figure 5.60: Data plotted using variables from Equation 2.26. 170 Figure 5.61: Trajectories of hot gas ejected from various rectangular windows. 171
Nomenclature
Ax area of enclosed surface excluding the window (m^)
Aj area of enclosed surface including the window (m^)
A^ area of burn room window/opening (m^)
b emission co-efficient (m') Cp specific heat (kj/kg K)
Ctemp co-efficient for excess temperature (°C)
Cvei co-efficient for upward velocity (m/s)
D equivalent window diameter (m)
D depth of the venting plume (m)
D^ depth of compartment/enclosure (m)
E Young's Modulus (MPa)
fex excess fuel factor
g acceleration due to gravity, 9.81 m/s^
U height of the burn r o o m window from which the plume emerges (m)
h height of the burn room window/opening (m) H height of the venting plume (m)
I radiant heat flux density (kW)
k constant (kWm^K[m^/kg/s]' j used in Equation 2.21
/ distance along flame axis X (m)
/f flame length (m)
L total mass of the fire load (kg) m mass inflow rate of air (kg/s)
n parameter (W/^/4[H)
Q heat release rate (kW)
Qrec dimensionless heat release rate r stoichiometric ratio
R rate of burning (kg/min or kg/s)
T temperature (°C or K)
TQ w i n d o w / o p e n i n g temperature (°C or K)
Tf flame temperature (°C or K)
ATn, centre-line temperature rise above ambient (°C)
TpDF average temperature during the fully developed phase (°C or K)
T^^ wall temperature (°C o r K)
Tnijx maximum temperature (°C or K)
Tjmb ambient temperature (°C or K)
u wind speed producing through-draft (m/s)
u* velocity based on heat release rate (m/s)
Um centre-line velocity (m/s) V upward velocity (m/s)
Vwind wind velocity (m/s)
w width of the burn room window/opening (m) W width of the venting plume (m)
z height above w i n d o w / o p e n i n g (m)
Z height above virtual source (m)
a c o n v e a i v e heat transfer co-efficient (kW/m^K)
P co-efficient of linear expansion (K'^)
e flame emissivity
r[ parameter (Ax/A^Vh)
9 plume tilt angle (°)
K constant (kgm'^^^s"^)
X flame thickness (m)
61 t o 05 multiplication factors (see Appendix E)
PJJJII, ambient density (kg/m )
a Stefan-Bokzmann constant, 5.6699 x 10'* Wm'^K"*
Gb breaking stress (MPa)
Tp free burning duration (min)
Y wind correctional factor used in Equation 2.26
0 dimensionless temperature
N North
S South E East
W West
CEF consistent external flaming
hf heat flux
AHc heat of combustion
HRR heat release rate NA neutral axis
PU polyurethane
WLC window lowering criterion, WLC #1 or WLC #2
Plane vertical section of the 3D external thermocouple grid perpendicular to the external wall
Face section of the 3D external thermocouple grid parallel to the external wall
Level horizontal seaion of the 3D extemal thermocouple grid and perpendicular to the extemal wall
Class 1 through-draft ventilation condition (burn room door and window are open)
CHAPTER ONE INTRODUCTION
1. INTRODUCTION
Legend has it that (Prometheus stoCe tfu tqiotvCcdge of fire, craft and sacrifice from the gods and gave it to the human race in an attempt to
save them from the tvrath of Zeus. J^ punishment for his betray aC, Zeus chainedTrometheus to a rrtountain peal(^andplagued humankind toith Tandora and her bo7(_ofevit. T/ie human rau Cost
its innocence and Barbarism but gained knowitdge at the tTqienst of its mvrtaCitij.
Such sacrifice seems umuorthy of such a gift, however Trometheus believed that zuithout the knotvCedge of fire, the human race could not
have progr&ssedl 1].
Until recently, research on fire characteristics has concentrated on the 'room of fire origin'. The amount of data collected in this area of fire research is significant[2,3]. The effects of fire and smoke spread beyond the room of fire origin (burn room), on the other hand, have not been investigated to the same extent. In this respect, one interesting characteristic of fire is the way it spreads out of openings, such as windows of buildings. The appearance of flames through windows in buildings is caused by the venting of unburnt gases from the burn room and their continued combustion beyond the opening where a reservoir of fresh air exists[4]. External flaming is characteristic of fires that have undergone a transition to flashover[5] and entered a ventilation controlled state.
CHAPTER O N E iNTROPUcTioji
The need to have a detailed analysis of the venting plume stems from the recent emergence of performance based fire codes[9,10]. In the past, most fire safety design systems and specifications were based on empirical relationships[ll]. The use of CFD (computational fluid dynamics) and Zonal Models[12] has become an alternative means to predict the effects of a fire, both inside and beyond the room of fire origin. However, before such numerical models can be used in conjunction with performance based codes and risk assessment models[13], their predictions need to be validated against results taken during full-scale experiments[14]. Hence, while it is possible to use some small scale fire tests for full-scale fire prediction[15,16], the use of full-scale experiments eliminates the difficulties associated with such small scale correlations[17, 18]. Hence, well planned full-scale tests are still needed in developing better designs to minimise fire loss. These tests need to be representative of realistic living and working environments and more importantly they must be repeatable.
1.1 THE DEVELOPMENT OF TWO SERIES OF TESTS
As part of this study, two comprehensive series of full-scale flashover fires were conducted to investigate the effect of external flames venting from openings in a building during the flashover/fuUy developed phase of a fire. The two series were,
Polyurethane Burns^ and Real Furniture Burns^ . The primary intention of these
experiments was to determine the effects of ventilation conditions on the venting pliune and the Ukelihood of secondary fires. Although external combustible cladding can also contribute to the likelihood of secondary fires[19,20], this topic is beyond the scope of the thesis. In total, four Polyurethane and eight Real Furniture tests were performed.
In the first series of Polyurethane (PU) Burns, three of the four tests were carried out in a standard sized hum room, whUe the last test was performed in a large bum room, similar to a residential living room. The Polyurethane Burns should be viewed as a preliminary set of experiments, developed as a precursor to the second series of tests.
The Polyurethane Burns were conduaed through a CESARE contraa with the National Research Council of Canada (NRCC).
CHAPTER ONE INTRODUCTION
the Real Furniture Burns. These preliminary tests helped in developing an understanding of the nature of externally venting flames during flashover fires. The second series of Real Furniture Burns was designed on the basis of the understanding of the venting plume developed during the Polyurethane Burns. The Real Furniture Burns were conducted with commercially available furniture in the larger size (Uving) room where the fourth polyurethane test took place. All tests were grouped according to specific ventilation conditions that existed within the building.
1.1.1 Ventilation Conditions
The ventilation concUtions during both series of tests can be grouped into two classes, each having a distinct effect on the way the plume vents from the window opening[21]. A through-draft-condition implies that air may flow through a room, such as from an open door to an open window. This ventilation condition is referred to as Class 1 in this thesis. A Class 2, no-through-draft-condition, implies that there is no such flow of air through the room, such as when the door is closed. In a Class 1 test, air in the burn room is supplemented with air from adjacent rooms or a corridor. This allows the flames to vent from the entire window opening. Class 1 tests have been further grouped into Class la and Class lb tests, according to the internal ventilation conditions within the building. In a Class 2 test, the combined effect of a closed door and a closed window may suffocate the fire if the window does not fail. However, if the window fails, the supply of air from outside will help sustain the fire, causing the flames to vent from the upper half to two-thirds of the opening, while air is drawn in from the lower half to third. In both these classes, if a sufficient amount of fuel and air is available, the fire can grow to a fully developed condition, where all the combustible material in the room becomes involved. For both series of tests, Table 1.1 lists the ventilation conditions which existed for each test.
Table 1.1: Class distinttions for the Polyurethane and Real Furniture Burns.
CHAPTER O N E INTRODUCTION
1.1.2 Test Methodology
During the first three PU tests, the temperature field in a 2D cross section of the plume was mapped, above the top centre of the burn room window, perpendicular to the external wall. This region of space was chosen for the preliminary investigation, as the majority of work in this field[8,20,22] had focused on this region. The mapped area covered a 2.78m high and 1.5m deep section of the plume, which included its centre-Une, with 20 temperature sample locations. Total and radiant heat flux, velocity and gas composition measurements were also taken during each of the tests.
After the completion of the PU tests, several influential factors regarding fire development and test structure became apparent. These factors, Usted below, had to be considered when designing the second series of tests:
1. randomness of glass breakage,
2. natural wind movement on the venting plume,
3. seemmgly subtle differences in internal ventilation conditions, 4. temperature variation across the height, depth and width of the
plume,
5. likelihood of a secondary fire,
6. repeatability of external and internal experimental results.
CHAPTER ONE INTRODUCTION
The fourth measure was that given the variations in temperature with height and depth observed in a two-cUmensional section of the venting plume, it was necessary to investigate the temperature variations across the width of the venting plume as well as along the height and depth. This was achieved by constructing a three-dimensional external thermocouple grid, instead of the two-dimensional rack used earlier. The three-dimensional grid was positioned on the external wall, above the window opening of the burn room. The new grid extended over a region expected to be covered by the venting plume (2.4m wide, 3.9m high and L5m deep), and it had a total of 140 temperature sample locations. Although this arrangement complicated the data acquisition and subsequent analysis, it helped clarify the physics of externally venting flames.
The occurrence of severe cracking and dislodgment of the glass in the window on the level above the burn room during one of the PU tests, was an indication of the overall severity of the fire and its potential to initiate a secondary fire, either through direct flame contact or radiative heat transfer. As a fifth objective, this point needed to be studied further. Finally, the need for repeat tests stemmed from the uniqueness of each of the PU tests during which invaluable insight was gathered, but some of the information was inconclusive. Consequently, the second series of tests was designed to have at least two repeat tests in each ventilation class for comparison. The Real Furniture Burns, BURN 1 to BURN 8, incorporated all of the above mentioned modifications.
CHAPTIER ONE INTRODUCTION
1.2 CONSISTENT EXTERNAL FLAMING (CEF)
The flow of hot gases and smoke in the burn room is mainly buoyancy driven and turbulent. The temperature field is controlled by natural convection, forced convection (for a through-draft ventilation condition) and radiation, in addition to being coupled with the velocity field. The externally venting plume is also driven by buoyancy, and air entrainment exists along its free boundaries. Both internally and externally, the velocity and temperature fields are turbulent. Turbulence alters the moment to moment development of a fire, but the stages of a fire's progress remains the same. The fire begins at ignition, moves through flashover to the fully developed phase, and then eventually decays as the fuel source is consumed. Consequently, the comparison of instantaneous results for similar locations both within the burn room and outside is inappropriate due to the random nature of turbulence. An averaging method has been developed here based on the time averaging of experimental data over the Consistent External Flaming period, described next. Subsequently, the external temperature data were non-dimensionalised using the ambient and maximum external temperatures during the CEF period, to consolidate the data according to the stage of fire development. The same averaging and non-dimensionalisation were applied to each test to allow the data to be interpreted.
Consistent External Flaming (CEF) refers to the portion of the fully developed fire when externally, strong consistent flames exist. In determining this time period, several factors were considered. These factors are,
• burn room temperatures • mass loss data
• temperature just outside the opening • visual observations
CHAPTER O N E INTRODUCTION
1.3 THESIS STRUCTURE
In the following, the background information on flashover fires and externally venting flames is summarised in Chapter 2. Chapter 3 contains the details of the experimental arrangements used for both series of tests. Chapters 4 and 5, respectively, contain the experimental results* from the Polyurethane Burns and Real Furniture Burns. Chapter 6 contains the numerically predicted results of the external temperature field using
CESARE-CFD and comparison with experimental data. The conclusions of this thesis
are listed in Chapter 7.
Appendix A contains information to estimate the necessary spandrel height to prevent fire spread through an upper level window. The building plans of the Experimental Fire Building Facility where the experiments were conducted, are included in Appendix B. A detailed fuel load breakdown of the first test (Burn 1) of the second series of Real Furniture Burns is given in Appendix C. The eight main MATLAB computer programs developed in this thesis for data analysis are Usted in Appendix D. The details of a compartment temperature calculation are given in Appendix E. Appendix F contains the temperature contours of each Face of the venting plume for the second series of tests. Appendix G contains sample input and output data files from CESARE-CFD for the numerical predictions presented in Chapter 6.
For easier reference to internal instrumentation, burn room configuration, external instrumentation consisting of both thermocouple and heat flux transducer locations, fuel load, environmental conditions and ventilation conditions, two foldouts are located after the Appendices. Foldout 1 and Foldout 2 contain the above information for the Polyurethane Burns and Real Furniture Burns, respectively.
CHAPTER Two ^ BACKGROUND,
2. BACKGROUND
As discussed in the Introduction, the fully developed fire is of interest here, since the maximum amount of externaUy venting flames and combustion products exists during this phase of the fire[6]. This stage of the fire also poses a significant risk, in terms of exterior structural damage[25] and fire spread to the external facade of the building and to adjacent structures[8]. As such, an imderstancUng of the ability of a fire to achieve flashover[26,27] and the progress from a flaming fire to a fully developed fire is necessary with respect to extemal flames.
Factors affecting a fire are primarily the fuel source (type, load and distribution), ventilation conditions, such as the size of openings, and rate of burning. These in turn influence the likelihood of external flames. Once the fire extends beyond the compartment, window geometry and the presence of other openings, affect the shape of the external plume and whether or not re-attachment to the facade occurs[28 and 49, pp. 189-194], while the environmental conditions influence both swirling of the plume and air entrainment into it. The external plume can be considered in terms of flame shape (height, width and depth), temperature and velocity distribution[28] within the pltune and heat flux received by external[29] or adjacent[8] walls, where all of the above mentioned factors play an important role.
CHAPTER Two BACKGROUND
2.1 COMPARTMENT FIRES
The binh of the fire occurs at ignition, and if conditions are favourable, the temperature in the compartment wiU continue to rise. Depending on the first item ignited and ventilation conditions, the fire may either continue to grow, spreading to other items, or it may die out, and as such, the transition into a fully developed fire may not occur. However, if the fire continues to grow, the transition from a localised fire to complete room involvement occurs. Figure 2.1 illustrates the stages of the fire's development within a compartment from ignition to decay[31,p. 278]: ignition, growth, flashover, fully-developed and decay.
Although the presence of external flames is directly related to the conditions within the compartment, including entrainment, ventilation conditions and heat transfer effects, these factors are not generally discussed with respect to their effect on externally venting flames. The limited number of works discussed in Section 2.4 and
Section 2.5 relate the compartment conditions to the external plume.
Time
Figure 2.1: Stages of a fire's development in an enclosure.
CHAPTER Two BACKGROI;NP.
spread to adjoining spaces. Overall, the areas where further experimental and computational work is required are indicated. Quintiere points out that many individual aspects pertaining to compartment fires have been examined and effectively modeUed. These aspects include plume development and entrainment, describing vent flows and given sufficient data, computing ignition of primary and secondary items. However, certain areas stUl need to be addressed, one of which is the modelling of fire spread outside windows.
2.1.1 The Pre-flashover Compartment
Ignition of an item is associated with the onset of combustion, a rapid exothermic reaction, manifesting as flames and an increase in temperature[32]. After ignition, the flame wiU spread along the combustible surface of the fuel source. Surface flame spread is described as the 'phenomenon of a moving flame in close proximity to its source
offuell33], a solid or liquid, unlike a pre-mixed flame which spreads though an air-fuel
mixture. Flame propagation across the fuel surface is sustained by the transfer of heat to the surface which causes the pyrolysis of the region directly before the flame front. The interdependence of heat transfer and continuous gasification of fuel is the primary interaction which defines surface flame spread. Williams[34] and Thomas[35] have provided extensive reviews of flame spread and its dependence on pressure, temperature, oxygen concentration, fuel type, geometry and orientation, as well as flame spread over continuous or discrete surfaces, effects of ventilation and upward spread. Their works have focused on spread along fuel sources and can be applied to the spread of flames along vertical combustible surfaces, such as external cladding. This aspect of flame spread is not within the scope of this thesis.
CHAPTER TWO BACKGROUND
2.1.2 Flashover/Fully Developed Fires
Several theoretical approaches have been developed to predict if and when a fire would achieve flashover. Graham et al. based their work on heat balance considerations within the hot upper layer of a two-zone model and classical thermal explosion theory[26]. Babrauskas' method[37] calculates the heat release rate necessary to cause flashover, as a fraction of the stoichiometric heat release rate, using ventilation factors and a modified radiative heat transfer equation. The McCaffrey, Quintiere and Harkleroad method[37] and the Thomas method [37], also use a combination of these, placing different emphasis on the effect of ventilation with respect to the room. McCaffrey et al. correlate experimental data to obtain energy release rates required for flashover, while Thomas focuses on the minimum rate of energy release necessary for flashover using an energy balance of the upper layer.
While a theoretical means exists to predict whether or not flashover will occur, an expHcit definition has not yet been agreed upon. It is understood that flashover is 'the rapid transition
to a state of total surface involvement in afire of combustible materials within an enclosure 138]. Contained
within this description are several mechanisms which have been associated with the transition into a fuUy developed fire. These are[5]:
• an increase in the buming rate
• the spread of flames over all exposed surfaces • burning of the hot smoke/gas layer under the ceiling
Each of these mechanisms can be associated with either quantifiable or physical manifestations. These are[5]:
• when gas temperatures under the ceiling in the room of fire origin reach between 500°C to 600°C
• when a radiation heat flux of 20kW/m^ at floor level is measured ~ Waterman's Criterion
CHAPTIER Two RACKGROU^JP.
Each of the above points has been linked to the onset of flashover and has been used as an indicator of the transition into a fully developed fire. However, given that a precise definition of flashover has yet to be decided upon, it has become accepted practice to associate compartment temperatures in the upper layer of 500 to 600°C with the onset of flashover[27]. Waterman's Criterion[39] refers to the ignition of strips of paper at floor level, which was based on earlier work associated with the rapid pyrolysis or 'flameover' of cellulosic floor coverings[35, p.317], and has been found to be conservative[5]. Finally, the appearance of flames from available openings was originally specified as Hugglund's Criterion[31, p.284] and a definition of flashover. However, as indicated by Walton[37], the appearance of flames may not correspond to flashover. Akhough external flaming may not be 'flashover', it has been observed in this study that the appearance of external flames can provide a clear and convenient indication of the fire's having progressed to the fully developed stage.
In general, the fully developed stage is usually ventilation controlled as the amount of pyrolised fuel produced exceeds the oxygen available in the enclosure. Flashover produces concUtions favourable for external flaming, such as through cracking and faUure of windows. Windows can be said to act as 'barriers'[40] to prevent or delay the passage of flames during the initial stages of the fire and may delay the onset of flashover. However, they also have the potential to become vents, and in doing so, supply the fire with air. Openings such as doors to adjacent rooms and enclosures provide a means for the hot gases to move around the building[41]. The spread of fire can be caused by the spontaneous ignition of a surface or fuel due to exposure of radiative heat from hot smoke and combustion gases which have accumulated under the ceiling in adjacent enclosures, or through direct flame spread. Following the fully developed phase, as the remaining fuel is consumed, the fire begins to die.
CHAPTER Two BACKGROUND
2.2 FIRE SPREAD BEYOND THE ROOM OF FIRE ORIGIN
During the fully developed phase, spread of the fire beyond the room of fire origin becomes possible, either to adjacent enclosures within the buUding or externally through window openings[42].
Mechanisms of fire spread within the building can occur either:
• by surface or direct flame spread along carpets or other floor, wall, or ceiling linings, or
• by the build-up of a hot layer in an adjacent enclosure, which increases the temperature and causes the ignition of its contents.
While external spread of the fire can occur either:
• by leap frogging of flames which emerge from a lower level opening and ignite combustible material on the inside of the level above by radiative heat transfer or by direct flame contact if the window is opened or has failed,
• by the spread to adjacent builcUngs, or.
• by the ignition of combustible exterior walls.
The risk of room to room spread and ceiling/floor spread can be minimised by the implementation of proper design codes and the use of fire doors. The spread and accumulation of hot gases in adjacent enclosures or to higher levels via stairwells, can also be reduced by controlled venting systems\A7)]. A controlled venting system implies active removal of hot gases and smoke, through the use of an air handling system in a modified mode of operation, as opposed to the escape of gases and smoke through vents due to natural pressure and temperature differentials.
CHAPTER Two BACKGRQUNP.
CHAPTER TWO BACKGROUND
2.3
FIREPLUMES
Buoyant flow consisting of heated gas, smoke and flames, which rise from a burning item into a region of essentiaUy uncontaminated air is referred to as a fire plume[48]. Inside an enclosure, a plume is said to exist through aU the early stages of a fire's development, until just before flashover. Conventional analysis considers the plume to be axisymmetric and surrounded by uncontaminated air of uniform temperature as shown in Figure 2.2, where
k is the mean flame length, ATo is the mean excess temperature and Uo is the mean
velocity.
Entrained Row
Flame
'Flow Profile
ATo &U„
Figure 2.2: Features of a fiie plume.
Generally, plume temperatures are the highest within the combustion region. The temperature decreases with increased height and air entrainment into the plume, which cools the flow. Velocities within the plume peak in the intermittent region of the flame, sUghtiy below the mean flame length, and drop-off with increased distance above the burning item. The total heat release comprises of convective flux which is carried away by the plume and radiative flux which radiates away from the combustion region.
CHAPTER Two
BACKGROUND.
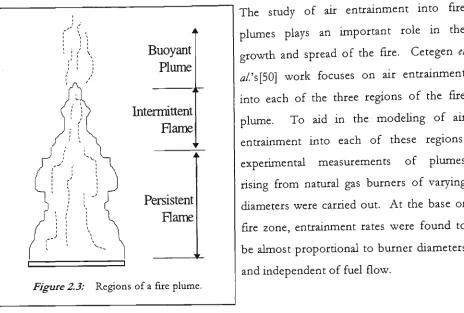
combustion continuaUy produces heat addition due to chemical reactions, accelerating the flow of burning gases. The intermittent region is an unsteady region at the top of the flame where flaming combustion is intermittent and flow velocity is ahnost constant. In the buoyant or far-field region, temperature and velocities decrease with increased height due to lack of chemical reactions.
Buoyant
Plume
Interirnttent
Flame
Persistent
Flame
Figure 2.3: Regions of a fire plume.
The smdy of air entrainment into fire plumes plays an hnportant role in the growth and spread of the fire. Cetegen et fl/.'s[50] work focuses on air entrainment into each of the three regions of the fire plume. To aid in the modeUng of ah: entrainment into each of these regions, experimental measurements of plumes rising from natural gas burners of varying diameters were carried out. At the base or fire zone, entrainment rates were found to be almost proportional to burner diameters and independent of fuel flow.
In the intermediate region, entrainment rates were similar to that of a turbulent plume, where plume mass flux was dependent on heat release rate and height above the fire source. In the far-field or buoyant region, a point source plume model was used to predict entrainment rates. The work by Quintiere et ^/.[51] looked at the effect of room openings, such as door and windows on entrainment rates in fire plumes, and they found that such flow through the room tilted the fire plume, similar to external wind effects. Also, increased flow through the room was Unked to both the strength of the plume and the size and location of the opening, with corresponding increases in entrainment rates.
CHAPTER Two BACKGROUND
WhUe the study of fire plumes within an enclosure was been carried out in detaU, the study of the fire plume beyond the room of fire origin has received Uttle attention. Thomas[53] briefly mentions the flow of flames out of openings, using the fundamental work of Yokoi[28] who identified mean flame length with an isotherm rather than using a virtual source, given the difficulties in defining an origin for external plumes. Yokoi's work is discussed in detail in Section 2.4. However, whUe the study of external fire plumes during real fires had been Hmited, some understanding of this phenomenon has been possible through the study of vent flows[54]. Figure 2.4 shows the buoyant flow out of the room of fire origin as a result of the heating of gases in the room. When the hot-layer is deep enough to fall below a vent opening, such as the top of a window or door, some gas wUl flow out. As the fire continues to grow, the buoyant flow wUl surpass gas expansion in the room resulting in the pressure dropping below atmospheric at the floor level in the room. When this occurs, air is drawn in from the lower portion of the vent/opening whUe flames and gases flow out from the top. This buoyant flow into the burn room provides the oxygen necessary for the continued combustion of the fire. Velocity and mass flow rates of the buoyant flow through the vent are determined using temperature (density) variations across the opening.
"I I
I r
I I
/ ; ? : ^
/
Room of fire origin \^
/ Pa
K
JL
Figure 2.4: Buoyant flow out of a window opening during a room fire.
CHAPTER TWO BACKGROUND.
2 . 4 EARLYEXPERIMEOTALSIUDIESONEX^:ERNAIlYVE^mNGRUME^
Fundamental work on plumes was carried out by Yokoi[28] in the 1960's to assess the risks associated with fire spread from window openings in buddings. Yokoi performed both small scale and full scale experimental testing during his investigation of hot upward currents and venting plumes. His investigations began with a series of simple tests using alcohol as a fuel source, and preliminary investigations into temperature and velocity distributions within upward currents generated from a point and hne source were carried out. These tests were foUowed by investigations into velocity distribution in air jets flowing from circular and rectangular orifices. The analysis lent itself to the flow of hot-currents ejecting from circular and rectangular heat sources. The intention was to understand hot-currents, such as flames, venting through window openings. Yokoi then described a burning wooden house as a rectangular heat source and derived the vertical temperature distribution above this heat source. He identified the sensitivity of the temperature and velocity distributions to a ratio of the window's width (w) to half of the height from which the plume emerges from the opening (h) in
terms of a parameter n. In a table, Yokoi[28, p.87] provided a means to determine the height, h, as a function of the compartment temperature during the maximum intensity phase of the fire and the neutral axis (NA) of the window (above the NA, flames emerge from the window, and below it, air is drawn in). The parameter, n, defined as n = w/(V2h), was used also to determine whether or not re-attachment of the plume would occur. He noticed that both the presence of a waU above a window opening, as weU as the shape of the window, affected the path of the ejecting plume. When a waU exists above wide openings, it absorbs heat from the flames as weU as restricting air entrainment on the wall side. This restriction causes the plumes to be longer and makes the plume travel along the waU (re-attachment). Narrower windows eject the plume away from the waU, allowing entrainment from all sides, shortening the plume.
CHAPTER Two BACKGROUND
and 3m x Im, respectively; the fuel source was wood with fuel load densities of 42kg/m2, 53kg/m2 and 40kg/m2, respectively. All tests were carried out on calm days when the wind speed was 1.5m/s or less. During these tests temperature of the burn room and temperature and velocity of the ejected flames were measured. Once again, the importance of window geometry was observed. He noted that the standard glass windows of 3mm thickness, mostly cracked when subjected to hot gases at 400°C with dislodgment at 500°C, while wired-glass windows did not crack even when gas temperatures reached 600°C.
Following the full scale work, Yokoi performed a series of small scale (model) experiments with the intention of applying his full-scale formulations to the results of the small scale tests. Once again, alcohol was used as a fuel source, and windows of various sizes were used. The effect of window geometry, and the presence of a wall above the opening were investigated, and good correlations were found to exist between the full scale and model test results over the period of maximum intensity. To correlate experimental results obtained with small scale tests to fuU scale conditions, consideration was given to the differences of the thermal properties of the wall above the window, the emissivity of the flames, and the continued combustion of gases when ventilation conditions were restricted.
Once the trajectory path (line marking the hottest temperatures) of the plume was verified, it could be used to determine the effectiveness of spandrel walls and balconies. By setting the critical temperature at which standard glass fails at 500°C, Yokoi developed a means to estimate the spandrel length necessary between window openings to prevent the ignition of an upper level by flames emerging from lower levels. Balconies deflected the trajectory path, and as a result, were found to be highly effective in preventing the spread of the fire.
CHAPTER Two BACKGROUND,
Trajectory along plume axis:
Temperature and Velocity:
AT = 24.6 Q^^^ Z'^^^ Equation 2.1
Unj = 1.17 Q^'^^ Z"^^^ Equation 2.2
where AT^ = centre-Une temperature rise above ambient (Tamb ~ 293 K) Um = centre-line velocity (m/s)
Q = heat release rate (kW)
Z = height above the virtual source (m)
Equation 2.1 and Equarion 2.2 are based on Beyler's[52] calculations using Yokoi's data. Only Equation 2.1 can be compared with the present experimental resuks, as given in Section 5.6.3, because plume velocity measurements are not available.
Re-attachment parameter n:
n = w/(Vih) Equation 2.3
where w = the width of the window (m)
U = the height of the window from which the plume emerges (m)
n < 3.4 plume will rise close the wail, but it wiU not re-attach. The closer this number gets to 1, the further away from the wall the plume will tend,
n > 6 plume will strongly deflect towards the wall.
Spandrel length necessary to prevent a secondary fire:
CHAPTER Two BACKGROUND
Horizontal Projections (balconies):
The necessary length of horizontal projections can be determined once again based on vrindow size and quantity of combustibles (kg/m^) in the room. For example, the information presented[28] in Table 10.5 (p. 135) is for when a 50cm deep balcony is attached above the window. For this case, the plume is deflected away from the waU, and the impact (temperature) on the waU is lessened. Also, the effect of multiple balconies and the corresponding spandrel lengths can be determined from Table 10.5. This table is not duphcated here, since no direct comparison was possible with the present results.
SimUar to Yokoi's investigation into air ejected through circular and rectangular orifices, Seigel[4] considered the plume as a horizontal jet, to predict the size of flames during building fires. This was done with the intention of assessing the use of external structural steel elements without fire protection. Thirty experiments were carried out in a 3.05m x 3.66m x 3.05m high chamber with wood crib fuel load density ranging from 24.4 - 97.7 kg/m^ (5-201bs/ft^), with a single window opening of sizes 0.61m wide x 1.83m high or 1.83m wide x 2.44m high. For tests with multiple (two) window openings spaced 1.22m apart, horizontaUy, flames emerging from the 0.61m x 1.83m windows tended to merge together during the peak burning phase of the fire. Temperature measurements were made in the test room and in the external flames using thermocouple grids. Seigel noted that the rate of temperature drop away from the opening was smaU and attributed this to continued combustion outside the opening. Consequentiy, additional ventilation was provided, other than the opening, by connecting an external air supply to the test room. This aUowed the fire to burn freely in a weU ventilated room, therefore increasing the rate of burning and the length of the flames. Seigel's correlation for flame length can be used when fuel load and burning rates are known. This correlation for flame length assumes a flame tip temperature of 538°C (1000°F). This value was selected as flame temperatures below this value wiU not pose a significant risk to exposed steel structures.
CHAPTER Two BACKGRQUNP,
important points were highlighted. These included the effect of window geometry on flame trajectory, definition of visible flame length at 540°C, the need to consider radiation losses, the effect of 'no waU' and 'wall' above the window opening, and the effect of supplying air to the room which enhances the burning rate. Correlations were developed which allowed the height of the flame tip above an opening to be determined. Due to the sensitivity of flame temperature measurements to radiation, this work indicated that radiative heat transfer from flames should be measured directly, rather than estimating from thermocouple measurements.
Adding to the work of Thomas and Law[55], Law[21] produced a comprehensive guide to assess the fire safety of external building elements. Incorporated into the Design Guide[21] were additional full-scale experimental resuks on fires using timber, wood crib and office furniture as the fuel source, where the room size and openings were varied. Correlations for free and restricted burning rates, the cUmensions (height, depth and width) of the external flame, based on through-draft and no-through draft conditions, as well as whether or not there is a wall above the opening are presented. In addition, temperature along the flame axis and a model of the heat transfer from the flames to the external steel structure are given. This publication was followed by a manual by Law and O'Brien[30], which simplified the information presented previously by Law[21]. Law's procedure is presented in Section 2.4.1.