International Journal of Research (IJR)
e-ISSN: 2348-6848, p- ISSN: 2348-795X Volume 2, Issue 05, May 2015Available at http://internationaljournalofresearch.org
Scheduled castes in unorganized sector: A case study of
agricultural workers in Ranbir Singh Pura Tehsil of
Jammu District
Sukhvinder Paul & VirenderKoundal
Research Scholar, Department of Economics, University of Jammu. Assistant Professor, Department of Economics, University of Jammu.
Abstract: -
Scheduled castes are those castes/races which have been or may in future be specified in a list in accordance with Article 341 of our constitution. The people of these castes are considered outcastes and categorized as untouchables. The term ‘unorganized’ is often used in the Indian context to refer to the vast number of men and women engaged in different forms of employment. It is well known that around 420 million workers, comprising of 92% (as of 2004-2005) of the total workforce in the country are unorganized or informal. Agricultural workers come under the unorganized sector. So, this is a study which aims at investigating the socio-economic background of Scheduled castes workers working in the unorganized sectors especially in Agriculture field. For this 100 households have been selected 25 each from four villages. And we have found that most of them are landless or have less land, low sex ratio, long working hours, worst working conditions, low income and per capita income with few earners in the family. Therefore, there is an urgent need to reorient and supports theses poor people by providing suitable measures.
Keywords:
Scheduled Castes; Unorganized Sector; Agricultural workers
INTRODUCTION
:
ScheduledCastes are those Castes/races which have been or may in future be specified in a list in accordance with Article 341 of Indian constitution. The people of
these Castes are considered outcastes and categorized as untouchables. They remain at the bottom of social hierarchy and have been socially deprived, discriminated and exploited by the upper caste people since time immemorial (Singh, 2009).The Simon Commission in 1935 first coined the term ‘Scheduled Castes’. All the untouchable Castes, which were listed in 1931-Census of India, came to be known as the ‘Scheduled Castes’ (SCs) through theGovernment of India Act of 1935.There are different sub-Castes among Scheduled sub-Castes people in India. In the state of Jammu and Kashmir there are 13 sub-CastesamongScheduled Castes. These 13 sub-Castes are as under:-1. Barwala, 2.Basith, 3.Batwal, 4.Chmar or Ramadasia, 5.Chura, Bhangi, Balmiki, Mehtar, 6.Dhyar, 7.Doom or Mahasha, 8.Gardi, 9.Jolaha, 10.Megh or kabirpanthi, 11.Ratal, 12.Saryara and 13.Watal
(www.socialjustice.nic.in).
International Journal of Research (IJR)
e-ISSN: 2348-6848, p- ISSN: 2348-795X Volume 2, Issue 05, May 2015Available at http://internationaljournalofresearch.org
So, Agricultural workers come under the unorganized sector. It is widely known to everybody that the agricultural workers are the most neglected classes in the Indian masses. They get unusually low wages for the work done under the worst conditions put in excessively burdens on hard work. The opportunity to work is extremely irregular; hence their income is also low. Since, they possess no skill or training, they have no alternative employment opportunities either. Hence, they are an oppressed class(Chandy, 2006).Agricultural labourers basically are landless and form a significant section of the Indian rural society. The majority of them belong to Scheduled Castes and Scheduled Tribes which are the worst exploited section of the Indian society (Singh and Sadhu, 1986).Around 73 per cent of the population of the Jammu and Kashmir state reside in rural areas and is directly and indirectly earn their livelihood and employability from the agricultural activities (Jammu and Kashmir Economic Survey, 2012-13).
RESEARCH METHODOLOGY:
This research is based on the data collected from the sample size of 100 households, 25 each from the four villages i.e.Gagian, Rangpur, Chohalla and Drawtey. The selection of the location was done by stratified samplinggroups which we divided into four levels, i.e. District, Tehsil, Village and Scheduled Castesfamilies.Interview schedule was used as the main tool for data collection. After collecting data from the study area, the questionnaires were rechecked and later on tabulated and classified into different categories. A simple statistical tool was used such as percentage method. Analysis of data has done on the basis of interview conducted by researcher observation. The data analysis was done in such a way that possible errors during data editing would be excluded. Finally the interpretation, proper analysis and verification of the data were done and conclusions were drawn accordingly.
RESULTS AND DISSCUSSION:
Demographic Profile of The Study Area:
Demographic analysis estimates are often considered a reliable standard for judging the accuracy of the census information gathered at any time (Mc Falls, Joe,2007).The present study depicts that the total Scheduled Castes population in the four villages of the study area is 492 out of which 265(53.9 per cent) are the males and 227(46.1per cent) are the females constitutes the sex ratio of 856.On the other hand, sex ratio of Scheduled Castes in India is 945 and in J&K it is 861 and the sex ratio for the general population in India is 940 and in J&K it is 889 according to census 2011. So, it is alarming sign not only for the study area, but also for the whole J&K state. This shows that the Scheduled Castes people in the study area do not want a girl child at their home; they think that the female child is the burden for them. There is still a stigma in many homes to have a girl child. So, naturally people have and still resort to horrifying measure to steer of this disgrace. So, the male child is being preferred over female because they recommend them as earning hand.
Dependency Ratio:The dependency ratio in the study area is 39.77 per cent which is low when we compare it with India, the dependency ratio in India in 2011 is 54.34 per cent. You can say it is moderate, but it is little bit low. There are various reasons for this lower dependency ratio like awareness of family planning system and lack of financial resource to support their large families. Out of the total population 71.54 per cent between the age group 15-59 year, 23.57 per cent of the population are under the age group of 0-14 year and only 4.87 per cent are above 60 years year due to lack of health facilities and poor standard of living.
International Journal of Research (IJR)
e-ISSN: 2348-6848, p- ISSN: 2348-795X Volume 2, Issue 05, May 2015Available at http://internationaljournalofresearch.org
study reflects that 73 per cent of the population in the study area have semi-pucca houses, 19 per cent have semi-pucca Houses and remaining 8 per cent have kutcha houses which is showing the their poor standard of living.
Landholding by the
Households:Landholding plays an
important role in overall agricultural production, which in turn affects both social and economic lives of those people who indulged in agricultural activities to earn their livelihood. The study reveals that the total irrigated land possess by the Scheduled Castes households in the study area is 36.25 acres (290 kanals). The percentage of land holding, among all the households is not equal, as 51 out of 100 households in the study area are landless. In comparison, 21 households each fall under the category of 1-4 kanals and 4-8 kanals of land possessions, 5 households fall in the category of 8-12 kanals and only 2 households comes under the category of 12-16 kanals. So,only 49 cultivators out of 100 respondents who have some land in the study area. As per the agricultural census 2010-11 the average size of holding by Scheduled Castes in India is 0.80 hectares. And in Jammu and Kashmir it is 0.70 hectares. As compare to national level landholding by the people in the study area is very low. These land holding is reducing further because of the increase in population and the break-up of joint family system. They all come under the category of marginal and small holding of land. So, our findings also supporting the research earlier
done that Scheduled Castes workers are landless or possess less land.
Cropping Pattern:
The present study shows thatduring the Kharif season they sow only one crop, i.e. Paddy (Rice), as we know R.S. Pura Tehsil is famous for the production of rice. And during the Rabi season they sow wheat and fodder,but only 2 respondents found out of 49 who sow fodder for their cattle. Qualitatively, we can say that people do not have so many options to sow so, many crops because they do not have the infrastructural facilities like irrigation facility transport, storage, trade and marketing, etc. In the context of socio-economic factors they lack financial resources, size and type of the land holding as explained above and lack of cheap labour availability.
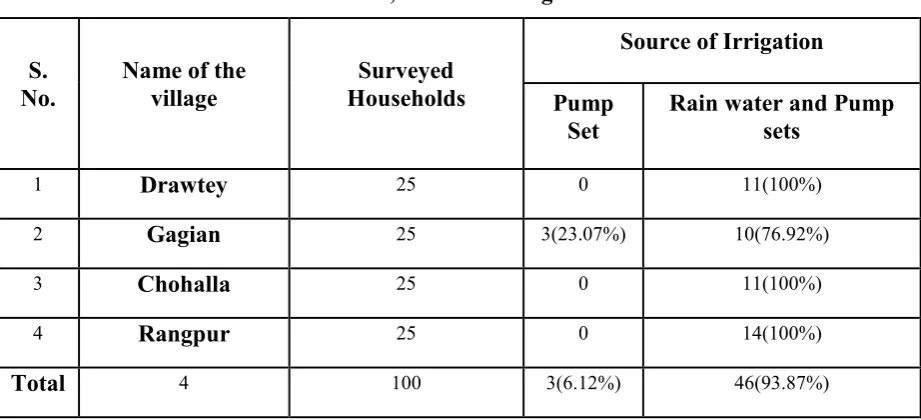
Source of Irrigation: Irrigation is one of the most important critical inputs for enhancing the productivity that is required at different critical stages of plant growth of various crops for optimum production. The major sources of irrigation in India are Wells and Tube wells which contribute 60.9 per cent of the total irrigation in India followed by canals which account for 29.2 per cent, 5.3 per cent from Tanks and other sources of irrigation contribute 5.3 per cent of the total source of irrigation
(www.gktoday.in/sources-of-irrigation-in-india/).
International Journal of Research (IJR)
e-ISSN: 2348-6848, p- ISSN: 2348-795X Volume 2, Issue 05, May 2015Available at http://internationaljournalofresearch.org
Table 5, Source of Irrigation
S. No.
Name of the village
Surveyed Households
Source of Irrigation
Pump Set
Rain water and Pump sets
1 Drawtey 25 0 11(100%)
2 Gagian 25 3(23.07%) 10(76.92%)
3 Chohalla 25 0 11(100%)
4 Rangpur 25 0 14(100%)
Total 4 100 3(6.12%) 46(93.87%)
Source: Survey Data
The statistical figure in the above table 5clearly shows that in the study area only 6.12 per cent of the Scheduled Castes households depend mainly on pump set for the source of irrigation, And the major chunk of the households in the study area i.e. 93.87 per cent are depends on the weather during Rabi seasons and during Kharif they have to purchase water from pump sets. They use water from pump sets in 100 per Kanal from the major land holders who built their own pump sets during the Kharif season because it needs lots of water so they have to purchase water. It can also be seen from the above table 6 that out of the total 100 households from the sample only 49 households are performing cultivation. So, it can be analysed from the above table 6 that most people depend upon rain water because people have less land and they are not ready to spend their money for water.
Production of the households in a year:Production in a year of agricultural workers or cultivators reveals the economic condition of their families. The following table 6 shows the production of the households in a year.
Table 6, Production in a year Production in a year (In Quintals)
Crops
Drawtey Gagian Chohalla Rangpur Combined
Area (In Kanals)
Production (In Quintals)
Area (In Kanals)
Production (In Quintals)
Area (In Kanals)
Production (In Quintals)
Area (In Kanals)
Production (In Quintals)
Area (In Kanals)
Production (In Quintals)
Rice 54 55 46 47 93 100 97 103.8 290 305.8
Wheat 53 53 45 45 93 97 97 100 288 295
Fodder 1 0.5 1 0.5 0 0 0 0 2 1
Source: Survey Data
International Journal of Research (IJR)
e-ISSN: 2348-6848, p- ISSN: 2348-795X Volume 2, Issue 05, May 2015Available at http://internationaljournalofresearch.org
the production of wheat is 288 Kanal which produce 295 quintals wheat in a year. The production of the fodder is only 1 quintal and the area under this is only 2 Kanal. Qualitatively, we can say that people do not have so much land for cultivation, then how their productions can increase and moreover, they cannot afford fertilizers, high verity seeds and other facilities for their crops due to their less income.
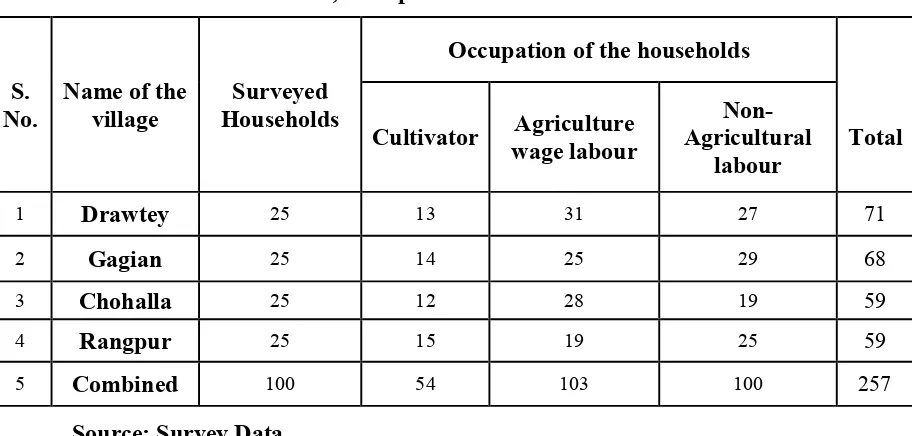
Occupation of the households:Occupation describes the kind of work the person does on the job. These data are derived from responses to write-in questions that are clerically coded by census bureau staff (United States census bureau).
The occupational structure reflects the diversification of economic activities and represents the socio-economic scenario of an area (Census of India).
The following table 8 shows the occupation pattern of the members of the households in the study area.
Table 7, Occupation of the households
S. No.
Name of the village
Surveyed Households
Occupation of the households
Cultivator wage labour Agriculture Agricultural Non- labour
Total
1 Drawtey 25 13 31 27 71
2 Gagian 25 14 25 29 68
3 Chohalla 25 12 28 19 59
4 Rangpur 25 15 19 25 59
5 Combined 100 54 103 100 257
Source: Survey Data
International Journal of Research (IJR)
e-ISSN: 2348-6848, p- ISSN: 2348-795X Volume 2, Issue 05, May 2015Available at http://internationaljournalofresearch.org
occupations, living far-flung, more rural, lack of road and other infrastructural facilities and no other means of livelihood in their locality etc.
Working hours of the Agricultural workers: The regulation of working time is one of the oldest concerns of labour legislation. Already in the early 19th century, it was recognized that working excessive hours posed a danger to workers health and to their families
(International Labour Organization).
The hours of work of agricultural labourers are not regulated by legislation. Hours of work change from place to place, season to season and crop to crop. The working hours are generally from sunrise to sunset. Even though some workers also work after the sunset, which make them tired (Singh and Sadhu, 1986).
So far as the working hours of the study area is concerned, it can be known with the help of the following table 8.
Table 8, Working hours of the Agricultural workers
S. No. Name of the village Surveyed Households Working Hours
Less than 6 6-8 8 +
1 Drawtey 25 1 (4%) 10(40%) 14 (56%)
2 Gagian 25 0 (0%) 14(56%) 11 (44%)
3 Chohalla 25 0(0%) 11 (44%) 14 (56%)
4 Rangpur 25 0 (0%) 10 (40%) 15 (60%)
Total 4 100 1 (1%) 45(45%) 54 (54%)
Source: Survey Data
The above table 8 shows the working hours of the agricultural workers who work seasonally and we can see from the above table 10 that 54 per cent of the workers in the study area doing work more than 8 hours a day, 45 per cent of them 6 to 8 hours a day and only 1 per cent of the workers doing work less than 6 hour a day. And in the category of 6 to 8 hours, most of the workers doing work 8 hours a day, the ratio of 6 to 7 hours is very less. And when we see at the village level this figureare somehow different from the overall study area. The highest percentage of the workers who work more than 8 hours a day in the village of Rangpur i.e. 60 per cent, followed by Drawtey and Chohalla 56 per cent and least in the Gagian village i.e. 44 per cent.
Now, we can evaluate the working hours of these people that how long they are and how less they earn in the form of money. And also researchers while collecting data found no provisions for them at the work places except tea. Many times they get injured in the field, but there is no first aid available at work places.
International Journal of Research (IJR)
e-ISSN: 2348-6848, p- ISSN: 2348-795X Volume 2, Issue 05, May 2015Available at http://internationaljournalofresearch.org
agricultural sector need more facilities at work places. But it is the reverse case prevailing in our society.
Total Annual Household’s Income by Income Class: The following table 9 depicts the picture of the annual income of the members of the households including respondents.
Table 9,Total Average Annual Household’s Income by Income Class
S. No.
Name of the village
Surveyed Households
Total Average Annual Household’s Income by Income Class
Less than 30,000
30,000-40,000 40,000-50,000 50,000-60,000 60,000-70,000 Above 70,000
Average Total Income Income
1 Drawtey 25 66000 133800 373200 218400 198600 222600 48504 1212600
2 Gagian 25 50400 37800 324600 501000 61800 394200 54792 1369800
3 Chohalla 25 27000 286200 411000 222000 128400 7740 46080 1082340
4 Rangpur 25 28200 141600 136200 542400 388800 89400 53064 1326600
Total Combined 100 171600 599400 1245000 1483800 777600 713940 50610 4991340
Source: Survey Data
The statistics in the above table 9 clearly represent that the total income earned by the Scheduled Castes members of the households is (Rs. 4,991,340) per annum. Out of the total income only (Rs. 7, 13,940) of the income come from income level more than 70,000 per annum. The major part of the income i.e. (Rs. 1,483,800) in the study area come under the category of 50,000-60,000 income level, followed by (Rs. 1,245,000) at the income level of 40,000-50,000 per annum. The Average annual income of the members of the Scheduled Castes households in the study area is just Rs. 50610. It is sad to say that still people in the study area are earning very less because they come under the unorganised sector of the Indian economy whose wages are not determined under any legal act. The income that they earn annually is ranges from 40 thousand to 60 thousand which are very poor as compare to any worker’s income who are doing work in the organized sector of the Indian economy.
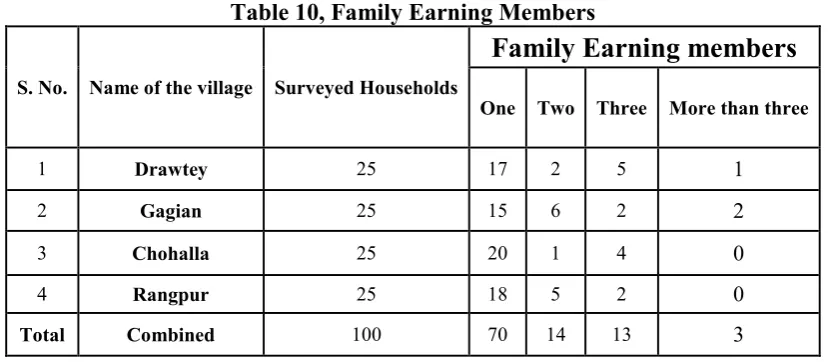
Information of the number of earners in the households: Household’s economic status can be analysed by the total earnings of the family. The amount of aggregate income earned by the members of the family depends to a large extent upon the number of earners in the family. The following table 10 explains the number of earners in the households.
Table 10, Family Earning Members
S. No. Name of the village Surveyed Households
Family Earning members
One Two Three More than three
1 Drawtey 25 17 2 5 1
2 Gagian 25 15 6 2 2
3 Chohalla 25 20 1 4 0
4 Rangpur 25 18 5 2 0
International Journal of Research (IJR)
e-ISSN: 2348-6848, p- ISSN: 2348-795X Volume 2, Issue 05, May 2015Available at http://internationaljournalofresearch.org
Source: Survey Data
From the above table 10 one can see that out of 100 sample households 70 per cent households are there who have only one earner in their families, 14 per cent of them have two and 13 per cent have three. And only 3 per cent of the households have more than three earners in their families. Village wise data also given in the above table 11 which showing somehow same trend. This is also one of the main reasons of their low of income.
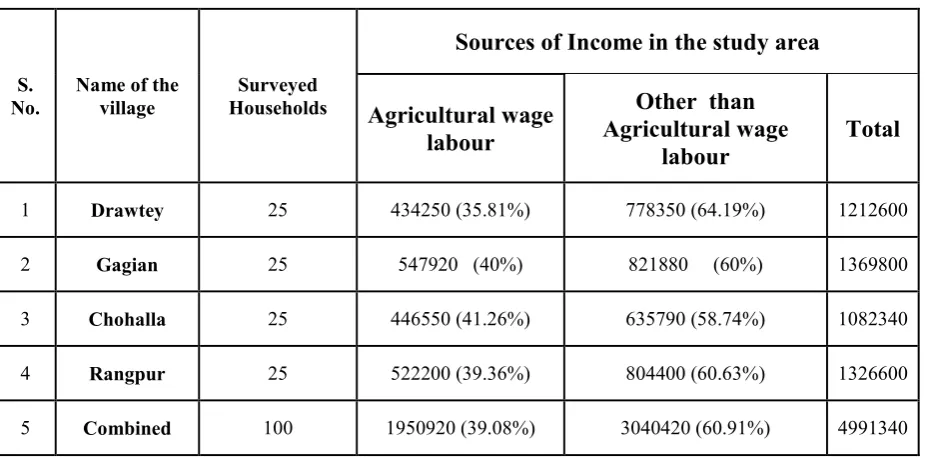
Source of Income: Source of income in the study area can be known from the following statistical table 11.
Table 11, Sources of Income in the study area
S.
No. Name of the village Households Surveyed
Sources of Income in the study area
Agricultural wage labour
Other than Agricultural wage
labour
Total
1 Drawtey 25 434250 (35.81%) 778350 (64.19%) 1212600
2 Gagian 25 547920 (40%) 821880 (60%) 1369800
3 Chohalla 25 446550 (41.26%) 635790 (58.74%) 1082340
4 Rangpur 25 522200 (39.36%) 804400 (60.63%) 1326600
5 Combined 100 1950920 (39.08%) 3040420 (60.91%) 4991340
Source: Survey Data
In the above table 11 it is found that the total average income in the study area is Rs. 4991340 per annum. It can be seen from the above table that 39.08 per cent (Rs. 1950920) of the income is derived from agricultural wage labourers and 60.91 per cent (Rs. 3040420) of the income is contributed by non-agricultural wage labourers. An agricultural wage labourer includes those workers who are doing work on other land as casual labourers. They work as agricultural wage labourers only 4 to 5 months in a year and they earn mostly in kind rather than in cash. They get 1/3 rd of the total output when they get in kind and when in cash there is no fixed wage rate for them. And non-agricultural workers include construction labourer, Private plumber electrician and workers who do every kind of work on the other’s house and shop. They also take care of other’s cattle. Not like the agricultural wage labourer they earn in cash rather than in kind.
Here we have writing average income again and again because of the reason that their income varies throughout the year. So, it is very difficult to get on exact figure of their total income. Gagian village contribute to the total more than other villages of the study area which is Rs.1369800, followed by Rangpur village which is Rs. 132660, and then Village Drawtey which contribute Rs. 1212600. And least contributor is the Chohalla village i.e. only Rs.1082340.
International Journal of Research (IJR)
e-ISSN: 2348-6848, p- ISSN: 2348-795X Volume 2, Issue 05, May 2015Available at http://internationaljournalofresearch.org
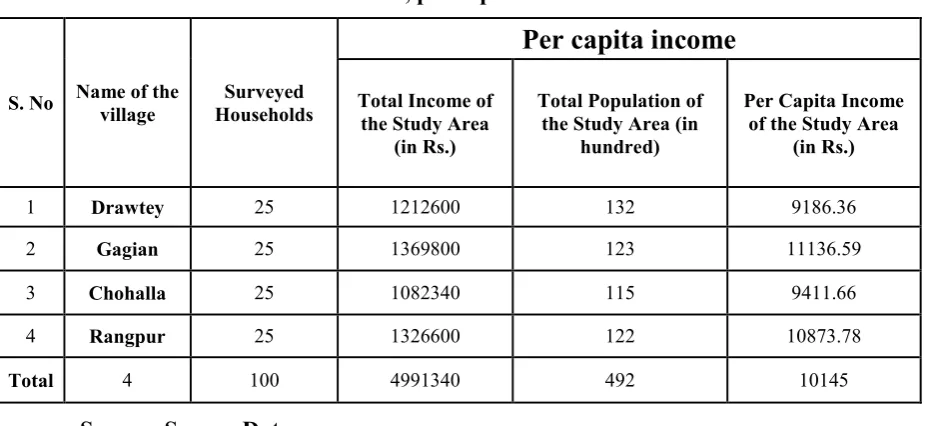
Table 12, per capita Income
S. No Name of the village Households Surveyed
Per capita income
Total Income of the Study Area
(in Rs.)
Total Population of the Study Area (in
hundred)
Per Capita Income of the Study Area
(in Rs.)
1 Drawtey 25 1212600 132 9186.36
2 Gagian 25 1369800 123 11136.59
3 Chohalla 25 1082340 115 9411.66
4 Rangpur 25 1326600 122 10873.78
Total 4 100 4991340 492 10145
Source: Survey Data
As we can see from the above data in the table 12 that overall per capita income is 1, 0,145 which is very low as compare to Per Capita Income of the state. The per capita income of the state at current prices (2012-13) is Rs. 5, 0,806 as per the report of Economic survey of Jammu and Kashmir. Village wise data shown that the per capita income is high only in the Gagian village i.e. Rs. 11136.59, followed by Rangpur village which is Rs. 10873.78 and then Chohalla village which is Rs. 9411.66. And the least per capita is in the Drawtey village which is only Rs. 9186.36.
CONCLUSION AND
SUGGESTIONS:On the basis of the present study a number of area specific suggestions have been made in the following lines which may help in the proper management of various developmental policies and programmes for socio-economic development. As we know that Scheduled casts people are the most neglected class of Indian Society. And the conditions of the Agricultural Wage Labourers are also not very good. When we combined them together the picture become worst as Scheduled Castes landless agricultural wage labourers are the worst exploited class of the Indian society. There is need to improve the
conditions for this the possible suggestions are as under:-
To pursue higher, vocational and technical education they should be given financial assistance in the form of scholarships, loans, etc.
Special attention should be given in accordance with the women education.
As agricultural workers work seasonally not throughout the year they do work as non-agricultural labourers. So, provisions should be made to impart skills to these workers, including vocational training in the traditional and new trades. This will encourage them to undertake entrepreneurship, self-employment and other income generation activities.
Mostly, agricultural workers get wages in kind, i.e. 1/3rd of the total it should be on 50/50 basis.
The fixed wage rate should be determined for these workers.
International Journal of Research (IJR)
e-ISSN: 2348-6848, p- ISSN: 2348-795X Volume 2, Issue 05, May 2015Available at http://internationaljournalofresearch.org
The employment programmes must focus on creating employment opportunities in non-farm and household industry sectors which are highly labour intensive in the study area.
Seeds, fertilizers, and new techniques of cultivation should be made available for them at cheap rate.
Already launched programmes for this purpose should be implemented properly.
At least the provision of two rooms set with kitchen and bathroom facilities should be made to enable them to live in a dignified way with their families.
Programmes and schemes should be telecast on national television and Radio in the regional or Hindi language for these people.
Pamphlets about the newly launched schemes should be distributed among these people in Hindi or Local language.
References
[1.]Census of India. (2001).
[2.]Census of India. (2011).
[3.]Chandy T. K. ,(2013) “Agricultural labour”, Booklet No. 501, Agricultural and social Justice: ASJS-2
[4.]Economic Survey 2011-12, 2012-13 and 2013-14.
[5.]Jammu and Kashmir Economic Survey 2012-13 and 2013-14.
[6.]Singh A and Sadhu A.N, (1986).
Agricultural labour in India. Agricultural problems in India.
Himalaya Publishing House, Page number 338-347.
[7.]Singh, D. (2009). Development of Scheduled Castes in India: A review. Journal of Rural Development, 28 (4), 529-542.
[8.](www.socialjustice.nic.in/scorder 1956php#f2).
[9.]Koundal, V. (2011). Socio-economic conditions of nomadic gujjars of district Udhampur (J&K) and Kangra(H.P), Ph.D. Thesis. University of Jammu, Jammu.
[10.] NathRathindaP, (2012).