Journal of
January, 1965RANGE MANAGEMENT
Response of Deer and Livestock to Controlled
Grazing in Central Texas
CRAIG A. McMAHAN AND CHARLES W. RAMSEY1 Wildlife biologists, Texas Parks and Wildlife Depart- ment, Kerr Wildlife Management Area, Hunt, Texas.
Highlight
White-failed deer welfare and pro- duction under various intensifies of continuous-use grazing by combined cattle, sheep, and angora goafs was studied in fhe Edwards Plateau region of Texas. Under poor range conditions continuous grazing by combined classes of livestock ad- versely effected deer production through competition for food. Live- stock were more efficient compefi- iors for native forage than deer.
The effect of livestock grazing on deer production is a question that has gained increasing im- portance in the Edwards Plateau Region of west-central Texas. This ecologic region of some 26,- 000 square miles supports high densities of white-tailed deer (Odocoileus virginianus) along with combined classes of cattle, sheep, and goats.
Since the introduction of live- stock in the 1800’s range vegeta- tion has changed. Under heavy domestic stocking rates, ranges have deteriorated until “the number of livestock which can be grazed on most Texas range- lands today is less than half the number carried in 1900” (Merrill, 1959). The change in vegetation from grassland to woodland has favored deer. As late as 1875 deer were still regarded as scarce in the northern sector of the
Plateau, and their increase was slow until the 1940’s (Hahn, 1945). Today a deer to 3 acres (or 213 per section) is not un- common.
Competition between deer and livestock in the Edwards Plateau is critical, brought about by the
remarkably similar diets of
sheep, goats, and deer in combi- nation with a relatively gentle topography that allows deer and livestock to occupy the same range (McMahan, 1961) .2
The influence of livestock grazing practices on deer was formerly based mainly on gener- al observations. Low fawn crops,
1 The authors wish to recognize those most responsible for the planning of the experimental grazing pro- gram: E. A. Walker, T. A. Booker, and Leslie R. Hereford, Jr. Statis- tical analysis of data was per- formed by Dr. R. B. Davis, Texas A. and M. University. This paper
is a contribution of the Pittman- Robertson Federal Aid in Wildlife Restoration program, the United States Bureau of Sports Fisheries and Wildlife, and the Texas Parks and Wildlife Department cooperat- ing.
2 McMahan, C. A. 1961. A food habit study of three classes of livestock and deer. Texas Game and Fish Commission, Austin. Project W-76- R, Job 8 Completion Report (mul- tilithed), 156 pp.
1
poor quality carcasses and heavy death losses have been noted
where deer occupy heavily
grazed or poor ranges in the western and northeastern states (Julander, et al. 1961; French, et al. 1955) but objective informa- tion on deer welfare and produc- tion as influenced by combined classes of livestock was lacking in this region. To begin research on these relationships, the Texas Parks and Wildlife Department in 1955 constructed a series of experimental pastures for the purpose of studying deer re- sponse to different intensities of grazing by livestock.
Study Area and Methods The Kerr Wildlife Management Area is located at Hunt, Kerr Coun- ty and is basically ‘representative of the surrounding region of the Ed- wards Plateau. Mean annuai_precipi- tation on the study area is 29 inches, mostly rainfall in the late spring and summer months. Rainfall fluctuates greatly between years and droughts are common. Experimental pastures are on stony soils of limestone origin. Typically, the woody overstory is composed of a liveoak (Quercus vir- giniana) - shinoak (Quercus brevi- Zoba) Savannah aspect in which re- growth ashe juniper (Juniperus ashei) shrubs are conspicious. Texas wintergrass (Stipa Zeucotricha), cur- ly mesquite (Hilaria belangeri) and various three-awn species (Aristida
spp.) comprise the more common grasses with numerous other species present in considerably lesser quan- tity. Most forbs are annuals; their availability being much influenced by the time and amount of rainfall.
I
PAtSlUREI
PASTURE II
mw HEAVY
PAsllJmP MODERATE
PASTURE 5 MmRATE
PASTURE 3 LIGHT
PAS'NR!Z 6 LIGW
PASmE7 DIBX MANAGED MKWOODUND
PASTURE9 NO LIVESTOCK OR DEER
DEER UWNAG!ZLl DEER UNMANAGED MK WOODUND JUNIPER TYPE
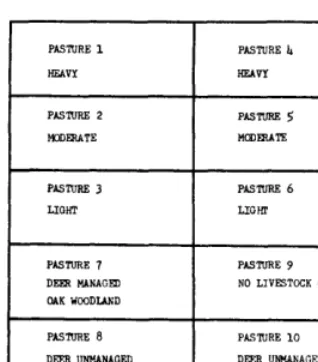
FIGURE 1. Schematic diagram of experi-
mental pastures on the Kerr Wildlife Management Area.
fence to confine ten deer (Fig. 1).
Each pasture was rectangular; pas- tures 1 through 3 were 3,880 feet long and 1,077 feet wide, and the re- maining pastures were 5,280 feet long and 792 feet wide.
The objective of pastures 1 through 6 was to determine the influence of various domestic stocking rates on deer production. Pastures 7, 8, and 10 served as a comparison of deer productivity between two vege- tative types and between two inten- sities of harvest. Pasture 9 was a control with no livestock or deer.
Since continuous yearlong grazing was the common management prac- tice in the Edwards Plateau at the time the experiment was initiated, a yearlong grazing system was used in all livestock pastures, but stock- ing rates were varied. Heavy, mod- erate, and light stocking rates were begun in paired pastures. Rambouil- let sheep, Angora goats, and Hereford
cows were grazed in combination, in as nearly the same proportions be- tween different stocking rates as possible. Heavily stocked pastures, each contained 23 sheep, 22 goats, and 3 cows; moderately stocked pas- tures, 10 sheep, 10 goats, and 2 cows; and lightly stocked pastures 8 sheep, 7 goats, and 1 cow. Heavy stocking was defined as an animal unit 3 to 8 acres; moderate as an animal unit to 16 acres; and light as an animal unit to 24 acres. The beginning num- ber of ten deer per livestock-stocked
3 One animal unit was considered equivalent to 1 cow, 5 sheep, or 5 goats, deer not considered. Female brood stock was used in all pas-
tures.
pasture was to have been constant, but it varied some from the start of the study due to unexpected death losses. In 1961, the program was modified. Pastures 4, 5, and 6 were discontinued as replicates of the con- tinuous grazing system and com- bined as a three-pasture deferred- rotation unit.
The pastures stocked with deer only have furnished information for two comparisons. Pasture number 7 was stocked with 10 deer and the population increase was removed annually during an either sex hunt. In pasture number 8 the herd was allowed to increase “unmanaged” with only occasional buck deer being harvested. Pasture 10 was designed to operate identically to pasture 8 but under different vegetative con- ditions. Pasture 10 was typified by an ashe juniper aspect and pasture 8 was an open oak woodland.
Herbaceous vegetation response to treatment in all pastures was meas- ured by the line intercept method (Canfield 1941). Ten 50-foot line transects per pasture were read an- nually during the summer.
Browse composition was obtained by two lo-foot-wide belts running the length of each pasture. Woody species were recorded by the square feet of canopy. Condition and trend of woody species was a descriptive measure of available browse (that below 5 feet). Since the size and growth form of individual browse plants within a species group was the same, an inference can be made about comparative volumes between treatments within a species group.
To determine the monetary values associated with different stocking rates, detailed records were main- tained on all expenditures and sales of livestock products. Individual weights of lambs, goat kids, wool
and mohair were obtained in a man- ner to facilitate a statistical analysis of the data.
Findings
Influence of Grazing on Deer Production-A summary of deer production in the experimental pastures (Table 1) indicate a low carrying capacity for deer in all the livestock-stocked, con- tinuously grazed pastures. Even in the lightly grazed pasture the average number of deer surviv- ing was only one to 24 acres. Deer production - defined as fawns surviving to yearling age -decreased with an increase in the domestic stocking rate. This is especially evident in the heavi- ly grazed pastures where no
fawns have ever survived to
yearling age. The difference in the average number of deer sur- viving (about 4 adult deer) be- tween moderate and light graz- ing is small; but the heavily grazed pasture supported only about half as many adult deer as the moderate or light.
In contrast to poor deer pro- duction in the livestock-stocked pastures, the deer-only, managed population showed a good meas- ure of success. No fawn produc- tion data in terms of a doe to fawn ratio are available because of the difficulty in differentiat- ing between sexes, but pasture 7 averaged an annual 37 percent herd increment. Production in the stocked pastures on the other hand was well below this. No production was obtained under
Table 1. Deer performance in experimental grazing pastures, averages for 8 years, 1956 fo 1963.
Pasture Starting Adult Fawn
Treatments Population Death Loss Survival _--- Number - - - -
Heavily Stocked 4.5 2.5 0.0
Moderately Stocked 5.7 1.5 1.1
Lightly Stocked 5.6 1.8 1.1
Deer Only, Managed
Oak Type 11.3 0.6 4.9
Deer Only, Unmanaged
Oak Type 13.9 0.9 4.3
Deer Only, Unmanaged
heavy grazing, and under moder- ate and light grazing an average of only 38 percent of the fawns survived. The study did not re- veal differences in breeding per- formance of individuals between grazing intensities because deer had to be trapped and introduced into the pastures from the out- side to replace death losses each year. These introductions nor- mally came after the rut, when most does were already bred.
Deer production in pasture 10, with dense ashe-juniper and no livestock, was almost nil. By March, 1964, this pasture sup- ported a total of only 3 deer, as compared with a total of 24 deer in pasture 8, containing oak woodland. The juniper type in- directly deters deer production by suppressing the growth of staple and preferred deer foods
(Ramsey, 1963) .4 Also, ashe-ju- niper itself is a low-value emer-
gency deer food. (McMahan,
1961, op. cit.)
Differences in the performance
of deer between managed and
unmanaged pastures became ap- parent in 1962 and 1963 when the unmanaged herd showed 19 and 4 percent increment. The man- aged herd had 31 and 38 percent increments respectively. During this two-year interval a total of 7 deer were found dead in the unmanaged pasture while only 2 deer died in the managed pas- ture. Before the last two years of study little difference was noted in deer mortality and pro- duction between the two pas- tures. Since the degree of forage availability became more acute during this period in the unman- aged pasture, food was consid- ered to be the probable limiting factor.
Deer mortality in the live-
4 Ramsey, C. W. 1963. The value of cedar in deer and livestock produc-
tion on the Kerr Wildlife Manage-
ment Area. Texas Parks and Wild- life Dept. Austin. Project W-76-R, Job 4 Special Report (25 pp. mul- tilithed).
stocked pastures was most pro- nounced in the fawns. Within a given year, they were the first to die. Among adults, however, there was no discernible pattern of death losses between age classes or length of time individ- uals were in the enclosure. Adult bucks did better than does in the enclosures, as indicated by their lower death losses. Over the 9 year period in the heavy grazed pasture bucks showed a 50 percent death loss as com- pared to 58 percent for adult does. In the moderately and
lightly stocked pastures the
death losses in adults of both sexes decreased. Bucks showed a death loss of 9 and 11 percent respectively and does a loss of 37 percent under both treat- ments.
Vegetative Response to Treat- ment. - Range conditions were poor at the beginning of the ex- periment due to long heavy use. After the experiment started, conditions improved in the deer- only and control pastures; re- mained static to slightly im- proved in the moderate and light continuous-use pastures and de-
teriorated under heavy continu- ous-use. Range deterioration as evidenced by erosion was curbed under all treatments except heavy use where there are active gullies and pediceled plants everywhere.
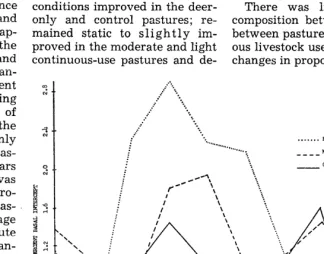
The total amount of grass as measured by basal intercept fluctuated greatly with years. The fluctuations generally fol- lowed the trends in available moisture as measured by annual rainfall (Fig. 2). The moderately grazed pasture is representative of the combined effect of live- stock and rainfall, while the con- trol pasture is representative of the effect of rainfall in the ab- sence of livestock use.
The reserve of grass remaining on the ground and the resulting litter varied with intensity of livestock grazing. As an exam- ple, average grass height meas-
urements during 1963 were:
Heavy, 0.9 inch; Moderate, 2.3 inch; Light, 3.2 inch.
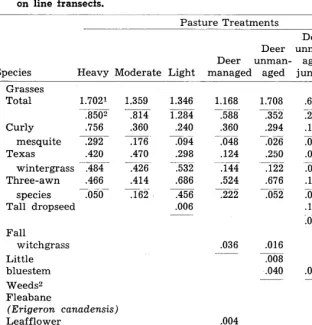
There was little change in composition between years and between pastures under continu- ous livestock use (Table 2). Any changes in proportions apparent-
.’
s
” x *... RAINFALL
i -*..*..,. ‘.‘Q. .*...*__
: ____ HODEIUTELY STOCKFD -.
i :
CON'IROL :
: ,,-?
;
f
*H \ Z_ \ -. ;
1'
\ :
\ :
I
1'
\ \
\ \ \
\ \
\ \
\ _ b'
\
55 56 57 58 59 60 61 62 b3 YFARS
FIGURE 2. Correlation of annual percent basal intercept.
Table 2. Basal intercept percentage of selected grass and weed species on line transects.
Species
Pasture Treatments
Deer Deer unman- Deer unman- aged Con- Heavy Moderate Light managed aged juniper trol Grasses
Total 1.7021 1.359
___ ~
.8502 .814
Curly .756 .360
mesquite .292 .176 Texas .420 -- .470 wintergrass .484 .426 Three-awn .466 .414
- ~.. species To50 .162 Tall dropseed
Fall
witchgrass Little bluestem Weeds2 Fleabane
(Erigeron canadensis) Leafflower
(Phyllanthus polygonoides) Velvet bundleflower
(Desmanthus velutinus) Woollywhite
(Hymenopappus tenuifolius)
1.346 1.284 .240 __-
.094 .298 ___-
.532 .686 .456 .006
1.168 .588 .360 --
.048 .124 .144 .524 ~__
.222
.036
.004
.012
1.708 .352 .294 .026 .250 .122 .676 .052
.016 __..
.008 .040
.698 .224 .158 .024 .060 .032 .112 .044 .116 .030
1.094 .310 .290 --
.020 .206 -.066
.392 .082 .019 .034 .006 .086
.OlO .060
.034
.088
.020
.092
1 1954 readings 2 1963 readings
ly are more related to distribu- tion and amount of rainfall than to animal treatment. An excep- tion is Texas wintergrass which increased in all pastures. Peren- nial bunch grasses increased in the deer-only and control pas- tures. After an initial increase, species such as little bluestem (Andropogon scoparius), tall
dropseed (Sporobolus aspek),
and fall witchgrass (Leptoloma cognatum) had either remained static or decreased in the deer- only and control pastures, pre- sumably from lack of use.
Forb composition in the
stocked pastures was much the same, with only a few additional species showing in the deer-only pastures. Only in the control pasture was the weed composi- tion greatly different from those
pastures containing animals
(Table 2).
Woody plant composition as
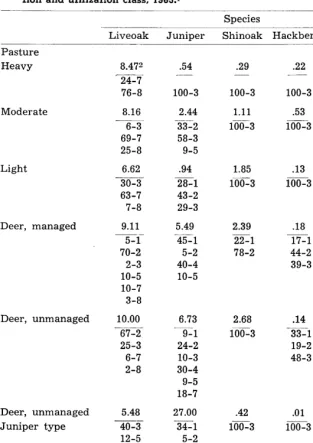
measured by square feet of cano- py remained the same through- out the pastures containing live- stock (Table 3) . A few additional palatable species occur in the deer-only, oak woodland type. The only large increase in avail- able preferred browse occurred in the control pasture. Species
such as woolybucket bumelia
(Bumelia Zanuginosa), and hack- berry (Celtis spp.), which are highly palatable to both goats and deer were unable to repro- duce or to furnish more than a token amount of forage in the livestock pastures. Staple browse species such as liveoak and shin- oak remained about the same within a pasture between years, and between pastures containing livestock. Although browse com- position as measured by canopy was very similar between all
treatments there was a wide dif- ference in available forage. Table 3 gives a descriptive measure of
the relative availability to
browsing animals of leafage be- low five feet. An additional measure, the presence and height of a “browse line,” is indicative of the relative availability of browse. Table 4 illustrates the increase in browse in the absence of livestock as measured by browse line height.
These vegetative measure- ments indicate that continuous grazing provides little or no dif- ferences in plant composition re- gardless of the stocking rate in effect. Differences in stocking rates as reflected in range vege- tation are seen mainly as quanti- tative ones, with few decreaser grass species, preferred forbs, or browse plants becoming estab- lished. In effect this system may be described as a vegetal com- plex composed of plant species that are adapted to the limiting factors of the area-the grazing animals. The main difference be-
tween this complex and the
deer-only pastures is the greater abundance of staple browse in pastures 7 and 8. Apparently continuous use by deer alone may restrict forage composition to species tolerant of continuous use by those animals.
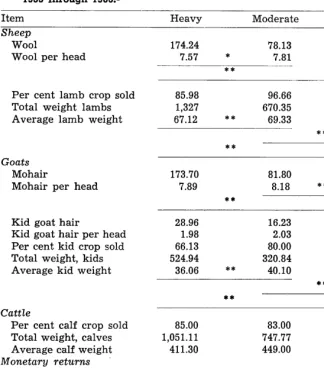
Livestock Production - Live- stock production and average re- turns are shown in Table 5. Lamb and goat kid weights per head increased significantly with a decrease in the stocking rate.
Although wool and mohair
Table 3. Composition and percentage of selected browse plants per condi- tion and utilization class, 1963.1
Species
Liveoak Juniper Shinoak Hackberry Bumelia Pasture
Heavy
Moderate
Light
Deer, managed
Deer, unmanaged
Deer, unmanaged Juniper type
No livestock or deer
8.472 24-7 76-8
8.16 6-3 69-7 25-8
6.62 30-3 63-7 7-8 9.11 5-l 70-2
2-3 10-5 10-7 3-8
10.00 67-2 25-3 6-7 2-8
5.48 --
40-3 12-5 8-7 40-8
100-3
2.44 33-2 58-3 9-5
.94 28-l 43-2 29-3
5.49 45-l 5-2 40-4 10-5
6.73 9-l 24-2 10-3 30-4 9-5 18-7
27.00 34-l
5-2 3-4 45-7 13-8
6.34
1.85 100-3
2.39 22-l 78-2
2.68 100-3
.42 100-3
.22
100-3
53 __- 100-3
.13 100-3
.18 17-1 44-2 39-3
.14 33-l 19-2 48-3
.Ol 100-3
.64
Trace
100-3
.03 100-3
Trace _-
100-3
.12 100-3
.03 ____
100-3
.Ol 100-3
.26 1 Legend to condition and utilization classes: 1, all available light use;
2, all available, moderate use; 3, all available, heavy use; 4, mostly avail- able, light use; 5, mostly available, moderate use; 6, mostly available, heavy use; 7, mostly unavailable; 8, unavailable.
2 Percent composition.
the moderate and light pastures. Mohair production on the other hand showed the opposite effect. Significant differences are seen in production per head between the moderate and light, and be- tween the heavy and light pas- tures, but not between the heavy and moderate pastures. We can- not explain this occurrence.
The moderately grazed pasture averaged the most dollars per acre, while the lightly stocked
pasture returned the most money per animal unit. The large ex- pense of supplemental feeding in the heavy-use pasture during dry years was the main reason it produced less per acre than the moderately grazed pasture over the ten-year period. Net re- turn per animal unit increased as the stocking rate decreased.
Discussion
Continuous grazing by com-
Table 4. Average browse line height in inches on oaks in the experi- mental pastures.
Pasture
treatment Liveoak Shinoak Heavy
Moderate Light
Deer, managed Deer, unmanaged Deer, unmanaged Juniper type
60 64 58 62 58 60 None None None 58
57 62
bined classes of livestock ad- versely effects deer production through competition for food. Yearlong use by animals tends to remove the most palatable and some of the staple forage species, and concentrates competition be- tween domestic animals and deer on fewer, less palatable species. This phenomenon becomes more apparent as the domestic stock- ing rate increases, as evidenced by a decrease in deer production from light to heavy livestock grazing.
Deer are clearly the losers in this type of direct competition for food. Even under starvation conditions they cannot be forced to utilize dry grass which will maintain domestic stock. A re- view of other research indicates that food supply, as influenced by grazing system, intensity of grazing, and by classes of ani- mals grazed, governs positive or negative effects on deer. Most range food plants in our region grow and reproduce better when afforded some rest from grazing. Merrill et. al. (1957) in studies at the Agricultural Experiment Station, Sonora, Texas, found higher densities of deer on pas- tures grazed on a deferred rota- tion system with combined cat- tle, sheep, and goats, than on combined class continuous-use pastures.
In addition to the deleterious effects on deer, it is clear that
heavy continuous grazing has
Table 5. Average livestock production in the experimental grazing pasfures, 1955 through 1963.1
Item Heavy Moderate Light
Sheep
Wool
Wool per head
Per cent lamb crop sold Total weight lambs Average lamb weight
Goats
Mohair
Mohair per head
Kid goat hair
Kid goat hair per head Per cent kid crop sold Total weight, kids Average kid weight
Catt Ze
Per cent calf crop sold Total weight, calves Average calf weight
Monetary returns
Total net average Average net return per
animal unit
174.24 78.13 62.74
7.57 * 7.81 7.84
**
85.98 96.66 94.37
1,327 670.35 531.22
67.12 ** 69.33 70.30
*** **
173.70 81.80 63.22
7.89 8.18 ** 9.03
**
-
28.96 16.23 11.19
1.98 2.03 1.90
66.13 80.00 58.88
524.94 320.84 254.00
36.06 ** 40.10 43.15
** **
85.00 83.00 88.88
1,051.11 747.77 485.55
411.30 449.00 546.25
$154.64 $175.21 $143.46
$ 12.89 $ 29.20 $ 35.87
1 Except where noted, all production is in pounds.
* Indicates significance at 80-90 per cent confidence interval. ** Indicates significance at the .05 level.
*** Indicates significance at 60-80 per cent confidence interval.
rate. The economic implications in this finding are exemplified in the heavy-grazed treatment where the least net dollar return per domestic animal unit was ob- tained.
The combined bad effects of heavy continuous grazing ‘by livestock in the Edwards Plateau region are cumulative and do not become readily apparent until the organic litter cover has been
materially reduced and food
plant reproduction has been cur- tailed.
Summary
Continuous grazing by live- stock adversely effects deer pro- duction through competition for food. Yearlong use by animals tends to remove the most palat- able forage species and concen-
trates competition between do- mestic animals and deer on few- er, less palatable species. This
competition becomes more ap-
parent as the domestic stocking rate increases. Under these cir-
cumstances livestock are ob-
served to be more efficient com- petitors for food than deer. Deer may also be adversely affected in the absence of livestock, again through decreased food supply by (1 building to populations above the range carrying capaci- ty, with no harvest controls, and
(2 being restricted to a home
range exclusively within an
ashe-juniper vegetative type, where other browse and ground cover is scarce.
Under the continuous use sys- tem in our region, deer mortality
is most pronounced in fawns. Among adult deer, does exhibit a higher mortality rate than do bucks, with most death losses coming during the critical sum- mer season.
Vegetative measurements
show that more efficient use of the range may be obtained by running one or several clasess of livestock with deer in order to harvest the forage that deer do not utilize. Deer alone made in- efficient use of the grass cover in their pastures.
No major difference was found in vegetative composition in the 3 continuous use pastures. The key grass plants in this system are Texas wintergrass, three- awn species, and curly mesquite. In the heavy-grazed pasture the volume of forage was less than in the other two lighter-stocked pastures, and the composition
showed a procumbent growth
form. Because of the lack of veg- etative cover and protective lit- ter, severe erosion was every- where apparent on the heavy treatment, but was largely curbed in the two other stocked pastures. Only a few of the more desirable livestock and deer food plants were able to grow and re- produce under the continuous- use system. These findings reit- erate the importance of giving plants periodic rest periods so that they may reproduce.
Livestock production per ani- mal, and the net return per ani- mal unit, increased as the stock- ing rate decreased. The moder- ately-grazed pasture averaged the most returns per acre, fol- lowed in sequence by the heavy and lightly grazed pastures.
LITERATURE CITED
CANFIELD, R. H. 1941. Application of the line interception method in sampling range forage. Jour. For- estry 39: 388-394.
HAHN, HENRY C. 1945. The white- NETTE, AND DALE A. JONES. 1961.
tailed deer in the Edwards Plateau Relation of summer range condi- populations to grazing practices. Region of Texas. Texas Game, tion to mule deer herd produc- Reprint from Sept.-Oct. 1957 Texas Fish and Oyster Commission, Aus- tivity. Jour. Wildlife Mangt. 25: 54- Agr. Progress 3 (5) : 10-12.
tin. 52 pp. 60. MERRILL, LEO B. 1959. Heavy grazing
JULANDER, ODELL, W. LESLIE ROBI-
MERRILL, L. B., J. G. TEER, AND 0. C. lowers range carrying capacity. WALLMO. 1957. Reaction of deer Texas Agr. Progress 5 (2) : 18.
Effects of Fertilization on a Mixed Stand of
Cheatgrass and Intermediate Wheatgrass
BURGESS L. KAY AND RAYMOND A. EVANS
Associate Specialist, Department of Agronomy, Univer- sity of California, Davis, California; and Research Range Conservationist, Crops Research Division, Agricultural Research Service, USDA, University of Nevada, Reno,
Nevada.
Highlight
Applied nifrogen increased calm- petition between cheafgrass and intermediate wheaigrass for soil moisture and resulfed in death of wheaigrass. Grazing further in- creased this effect. Forage increases occurred in iwo of four years but did nof justify cost.
Fertilization of seeded peren- nial grasses in sagebrush areas of the West is mostly experi- mental. Previous studies by Eck- ert et al. (1961)) Kilcher (1958)) and Sneva et al. (1958) indicate fertilizers will increase yield and quality of forage in areas having an average precipitation of 10 inches or more. Kay et al. (1957, 1958) reported yield increases of annuals, particularly cheatgrass (Bromus tectorum L.), in re- sponse to nitrogen application. Such increased growth of annual species would offer greater com- petition to seeded perennial grasses.
The study presented here was established: (1) to determine the responses of a mixed stand of intermediate wheatgrass (Ag- ropyron intermedium (Host) Beauv.) and cheatgrass to vari- ous rates and combinations of fertilizers; (2) to ascertain the
competitive effects of each
species under various fertility regimes; (3) to determine the
effects of environmental factors, especially precipitation, on re- sponses of both species to fer- tilizer, and (4) to determine the practicability of fertilizing es- tablished stands of intermediate wheatgrass and cheatgrass under semi-arid conditions.
Methods
The study was conducted on the University of California Demonstration Range, 2 miles northeast of the town of Likely in the extreme northeast corner of the state? The area is com- monly referred to as tableland, and usually grows big sagebrush (Artemisia tridentata Nutt.), cheatgrass, squirrel tail (Sitanion hystrix (Nutt.) J. G. Smith),
Sandberg bluegrass (Poa se-
cunda Presl), and red-stem fila- ree (Erodium cicutarium (L.) L’Her.). Annual precipitation averages 10 inches, with seasonal totals varying widely. The ele- vation is 4,500 feet, and the growing season is short and vari- able. Cheatgrass may germinate as early as October or as late as March, but seldom is tall enough to graze before May. In a warm wet season, growth may start as
-
1 The cooperation of rancher Warren Fluornoy on whose land this study was conducted is gratefully ac- knowledged.
early as February. The annual grass matures about the first week of June and is dry by the end of June. Winter tempera- tures commonly fall below zero;
summer temperatures may ex-
ceed 100” F. The soil is gravelly loam over clay superimposed over a cemented layer on basal- tic bedrock (Yancy series). To- tal soil depth averages 10 to 20 inches. Livestock use generally is from April 15 to June 15.
Two adjacent fertilizer trials were established in the fall of 1958 on a l-year-old seeding of
Greenar intermediate wheat -
grass. One trial was fenced to exclude cattle, deer, antelope, and rabbits; and the small ro- dents were poisoned as recom- mended by Howard et al. (1957). The second trial was identical in design, but left open to grazing by all animals. Nine fertilizer treatments were replicated four times in each trial in a random- ized block design. Nitrogen was applied as ammonium nitrate at rates of 30, 60, or 120 lb actual nitrogen per acre. Each of these nitrogen rates also was applied in combination with 40 lb/A sul- fur applied as gypsum. The re- maining treatments were 40 lb/A sulfur alone, 60 lb/A nitrogen as ammonium sulphate, and an un- fertilized check plot. Each treat- ment plot was 15 x 15 ft. All ni- trogen (N) and nitrogen plus sul-
fur (NS) treatments in the
fenced trial were split in half at the end of the first growing sea- son (1959) and the nitrogen ap- plication repeated on one-half