Analysis of Diesel Spray Dynamics Using a Compressible
1Eulerian/VOF/LES Model and Microscopic Shadowgraphy
2M. Ghiji*, 1, L. Goldsworthy1, P.A. Brandner1, V. Garaniya1, and P. Hield2 3
1Australian Maritime College, University of Tasmania, Tasmania, Australia 4
2Defence Science and Technology Group, Victoria, Australia 5
This paper presents numerical and experimental analysis of diesel engine spray dynamics in the region 6
very close to the nozzle exit. Diesel fuel is injected through a single solid cone injector with sharp-edged 7
nozzle inlet. Numerical investigations are conducted in an Eulerian framework by applying a Volume of 8
Fluid interface capturing technique integrated with Large-Eddy Simulation turbulence modelling. Cavitation 9
is modelled, by allowing liquid fuel to flash to gas at the fuel vapour pressure. The computational domain 10
and settings mimic the experimental injector internal geometry and experimental operating conditions. In-11
nozzle disturbances are qualitatively well modelled by implementing the no-slip condition at the injector 12
walls as well as cavitation and compressibility effects for each phase. A mesh dependency study is 13
conducted with four different grid resolutions. Data are presented around the start of penetration (SOP) and 14
up to the time when shock waves at the gas-liquid interface are well developed, the quasi-steady stage of 15
injection. At SOP, an umbrella-shaped leading edge is captured in both the numerical and experimental 16
studies however only the experimental images demonstrated a semi-transparent cloud of air-fuel mixture at 17
the leading edge. A previously undescribed toroidal starting vortex near the nozzle exit is captured 18
experimentally and numerically. Development of cavitation, down to the end of nozzle hole leads to the 19
detachment of liquid from the nozzle hole walls and subsequently the diminution of boundary layer effects 20
and thus reduced in-nozzle turbulence, and increased liquid jet velocity. 21
Keywords: Primary atomization; Diesel spray; Large Eddy Simulation; Cavitation; Shock wave; 22
Compressible flow 23
Engine emissions are produced during the combustion process which is fundamentally controlled by 24
the dynamics of the fuel injection [1-6]. There is a wide range of fuel injectors based on their shapes and 25
flow characteristics but the purpose of most injectors is still the same, to induce atomization, penetration, 26
turbulence generation and gas-fuel mixing. Undoubtedly, a clear understanding of these processes would 27
assist engineers to design an injector which not only meets strict pollution requirements but also improve 28
engine performance in one of the most extreme environments for multiphase flow. In this harsh 29
environment, shock waves [7] and turbulent eddies [8] are expected, which makes understanding of the 30
spray dynamics a challenge for designers and scientists. 31
The atomization process which initiates very close to the nozzle hole exit, is called primary 32
atomization and controls the extension of the liquid core and subsequently the secondary atomization in the 33
disperse flow region [9, 10]. To date, many theories have been proposed to describe the primary atomization 34
mechanism, including: Aerodynamic shear forces which act through stripping and Kelvin-Helmholtz (K-H) 35
instabilities [11-13]; Turbulence-induced disintegration which has a significant effect on jet breakup in 36
higher Reynolds number Rel = ρl V D / µl, where ρl is the liquid density, V is the liquid velocity, D is the 37
orifice diameter, and µl is the liquid dynamic viscosity [14-17]; Relaxation of the velocity profile, creating a 38
“bursting” effect especially in non-cavitating jets and large velocity differentials [18]; Cavitation-induced 39
disintegration of the jet due to the reduction of cross-section area at nozzle inlet [19-22]; and liquid bulk 40
oscillation provoking the toroidal surface perturbation [12, 23]. 41
For nozzles with small length-to-diameter ratios super-cavitation and hydraulic flip can occur [24]. In 42
these cases, the liquid fuel which has detached at the nozzle inlet remains detached from the walls 43
throughout the entire nozzle passage, and the liquid core is contracted at the nozzle exit compared to the 44
nozzle size, so the mass flow rate is reduced. If the length of the nozzle passage is long enough, or if the 45
injection pressure is not high, the liquid flow can re-attach to the walls downstream of the nozzle hole inlet 46
[25, 26]. In this case, the discharge coefficient is higher compared to that of the super-cavitation case. 47
Based on the Reynolds and Ohnesorge numbers of the flow, the breakup of liquid jets is categorized 48
into four regimes; Rayleigh breakup, first wind-induced breakup, second wind-induced breakup, and 49
atomization [27]. These parameters also change with different fuels. Detailed studies comparing different 50
fuels and the influence on spray structure and formation have been made by Payri et.al [28, 29], Desantes 51
et.al [30], Battistoni et.al [31], and Goldsworthy et.al [32]. For diesel propulsion systems, the liquid 52
propellants fall well within the atomization regime. In such regime, average drop diameters are much less 53
than the jet diameter, thus indicating that the scale in which flow instabilities arise is much smaller than the 54
jet diameter. Furthermore, liquid jets within this regime experience stronger axial velocity gradients in the 55
near exit region than the jets in other regimes due to faster relaxation of the liquid surface as it transitions 56
from a no-slip boundary (except in the case of “super-cavitation”) to a free surface boundary condition as it 57
exits the injector nozzle. 58
The existence of shock waves in high pressure diesel spray was first reported by Nakahira et al. [33] 59
and most recently by Huang et al. [7] using the schlieren image technique. Hillamo et al [34] demonstrated 60
the imaging of shock waves from a diesel spray using the backlit imaging technique. An increase of 15% in 61
the gaseous phase density near the shock front was quantitatively demonstrated by MacPhee et al. [35] using 62
the X-ray radiograph image technique. 63
In experimentations, isolating and quantifying the various interactive mechanisms involved in primary 64
atomization of a high-pressure liquid jet are very difficult [13, 36-40]. Hence, numerical analysis can be 65
employed to get a clearer insight into the effect of each parameter at different stages of the injection process 66
[4, 41]. 67
Generated turbulent flows can be represented by eddies with a range of length and time scales. Large 68
eddy simulation (LES) directly resolves large scale eddies and models small eddies, allowing the use of 69
needs principally finer meshes compared to the ones used for Reynolds Averaged Navier-Stokes (RANS) 71
computations. Since RANS models cannot capture features of the transient spray structure [9, 12, 42, 43] 72
such as droplet clustering and shot to shot variability, LES is applied to overcome these limitations. In 73
addition, the conventional atomization models with Lagrangian Particle Tracking (LPT) limit the grid 74
fineness near the nozzle and do not allow LES to capture the features of the spray and background fluid flow 75
near the nozzle. Refining the grid with the blob atomization method can result in problems with a high liquid 76
fraction in the LPT approach (too much liquid in each cell) [9, 42-44]. These limitations motivate the use of 77
the Eulerian approach to model the primary atomization, instead of using LPT atomization models. With 78
ever increasing computational power there is an incentive to use more complex models for primary 79
atomization. 80
The accuracy of different numerical techniques for modelling the primary atomization of a liquid 81
diesel jet was investigated in detail for low Re (Re < 5000) by Herrmann [14] and Desjardins & Pitsch [45]. 82
Herrman [14] demonstrated the importance of the grid resolution on capturing the accurate phase interface 83
geometry of diesel liquid with an injection velocity of 100 m/s and Re = 5000. Turbulence was reported as 84
the dominant driving mechanism of atomization within the first 20 nozzle diameters downstream. 85
The present study focuses on experimental and numerical investigation of the primary atomization in 86
the early stages of injection with increasing injection pressure up to 1200 bar, background pressure of 30 bar, 87
liquid Re of 7×10³≤ Rel≤ 46×103, and liquid Weber number of 4×10⁴≤ Wel≤ 2×10⁶. The liquid Weber 88
number (Wel) is defined as ρl V D / σ, where σ is the surface tension at the liquid-gas interface. Recent work 89
using X-ray imaging [46-48], especially from the Argonne Laboratory has greatly enhanced our 90
understanding of diesel spray dynamics. The experimental techniques presented here, while less 91
sophisticated are more accessible and give useful data on the spray morphology for comparison with 92
numerical analysis. 93
A key aim of the present work is to achieve a valid (high-fidelity) Computational Fluid 94
for improved design of diesel engines. A further aim is to apply the numerical and experimental analysis to 96
enhance understanding of in- and near-nozzle processes. 97
Experimental measurements are used to validate the numerical results at various stages of the injection 98
event. The experiments employed a microscopic laser-based backlight imaging (shadowgraphy) technique 99
using a constant volume spray chamber. 100
Numerical investigations are conducted by applying the VOF phase-fraction interface capturing 101
technique in an Eulerian LES framework where cavitation of the fuel is allowed at a predefined vapor 102
pressure. Enhanced cavitation inception due to nuclei is not modelled. The effects of compressibility of each 103
phase have been included in the numerical model, enabling the investigation of more complex physics 104
associated with a diesel spray process such as viscosity and temperature changes, generation and 105
development of cavitation and gaseous shock waves. 106
2.1 Experimental Set-up 107
The experimental apparatus consists of a constant volume High-Pressure Spray Chamber (HPSC). The 108
HPSC operating volume is a square-section prism with rounded corners, with the chamber and spray axes 109
vertically oriented. Optical access to the chamber is via three windows of UV quality, optically polished 110
quartz, with viewing area of 200 × 70 mm. The chamber pressure can be varied to emulate the air density 111
occurring in a diesel engine at the start of injection. Diesel fuel is injected axially through a single solid cone 112
fuel spray with an adjustable injection pressure up to 1200 bar from the top of HPSC as shown in Figure 1. 113
A continuous flow of air through the chamber removes droplets from previous shots. Tests were made to 114
ensure that any turbulence induced by the flushing air did not impact on the spray dynamics, by closing off 115
the flushing air flow and observing if this impacted on the spray morphology. 116
117
Figure 1. The experimental apparatus for shadowgraphy measurements.
118
The injection pressure profile is highly repeatable from shot to shot. The injector needle valve snaps 119
open when the injector pressure achieves a certain value, as determined by the adjustable tension on the 120
needle valve spring. The needle lift is monitored using an eddy current proximity probe. The needle lift 121
transducer indicates that it takes about 200 µs for the needle valve to lift completely. The maximum needle 122
lift is nominally 200 µm. The needle lift commences around 100 µs after the start of injection. However, the 123
response of this transducer may not exactly indicate the motion of the needle as the needle lift detector is 124
mounted on the spring actuating rod rather than the needle itself, so compression of the actuating rod could 125
mask the actual needle motion, and there is potentially some lag in the electronics. 126
A Kistler piezoelectric pressure transducer with a sample rate of 10 MHz monitors the pressure of the 127
fuel supplied to the injector. The high-pressure fuel pulse is generated in a modified Hydraulic Electric Unit 128
Injector (HEUI) as described in Goldsworthy et al. [32, 49]. The ability to independently adjust the needle 129
lift pressure allows relatively high pressures at the point of needle lift, which is more characteristic of 130
common rail injectors than of conventional injectors. 131
Spray Chamber
QM100 Microscope
CCD Camera
Barlow
Laser Head
The spray is illuminated with laser light through a standard solid state diffuser supplied by LaVision. 132
The diffuser employs laser-induced fluorescent from an opaque plate impregnated with a fluorescent dye. A 133
120 mJ dual-cavity Nd:YAG laser is used and in combination with the solid state diffuser, light pulses of 134
duration around 10 ns are achieved. A Questar QM100 long distance microscope is attached to a LaVision 135
Imager Intense dual-frame, 12 bit CCD camera with 1376 × 1040 pixel resolution. The camera is focused, 136
aligned, and calibrated on a graduated scale on the spray axis. With a 2x Barlow lens, mounted between 137
CCD Camera and Microscope, a magnification of 7.7:1, a field of view of 1157 × 860 µm and a spatial 138
resolution of 0.84 µm/pixel are achieved. 139
Data acquisition is initiated at a pre-set threshold of fuel pressure, with an adjustable delay to the 140
acquisition of the images. The camera and laser allow two images with variable time gap as low as 1 µs to be 141
taken for each shot of the injector. The Qswitch signal from the laser indicating that the laser has been fired 142
is acquired in LabVIEW along with the injection pressure and needle lift signal. This indicates the timing of 143
the data acquisition relative to the needle lift and pressure development. The start of penetration is found to 144
be 100±5 µs before the needle lift signal reached 2% of its maximum value. This delay is assumed to be due 145
to compression/buckling of the rod which transmits the spring force to the needle, and electronic delay in the 146
needle lift transducer. The timing jitter of ±5 µs means that meaningful comparison of numerical and 147
experimental penetration against time could not be made with sufficient precision, so instead the consecutive 148
imaging technique is employed. In this technique, to determine the time from SOP to the taking of the 149
second image, shots are repeated until the first image acquired corresponds to the SOP and thus the pre-set 150
delay to the second image represents the time After Start Of Penetration (ASOP). An interval of about 151
2.2 Numerical Approach 153
2.2.1 Mathematical Method 154
In this study, the compressible VOF phase-fraction based interface capturing technique is employed in 155
the open source numerical code OpenFOAM v2.3. The governing equations of the solver which is based on 156
compressibleInterFoam, consist of the balances of mass (1), momentum (2), total energy (3), and enthalpy 157
(4) for two immiscible, compressible fluids with the inclusion of the surface tension between two phases and 158
the equation of state (9). These equations establish a closed system for the variables density 𝜌𝜌, velocity 𝑽𝑽, 159
pressure p, internal energy 𝑈𝑈�, and enthalpy ℎ�, 160
𝜕𝜕𝜌𝜌
𝜕𝜕𝜕𝜕 + ∇. (𝜌𝜌𝑽𝑽) = 0 (1)
𝜕𝜕𝜌𝜌𝑽𝑽
𝜕𝜕𝜕𝜕 +∇.�𝜌𝜌𝑽𝑽⊗𝑽𝑽�= −∇𝑝𝑝+∇.𝜏𝜏+𝜌𝜌𝒈𝒈+� 𝜎𝜎𝜿𝜿𝜿𝜿𝛿𝛿𝑆𝑆(𝑡𝑡) (𝑥𝑥 − 𝑥𝑥′)𝑑𝑑𝑑𝑑
(2)
𝜕𝜕𝜌𝜌𝑈𝑈�
𝜕𝜕𝜕𝜕 +∇.�𝜌𝜌𝑼𝑼�𝑽𝑽�+ 𝜕𝜕𝜌𝜌𝑲𝑲
𝜕𝜕𝜕𝜕 +𝛻𝛻. (𝑝𝑝𝑝𝑝𝑽𝑽) +∇. (𝑝𝑝𝑽𝑽) =−∇. q− ∇. (𝜏𝜏.𝑽𝑽) +𝜌𝜌𝒈𝒈.𝑽𝑽 (3)
𝜕𝜕𝜌𝜌ℎ�
𝜕𝜕𝜕𝜕 + ∇.�𝜌𝜌𝒉𝒉�𝑽𝑽�+ 𝜕𝜕𝜌𝜌𝑲𝑲
𝜕𝜕𝜕𝜕 +𝛻𝛻. (𝑝𝑝𝑝𝑝𝑽𝑽)− 𝜕𝜕𝑝𝑝
𝜕𝜕𝜕𝜕 = −∇. q− ∇. (𝜏𝜏.𝑽𝑽) +𝜌𝜌𝒈𝒈.𝑽𝑽 (4)
where, µ is the dynamic viscosity, t is the time, 𝒈𝒈 is the gravitational acceleration,𝜎𝜎 is the surface tension, K 161
is the kinetic energy, q is the thermal energy flux vector, 𝜏𝜏 is the viscous stress tensor, 𝜅𝜅 is the local 162
curvature of the liquid surface and, n denotes a unit vector normal to the liquid surface S. The operators ∇( ) 163
and ∇.( ) represent the gradient and the divergence operations, respectively. 164
The momentum source due to surface tension force on the interface S(t), the integral term in equation 165
(2), only acts on S and produces a non-zero value when 𝑥𝑥= 𝑥𝑥′ which is an indication of the existence of an 166
interface. The estimation of this integral term is obtained following De Villier [50] through the continuum 167
� 𝜎𝜎𝜿𝜿𝜿𝜿𝛿𝛿(𝑥𝑥 − 𝑥𝑥′)𝑑𝑑𝑑𝑑
𝑆𝑆(𝑡𝑡) ≈ 𝜎𝜎𝜿𝜿∇.𝛾𝛾
(5)
where 𝛾𝛾 is the volume fraction of the liquid phase defined as: 169
γ= �1 0 < γ< 1 0
for a point inside the liquid
for a point in the transitional region for a point inside the gas
(6)
The ‘transitional region’ is where the interface is located, realized as an artefact of the numerical 170
solution process. Fluid in the transition region is considered as a mixture of the two fluids on each side of the 171
interface, which cannot completely resolve a discontinuous step. The volume fraction is obtained from the 172
solution of a transport equation: 173
𝜕𝜕𝜌𝜌𝛾𝛾
𝜕𝜕𝜕𝜕 +𝛻𝛻. (𝜌𝜌𝑽𝑽𝛾𝛾) = 0 (7)
The interface curvature, 𝜅𝜅, calculated from the solution of liquid phase volume fraction 𝛾𝛾 is 174
𝜿𝜿=𝛻𝛻.�|𝛻𝛻𝛾𝛾𝛻𝛻𝛾𝛾|� (8)
The system of equations are closed by an equation of state 175
�𝜌𝜌𝜌𝜌𝑙𝑙 =𝑝𝑝𝜓𝜓𝑙𝑙
𝑔𝑔 =𝑝𝑝𝜓𝜓𝑔𝑔 (9)
where 𝜓𝜓 is the compressibility and the subscripts l and g represent the liquid and gas phases respectively. 176
The local thermo-physical properties are given by: 177
𝜌𝜌= 𝛾𝛾𝜌𝜌𝑙𝑙+ (1− 𝛾𝛾)𝜌𝜌𝑔𝑔 (10)
𝜇𝜇= 𝛾𝛾𝜇𝜇𝑙𝑙+ (1− 𝛾𝛾)𝜇𝜇𝑔𝑔 (11)
The time-varying phase interface S(t) is located using a VOF surface capturing/tracking approach [52] 178
which utilizes a “compression velocity” term [53] in equation (7) to preserve sharp interfaces. 179
The LES/VOF equations are derived from equations (2), (1) and (7) using localized volume averaging 180
the relevant variables into resolvable and sub-grid scales of turbulent fluctuations. As a result of the filtering 182
process, the sub-grid scale fluctuations will be eliminated from the direct simulation. This filtering together 183
with the non-linear convection terms in equation (2) introduce an additional quantity which is known as the 184
sub-grid scale (SGS) stresses τsgs. The SGS stresses comprise correlation of the variable fluctuations at sub-185
grid scales that entail closure through mathematical models, given by: 186
𝜏𝜏𝑠𝑠𝑔𝑔𝑠𝑠 = 𝑽𝑽𝑽𝑽���� − 𝑽𝑽�𝑽𝑽� (12)
and estimated by a sub-grid scale model of the eddy-viscosity type: 187
𝜏𝜏𝑠𝑠𝑔𝑔𝑠𝑠−2
3 𝑘𝑘𝑰𝑰=− 𝜇𝜇𝑠𝑠𝑔𝑔𝑠𝑠
𝜌𝜌 (𝛻𝛻𝑽𝑽�+ 𝛻𝛻𝑽𝑽�𝑇𝑇) (13)
where I is the identity tensor, k is the sub-grid scale turbulent energy and µsgs is the sub-grid scale viscosity. 188
Both are determined from the one-equation SGS turbulent energy transport model accredited to 189
Yoshizawa [54]: 190
𝜕𝜕𝑘𝑘
𝜕𝜕𝜕𝜕 +𝛻𝛻. (𝑘𝑘𝑽𝑽�) =𝛻𝛻. [(𝜗𝜗+𝜗𝜗𝑠𝑠𝑔𝑔𝑠𝑠)𝛻𝛻𝑘𝑘+𝜏𝜏𝑠𝑠𝑔𝑔𝑠𝑠∙ 𝑽𝑽�]− 𝜀𝜀 − 1
2𝜏𝜏𝑠𝑠𝑔𝑔𝑠𝑠 ∶(𝛻𝛻𝑽𝑽�+𝛻𝛻𝑽𝑽�𝑇𝑇) (14)
where ε = Cερ k(3/2)/ Δ is the SGS turbulent dissipation ϑsgs = Ckρ k(1/2)/ Δ is the SGS kinematic viscosity and 191
Δ = V(1/3) is the SGS length scale where V is the volume of the computational cell. The coefficients, found 192
from statistical considerations, are Cε = 1 and Ck = 0.05 [9]. 193
The gaseous phase is represented by air. Any fuel vapor produced by low-pressure evaporation is 194
given the properties of air. Fuel is allowed to vaporize when its pressure falls to the vapor pressure of diesel 195
fuel at ambient temperature 1 kPa [26]. This flash boiling model can be considered as a basic cavitation 196
model. Specific heat capacity, dynamic viscosity and Prandtl number are constant for each phase. 197
2.2.2 Numerical Solution Method 198
Mathematical models are solved by an implicit finite-volume method, which utilizes second order 199
Split Operator (PISO) algorithm [55], together with conjugate gradient methods for coupled solution of mass 201
and momentum conservation equations which is specifically suited to transient flows [56]. The advection 202
terms are solved by a bounded Normalized Variable (NV) Gamma differencing scheme [57] with a blending 203
factor of 0.2 and the interface compression scheme (CICSAM) by Ubbink [52] for capturing sharp 204
immiscible interfaces. A conservative, bounded, second order scheme, Gauss linear, is used for Laplacian 205
derivative terms with an additional explicit corrector for mesh non-orthogonality [57]. A second order, 206
implicit discretization scheme (backward) is used for the time derivative terms. The numerical integration 207
time-step is adjusted by velocity-based Courant–Friedrichs–Lewy (CFL), and a speed of sound based CFL 208
set to below 0.15 and 2.0 respectively. 209
2.2.3 Boundary Conditions and Initial Set-up 210
The geometry of the experimental nozzle is determined using X-ray Computer-Aided 211
Tomography (CAT) analysis as shown in Figure 2. This analysis reconstructs the images with the pixel 212
number of 1016 × 1024 × 1024, and an effective voxel size of 2.318 µm. 213
214
Figure 2. Left: X-Ray Tomography measurements of sac and orifice geometry conducted using an Xradia MicroXCT
215
instrument by the Centre for Materials and Surface Science and the Centre of Excellence for Coherent X-ray Science at
216
La Trobe University. Middle: the structured hexahedral mesh based on CAT measurements. Right: cross-section of the
217
computational domain presents the mesh resolution, dimension and condition of the boundaries for coarse case with 4
218
million cells. The nozzle inlet is sharp edged.
219
Orifice
Sac
Spray Chamber
O
ut
let
12
D
Outlet 10D
D
Inlet 7.2D
Injector wall
XY YZ
All the experimental conditions are replicated in numerical models including the sac volume inlet, 220
spray chamber pressure and air and diesel fuel temperature and viscosity. Fuel properties and set up 221
conditions are listed in Table 1. In the absence of direct measurement, sac pressure is assumed to increase 222
from chamber pressure (30 bar) to 850 bar after 50 µs then to 1200 bar after a further 25 µs then constant at 223
1200 bar to the end of simulation at 100 µs. This is to some extent arbitrary but is premised on published 224
data implying that the sac pressure rises rapidly during needle opening [46, 58-60]. For instance, Moon et al. 225
[46] found that the quasi-steady stage jet velocity was reached when the needle lift was only 17% of the 226
maximum needle lift. The ramp is chosen to give an approximate match of modelled and experimental 227
penetration rates. The lower pressure rise rate in the second 25 µs is adopted to avoid numerical instabilities. 228
Table 1. Fuel properties and operating conditions based on experimental setup.
229
Parameter Value
Injection pressure 120 MPa average Chamber pressure 30 bar
Nozzle diameter 0.25 mm
Nozzle length 1.6 mm
Nozzle nominal geometry KS = 0 Nozzle inlet radius Sharp edged
Sac volume 0.19371 mm3
Walls temperature 25°C
Fuel Diesel
Fuel temperature 25°C
Fuel density 832 kg/m3
Fuel Kinematic viscosity 2.52 × 10⁻⁶ m2/s
Fuel Re 7×10³≤Re
l≤ 46×103
Fuel We 4×10⁴≤We
l≤ 2×10⁶
Gas Compressed air
Gas temperature 25°C
Density ratio 42
Surface tension 0.03 N/m *Indicative Injection velocity 367
*Fuel Mach number 367 / 1250 = 0.3 *Ohnesorge number 0.077
* Injection velocity, Mach and Ohnesorge numbers are for the developed spray, calculated based on 230
experimental measurements [32]. The nozzle diameter is used as the length scale. 231
Fluid flow through the passage between the needle and seat is not modelled. In a real injector 232
contribute to more significant and earlier jet breakup. A pre-simulation approach could involve modelling 234
the flow through the needle/seat passage in some fixed configuration, perhaps with the needle partially open 235
and thus quantifying the turbulent flow field, which would then be used as an the initial condition at sac 236
inlet. While this approach has merit, it is beyond the scope of the current work. A uniform pressure boundary 237
with a turbulent intensity of 4.4% is applied over the sac entry plane. Thus, any effects due to turbulence or 238
flow asymmetry generated in the passage between the needle and seat [60-64] are not modelled. A non-239
reflective boundary with the constant pressure of 30 bar is employed at the spray chamber domain. The 240
nozzle and sac walls are adiabatic. 241
At the start of each injection in the experimentation, the nozzle is neither necessarily full nor empty of 242
fuel due to the transient physics associated with the End of Injection (EOI) process from the previous 243
injection event [47, 58-60]. The initial model conditions have the sac and 5.2D of the 6.4D long orifice (81% 244
of the nozzle length) filled by diesel fuel at a pressure of 30 bar and the remainder of the nozzle filled with 245
air. This initial stage is somewhat arbitrary and the rationale is described in Ghiji et al. [65]. 246
A 3D hexahedral structured mesh with the non-slip boundary condition on the walls of the sac and 247
nozzle is implemented to capture the non-axisymmetric nature of the injector flow and disintegrating jet [32, 248
42-44, 66], as shown in Figure 2. By generating a high grid resolution at the boundary layer of the nozzle 249
walls, the utilization of a wall function has been obviated. Structured grids are used to achieve higher quality 250
and control which may be sacrificed in unstructured and hybrid meshes. In addition, the efficiency of the 251
differencing scheme for bounding the convection term of the transport equations in a structured mesh is 252
much higher in comparison with an unstructured mesh [67]. 253
A mesh sensitivity study is carried out using four mesh resolutions, very coarse (0.6 million cells), 254
coarse (4 million cells), medium (8 million cells), and fine grid (20 million cells). The cell size is refined 255
down to average 0.5 µm in the nozzle and 3 µm in the primary atomization zone for the fine mesh case. This 256
reasonable representation of a single droplet [14]. The resolution of these cases, time-step range, the number 258
of CPUs, and computational cost (wall clock time) for each case are summarized in Table 2. 259
Table 2. Summary of meshes and computation parameters for numerical models. Total simulation time is 100 µs.
260
Case
Average Spatial Resolution
(µm and cells/D) Cell count Time Step
(×10-9 S)
CPU (core count)
Wall clock time (hours)
Sac Orifice Chamber
Very Coarse
25 (20/D)
4 (65/D)
14
(20/D) 0.6 × 10
6 1.5≤ ∆T≤30 32 208
Coarse 13
(40/D) 2 (130/D)
6.5
(40/D) 4 × 10
6 0.7≤ ∆T≤10 128 501
Medium 7.5
(55/D)
1.2 (210/D)
5
(50/D) 8 × 10
6 0.5≤ ∆T≤ 8 256 739
Fine 4
(85/D)
0.5 (500/D)
3
(75/D) 20 × 10
6 0.4≤ ∆T≤4 512 965
3.1 Mesh Dependency and LES Quality 261
In order to take into account the significance of in-nozzle generated turbulence on primary atomization 262
[13, 14], the size of the cells in the nozzle for the fine resolution case was decreased to the order of the 263
Kolmogorov length scale 𝜂𝜂 = (ʋ3/ɛ)1/4 where ɛ is the average rate of dissipation of turbulence kinetic 264
energy per unit mass. To resolve a given length scale 𝜂𝜂, the grid scale must be less than half of the length 265
scale [57]. The smallest length scales associated with the flow field for the fully developed spray are 266
reported in Table 3. It can be seen in this table that 𝜂𝜂𝑙𝑙 in the nozzle is much larger than the mesh size for the 267
finest mesh. This mesh resolution enables good prediction of small eddies of the liquid phase inside the 268
nozzle. It was not possible to achieve mesh scales below the Kolmogorov length scale for the gas phase 269
demonstrating the necessity for employing a sub-grid scale model to include turbulence effects in the gas 270
phase. 271
272
Table 3. Kolmogorov length scales for the liquid and gas phases of the developed spray where the turbulence
273
intensities used are 4.4% and 10%, respectively. The indicative injection velocity 367 m/s is used for these
274
calculations.
275
Parameter Value
(µm) Liquid phase Kolmogorov length
scale, 𝜂𝜂𝑙𝑙 0.7
Minimum mesh size in the nozzle
hole for fine case, ∆xmin 0.1 Gas phase Kolmogorov length
scale, 𝜂𝜂𝑔𝑔 0.1
Minimum mesh size in the spray
chamber for fine case, ∆xmin 1.7
The ratio of resolved turbulent kinetic energy (kres) to total turbulent kinetic energy (TKE = ksgs+ kres) 276
indicates the quality of the LES model and consequently the adequacy of the overall grid fineness [9, 68]. 277
For satisfactory LES modelling this ratio should be more than 80% [68]. The resolved turbulent kinetic 278
energy is calculated over 10 μs at a probe point located at 4D (1 mm) from the nozzle exit. The overall ratio 279
of ksgs to TKE predicted by the sub-grid scale turbulent model at the quasi-steady stage with the fine mesh 280
resolution is equal to 2.4%. In addition, the numerical turbulent diffusion due to the discretization error is the 281
same magnitude as the turbulent diffusion computed by the sub-grid scale model [9, 68]. Thus, at the quasi-282
steady stage with the finest grid, the resolved turbulent kinetic energy is calculated at 95.2 % of TKE 283
indicating a satisfactory LES model. 284
Total pressure and mean velocity at nozzle exit were calculated for all meshes at the quasi-steady stage 285
(Pinjection = 1200 bar) and the result is shown in Figure 3. The difference between the medium and the coarse 286
288
Figure 3. Comparison of total pressure and mean velocity for different mesh resolutions calculated on a cross-sectional
289
plane at the nozzle hole exit, and the sac inlet pressure of 1200 bar.
290
Average radial profiles of absolute velocity magnitude and mass fraction of liquid at various distances 291
from the nozzle hole inlet (1D, 2D, 4D, and 6.4D the end of the nozzle hole) for three meshes at the quasi-292
steady stage (Pinjection = 1200 bar) are shown in Figure 4. Maximum velocity of 480 m/s is captured at the 293
centre of the nozzle (r/D=0) as expected. The average velocity and mass fraction at different locations inside 294
the nozzle hole show tendency toward grid convergence for the finest mesh. The velocity on the nozzle wall 295
(r/D=0.5) is zero as a result of the no-slip condition applied to the injector walls. The velocity of the layer of 296
gas near the walls remains near zero until near the nozzle exit where inflow of gas from the chamber results 297
in increased velocity magnitude. The gas layer thickness grows with distance from the nozzle inlet reaching 298
at the nozzle exit around 70% of the cross-sectional area occupied by the liquid phase. 299
0 20 40 60 80 100
0.6 4 8 20
0 100 200 300 400 500 600
T
ot
al
P
res
s
ur
e
(M
P
a)
Number of Cells (x106)
M
ean
V
el
oc
it
y
(
m
/s
)
300
Figure 4. Averaged radial profiles of absolute velocity magnitude and liquid mass fraction on cross-sectional planes at
301
1D, 2D, 4D, 6.4D (end of the nozzle hole) from the nozzle hole inlet, at the quasi-steady stage. Maximum velocity is
302
480 m/s. The results show tendency to grid convergence for the finest mesh.
303
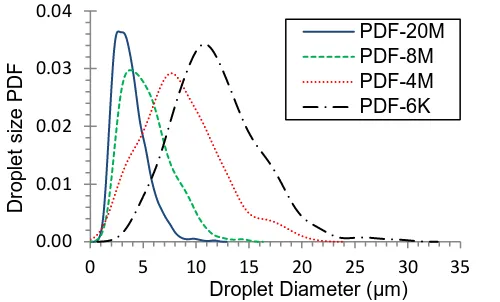
Probability density functions of droplet size for the entire domain outside the nozzle for each mesh density 304
are shown in Figure 5. Both the droplet size range and the dominant size reduce with increasing mesh 305
resolution. It can be seen however that both of these quantities show tendency to converge for the finest 306
mesh. The probability density function for the fine mesh case demonstrates that the dominant droplet 307
diameter captured is around 2.5 μm. 308
309
Figure 5. Probability density functions of droplet size for four mesh resolutions at the quasi-steady stage,
310
demonstrating near convergence of dominant size and size range for the finest mesh.
311
The impact of mesh density on atomisation is shown with an instantaneous mass distribution of all 312
droplets at various axial distances from the nozzle exit for three mesh resolutions at the quasi-steady stage of 313
injection, presented in Figure 6. The value of total atomized mass is very small close to the nozzle exit, 314
increases slowly up to 10D and then increases rapidly further downstream. Increasing the mesh density 315
0.00 0.01 0.02 0.03 0.04
0 5 10 15 20 25 30 35
D
ropl
et
s
iz
e P
D
F
Droplet Diameter (μm) PDF-20M PDF-8M PDF-4M PDF-6K mliq
/m
to
ta
l
V
/V
m
a
xl
reduces the size of captured droplets, as shown in Figure 5, which consequently reduces the total mass of 316
disintegrated liquid. Grid dependence of atomized mass increases with distance from the nozzle exit, due 317
primarily to increasing grid size. The rest of the simulations presented in this paper are performed with the 318
finest mesh. A still finer mesh was not considered practical due to limitations of the available computational 319
power. 320
321
Figure 6. A snapshot of cumulative mass distribution of droplets along the axial distance from the nozzle exit for three
322
mesh resolutions at the quasi-steady stage of injection. The value of total atomized mass is very small close to the
323
nozzle exit, accelerates slowly up to 10D and then increases rapidly further downstream.
324
3.2 Mass Flow Rate 325
Mass flow rate and discharge coefficient at the nozzle exit predicted with the fine grid are shown in 326
Figure 7. SOP is 12 µs after start of simulation and sac pressure reaches its maximum value of 120 MPa at 327
75 µs after start of simulation, so maximum sac pressure is reached at 63 µs ASOP. It can be seen in Figure 328
7 that modelled mass flow rate begins to level out at around 45 µs ASOP. The measured steady state flow 329
rate and discharge coefficient for this injector are 0.0139 kg/s, and 0.6219 respectively [32] and the modelled 330
values of 0.013 kg/s and 0.64 at the quasi-steady state are close to the measured values. The measured mass 331
flow rate was found by repeatedly firing the injector for long opening times of 17 ms for more than 100 332
0 1 2 3 4 5 6 7
1 2 3 4 5 6 7 8 9 10 11 12
C
um
ul
at
iv
e
A
tom
iz
ed M
as
s
×
10
-8
(g
/s)
Dimensionless Axial Distance (Z/D) 20M
injection events, dividing the fuel consumed by the total time for which the injector needle was open. By this 333
method, the time at which the injector needle is partially open is only a very small fraction of the total 334
measurement time. There is an estimated ±10% uncertainty in measured mass flow rate so the modelled 335
values agree within experimental error, giving confidence in the accuracy of applied numerical methods. 336
337
Figure 7. Discharge Coefficient (Cd) and total mass flow rate at the nozzle exit against time ASOP. The onset of
338
cavitation occurs at 11 µs ASOP. The mass flow rate begins to level out at around 45 µs ASOP and reaches an average
339
value of 0.013 kg/s in the quasi-steady stage.
340
The numerically predicted contraction coefficient is slightly higher than the theoretical limit for an 341
ideal sharp entrance orifice (Cc = π/(π+2) = 0.611), with a value of Cc = 0.619. 342
3.3 Penetration Velocity 343
The Reynolds number and mean velocity of the flow at the nozzle exit for different times ASOP, 344
predicted by the fine grid are presented in Figure 8. The mean velocity and Reynolds number increase up to 345
around 100 MPa pressure difference then steady out at mean values of 480 m/s, and 46000 respectively.The 346
displacement of the leading edge and time interval between shots are used to calculate penetration velocity, 347
similar to the previous experimental studies [69-71], depicted in Figure 9. The jet leading edge is detected 348
and distinguished from the image background using an intensity threshold criterion. A number of shots over 349
a range of inter-frame times varying between 1 and 15 µs are analysed. The error bars are based on the 350
accuracy of the detection of the leading edge of the jet and this is a function of the inter-frame time. The 351
scatter in the experimental results demonstrates shot to shot variability in spray development. The jet 352 0 5 10 15 0 0.2 0.4 0.6 0.8 1 1.2
0 10 20 30 40 50 60 70 80
Mas s F low R at e (g/ S ) D is c har ge C oef fi c ient
Time ASOP (μs)
Discharge Coefficient Mass Flow Rate
penetration velocity at various axial distances from nozzle exit with corresponding time ASOP, 353
demonstrated in Figure 9, show good agreement between numerical and experimental results. 354
355
Figure 8. Mean velocity and Reynolds number of the the mixed-phase jet at the nozzle exit, against the square root of
356
the difference between the sac pressure and the chamber pressure.
357
358
Figure 9. Experimental and numerical values of penetration velocity of the leading edge at various axial distances
359
from the nozzle exit and time ASOP. The location of the leading edge at different times ASOP is correlated.
360
Uncertainties arise in these measurements from two dominant sources: variability in the measurement 361
of spray image timing relative to SOP; and shot-to-shot variations in the spray dynamics. Due to 362
uncertainties in acquiring an exact time of the start of injection, the penetration velocity of the jet was plotted 363
against the location of the jet leading edge instead of the time after start of injection. 364 0 10 20 30 40 50 0 100 200 300 400 500 600
0 5 7 8 10 11 11 11 11
R e y n o ld s N u m b e r ( × 103) M ean V el o ci ty ( m /s)
(Pi-Pchamber)1/2(MPa)1/2
Mean Velocity Reynolds Number
0 5 10 15 20
50 75 100 125 150 50 75 100 125 150
0 2 4 6 8
Time ASOP (µs)
P enet rat ion V el oc it y ( m /s )
Dimensionless Axial Distance (Z/D) Numerical Experimental
3.4 Evolution of Spray Structure 365
3.4.1 Morphology of Penetrating Jet during the early opening transient 366
Figure 10 shows a comparison of experimental images with the numerical results for the fine mesh 367
case at different times ASOP using the 2× Barlow lens to give a total magnification of 7.7:1. Some 368
transparency can be seen in the shadowgraphy images at the leading edge. This is thought to be due to air 369
inclusion inside the nozzle, from the previous injection. The existence of ingested air inside the injector was 370
reported by Swantek et al. [47]. The air inclusion inside the injector influences the spray structure and could 371
be a source of the observed deviation between experimental and numerical results. 372
373
Figure 10. Comparison of experimental images with numerical results for the fine mesh case with the highest
374
magnification. Each column of the experimental image is from a different injection event captured from two
375
consecutive frames with 1 µs inter-frame time.
376
a
b
c
d 2 µs
3 µs
4 µs
5 µs
Volume Fraction of Diesel Fuel
Consecutive images in (a) and (b) are from a single shot of the injector, while successive images in (c) 377
and (d) are from another shot of the injector, each pair with 1 µs time interval. It is apparent in (c) and (d) 378
that a liquid core is advancing into the dispersed leading edge. Numerical results show the structure of the jet 379
colored by the volume fraction of diesel fuel (γ) at different times ASOP. Cells containing air only are 380
shown in white. 381
The numerical and experimental results show the early development of the umbrella-shaped leading 382
edge and the early stages of shedding of droplets from the rim of the leading edge. Shadowgraphy images 383
with a larger field of view are compared with numerical results in Figure 11, presenting the general structure 384
of the diesel spray. In this Figure, images (a) and (b), (d) and (e), (g) and (h), (i) and (j) are paired, each pair 385
captured from a single injection event with 1 µs delay between two consecutive frames. 386
The necking of the jet behind the umbrella can be seen in the experimental images in Figure 11, while 387
it is not marked in the simulations. The difference is possibly due to the presence of air in the experimental 388
jet, as indicated by the partial transparency of the experimental images, and thus more rapid disintegration. 389
The outer recirculating gas flow removes the generated droplets and advects them toward the outer flow. 390
Another difference between the numerical and experimental results is in the production of very small 391
droplets in the experimental images unlike them that in the simulations. This is due to the constraint in 392
computational resources where the grid resolution in the computational domain is insufficient to resolve the 393
small eddies in the gas phase which influences the breakup process of the ligaments and droplets. 394
The overall morphology of the early spray as modelled here taking into account compressibility is not 395
significantly different from simulations assuming incompressible fluid as reported in Ghiji et al. [65]. This is 396
because the Mach number of the liquid at this stage of the injection is less than 0.3 and thus compressibility 397
effects are negligible. Further, cavitation is only just beginning. Cavitation is apparent with the formation of 398
cavities on the walls just downstream of the nozzle entrance and the associated formation of cavitation 399
401
Figure 11. Comparison of experimental images with numerical results extracted from the fine case for the SOP
402
process. Images a and b, d and e, g and h, i and j are paired, each pair captured from the same injection event with 1 µs
403
inter-frame time. Numerical results show the structure of the liquid jet colored by γ at corresponding times ASOP. The
404
onset of cavitation downstream of the nozzle entrance is apparent. Cavitation bubbles can be seen arising near the
405
nozzle entrance which are then transported down the nozzle.
406
a
b
c
d
e j
i h g f
5 µs
6 µs
7 µs
8 µs
9 µs 14 µs
13 µs 12 µs 11 µs 10 µs
Volume Fraction of Diesel Fuel
The onset of cavitation occurs at 11 µs ASOP where the pressure of diesel fuel drops to the diesel fuel 407
vapour pressure, 1 kPa, just after the sharp edged nozzle hole inlet, as depicted in Figure 12. The 408
development of cavities further downstream can be seen in images b, and c with their corresponding static 409
pressure distribution illustrated in images f, and g respectively. At image d 27 µs ASOP, cavities extend to 410
the end of nozzle hole while high-pressure spray chamber air penetrates into the gap between the nozzle wall 411
and liquid jet interfaces. 412
413
Figure 12. A zoomed-in view of the nozzle hole shows the onset and enhancement of cavitation at various times
414
ASOP colored by the volume fraction of diesel fuel (images a-d), and static pressure (images e-h). The onset of
415
cavitation can be seen in the image a where the static pressure of liquid drops to the liquid vapor pressure, 1000 Pa, in
416
image e. Hydraulic flip, a detachment of liquid from the entire nozzle wall is depicted in images d, and h.
417
3.4.2 Evolution of in-nozzle and jet liquid-gas turbulent structures 418
3.4.2.1 Starting vortex 419
The experimental images show a toroidal vortex just behind the leading edge of the emerging spray 420
within the first few microseconds of penetration. This structure is apparent due the density gradients in the 421
chamber air inherent in the toroidal flow. Further, numerous experimental images show the vortex very close 422
a
b
c
d
e
h g f 11 µs
14 µs
25 µs
27 µs
Static Pressure (Pa) VF of Diesel Fuel
0 1
1.7e5 6.9e7 1e3 4.1e7
3e5 4.6e7
to the nozzle exit, prior to the emergence of liquid. This is thought to be due to the presence of air in the 423
nozzle, with the air being ejected before the fuel and thus creating the shear-induced vortex, as seen in 424
Figure 13 which illustrates the initial vortex formation in the gas phase experimentally (13-a) and 425
numerically (13-b and c). The numerical result is shown at 2 µs Before Start Of Penetration (BSOP). A 426
positive Q-criterion showing the small-scale turbulent structures where mixing is important is shown in 427
Figure 13-c. The color in the Q-isosurface indicates the vorticity in the z-direction, red indicates clockwise 428
rotation and blue counter clockwise rotation. The shots showing the vortex before the fuel appears are 429
generally for earlier timing meaning that there is always air ejected first but this is only seen for the earliest 430
timing of the images. The initial air slug seen experimentally is taken as further evidence of the existence of 431
air in the nozzle prior to injection. In section 2.2.3 the inclusion of air as the initial condition is discussed. 432
Modelled air density is also plotted in Figure 13 showing the density gradient associated with the starting 433
vortex induced by the initial slug of air prior to liquid. It is likely that the amount of air in the nozzle and the 434
configuration of the air-fuel interface vary from shot to shot. 435
436 437
Figure 13. Starting vortex at or just before the start of penetration (BSOP); image a shows shadowgraphy result; image
438
b and c depict the CFD results at 2 µs BSOP. Image b is shaded by air density on a centralized cut plane. Image c
439
shows the Q-isosurface of 5 × 10¹², colored by vorticity in the z-direction, where red indicates clockwise rotation and
440
blue counter clockwise rotation. The body of the injector is shown in light grey and the dark grey disc shows the
441
location of the leading edge of the liquid (filtered by a liquid fraction of 0.5) relative to the vortical structures.
442
a b
vortex c
Air Density (kg/m3)
40
Figure 14 illustrates the initial vortex formation in the gas phase experimentally (14-a) and numerically 443
(14-b and c) after the liquid has begun to penetrate. The numerical result is shown at 2 µs ASOP. A positive 444
Q-criterion showing the small-scale turbulent structures where mixing is important is shown in Figure 14-c. 445
The isosurface volume fraction of liquid γ = 0.5 is also shown in black to represent the location of the 446
leading edge of the liquid relative to the vortical structures. 447
448 449
Figure 14. Starting vortex at the start of penetration; image a shows shadowgraphy result; images b and c depict the
450
CFD results at 2 µs ASOP. Image b shows the starting vortex through the centralized cut plane, colored by air density
451
range. Image c shows the Q-isosurface of 5 × 10¹², colored by vorticity in the z-direction, red indicates clockwise
452
rotation and blue counter clockwise rotation. The body of the injector is shown in grey and the black color shows the
453
location of the leading edge of the liquid (filtered by a liquid fraction of 0.5) relative to the vortical structures.
454
The jet and vortex propagation velocities are compared in Figure 15. Experimental values are shown 455
for 16 different double frame shots, with 1, 2 or 3 µs inter-frame time. The error bars are based on the 456
accuracy of the detection of the leading edge of the jet and the centre of the vortex. Predicted liquid and 457
vortex propagation rates are also plotted. The modelled vortex propagation rate is found by integrating 458
velocity over the Q-criterion isosurface of 5×10¹². The dip in the modelled vortex penetration rate around 459
Z/D = 0.4 corresponds to the time when the fuel leading edge reaches the vortex. It can be seen that the 460
vortex propagation rate is approximately 40% of the jet leading edge propagation rate on average. The liquid 461
propagation rate shows good agreement between experiment and model, while greater differences are seen 462
between the experimental and modelled vortex propagation rate. The source of the variation in the measured 463
a b
vortex c
Air Density (kg/m3)
40
results and the differences between the measured and modelled results are most likely due to variability in 464
the location of the air-fuel interface inside the orifice prior to injection. 465
466
Figure 15. Experimental measurements of penetration velocity for the jet leading edge and the starting vortex at a
467
different distance from nozzle hole exit.
468
3.4.2.2 Effects of cavitation and in-nozzle turbulence on spray development 469
The computed spray structure at various times ASOP is illustrated in Figure 16. In the left column (a-470
f), the fluid in the sac and nozzle is colored by velocity magnitude and the 0.5 liquid volume fraction 471
isosurface in the chamber is colored by turbulent kinetic energy. In the right column (g-l), turbulent 472
structures are depicted using the Q-criterion isosurface of 5×10¹² colored by vorticity magnitude (for a 473
clearer presentation, high value 2×10⁸ of vorticity at the sharp edged nozzle hole inlet has been excluded). 474
0 20 40 60 80 100
0 1 2
P
enet
rat
ion V
el
oc
it
y
(
m
/s
)
475
Figure 16. Evolution of in-nozzle and jet liquid-gas turbulent structures at different times ASOP. In the left column
476
(image a-f), in-nozzle flow is colored by velocity magnitude; liquid-gas isosurface of 0.5 at the spray chamber is
477 a
b
c
d
e k
j i h g
f
l 12 µs
13 µs
14 µs
15 µs
21 µs
27 µs
TKE Velocity (m/s)
colored by Turbulent Kinetic Energy (TKE). In the right column at corresponding times (image g-l), the development
478
of turbulence is illustrated using Q-isosurface of 5×10¹², colored by vorticity magnitude (for a clearer presentation, the
479
high value of vorticity of 2×10⁸ at the sharp edged nozzle hole inlet has been excluded).
480
At 12 µs ASOP, Figure 16-a, g, toroidal streamwise waves are apparent at the gas-liquid interface in 481
the vicinity of the nozzle exit. These waves are also apparent as coherent toroidal structures in the Q-plot. 482
The jet leading edge velocity is 105 m/s and the velocity at nozzle exit is 198 m/s corresponding to a 483
Reynolds Number of 9930 and 18720, respectively. These streamwise waves could be potentially generated 484
due to either Kelvin-Helmholtz instability or 2D Tollmien-Schlichting instability as recently reported by 485
Shinjo et.al [72]. The turbulence generated primarily at the sharp nozzle inlet but also in the boundary layer 486
develops with an increase in nozzle velocity. Cavitation onset occurred at 11 µs ASOP. 487
Experimentally, the streamwise waves were difficult to capture in the image due to the obscuration of 488
the jet surface by the cloud of fine droplets generated in the early stages of injection. In Figure 17, a 489
streamwise surface waveform is just apparent on the top edge near the edge of the obscuring outer cloud of 490
fine droplets. 491
492
Figure 17. Experimental image of a spray near the nozzle using a diffuse sidelight imaging technique. A streamwise
493
surface waveform is just apparent on the top edge near the edge of the obscuring outer cloud of fine droplets.
At 13 µs ASOP, Figure 16-b, h, the vapor cavities are developing and extending downstream inside the 495
orifice, moderating the turbulence generated at the nozzle entrance and in the boundary layer. The influence 496
of detachment can be seen in Figure 16-b This is due to the increase in velocity at the nozzle entrance 497
(extension of yellow color further downstream of the nozzle) as a result of the reduction in cross-sectional 498
area, similar results are reported by Dumont et al. [73], Desantes et al. [74], and Benajes et al. [75]. The 499
developing in-nozzle turbulence is characterized by apparent streamwise, stretched vortices upstream of the 500
nozzle exit. The toroidal streamwise waves on the jet are increasing in amplitude, possibly due to the 501
increased upstream flow velocity. The disintegration of these waves tends to occur closer to the nozzle exit 502
as the jet accelerates. 503
At 14 µs ASOP, Figure 16-c, i, the amplitude of the toroidal streamwise waves further increases. In-504
nozzle vortical structures have not yet reached the chamber. Onset, growth, and disintegration of the 505
streamwise toroidal waves continues to occur closer to the nozzle exit as the jet accelerates. Figure 18 shows 506
the liquid volume fraction isosurface of 0.5, colored by the velocity magnitude at 13.9 µs ASOP. Instabilities 507
form on the emerging jet, and then develop into surface waves ultimately breaking up with downstream 508
propagation. The zoomed views, 0.1 µs apart, show a typical ligament and its subsequent breakup into 509
droplets, as part of the process of surface wave breakup. It can be seen that irregularities on the trailing edge 510
of the umbrella play a significant role in the disintegration process. The separation of filaments from the 511
trailing edge of the jet tip and their fragmentations lead to the generation of large droplets at the early stage 512
of injection. An animation of the surface wave development between 12 ASOP and 15 ASOP is given in the 513
supplementary material. It demonstrates the propagation of the toroidal streamwise waves in the downstream 514
516
Figure 18. A view of surface instabilities forming surface waves that break up with their downstream propagation,
517
filtered by the liquid volume fraction isosurface of 0.5, colored by velocity magnitude at 13.9 µs ASOP. The separation
518
of filaments from the trailing edge of the jet tip and their fragmentation are apparent. The zoomed-in views show the
519
breakup of a filament between 13.9 µs (b), and 14 µs (c) ASOP.
520
At 15 µs ASOP, Figure 16-d, j, the impact of cavitation lowering the turbulence level at the nozzle 521
entrance can be clearly seen in the Q criterion plot, about 2 nozzle diameters downstream of the nozzle 522
entrance. Further downstream, longitudinal vortical structures formed earlier emerge from the nozzle exit 523
coinciding with the appearance of spanwise longitudinal waves on the jet surface near the nozzle exit. By 524
15 µs the coherent toroidal streamwise waves have disappeared, replaced by hairpin vortices at 16 µs. 525
At 21 µs ASOP, Figure 16-e, k, the vapor cavities have extended to the middle of the nozzle where a 526
distinctive decrement in the jet velocity is apparent. Much greater disintegration of the jet occurs at this stage 527
corresponding to the influence of the in-nozzle turbulence creating surface disturbances that promote 528
instability and breakup. The Q criterion visualization, Figure 16-k, shows the growth in the thickness of the 529
shear layer (mixing zones) about the jet periphery and umbrella shaped leading edge. 530
At 27 µs ASOP, Figure 16-f, l, the nozzle cavity reaches the nozzle exit and hydraulic flip ensues. In-531
nozzle turbulence production is significantly reduced with jet detachment from the nozzle sharp entrance no 532
longer being affected by the nozzle wall. Turbulence production, however, remains due to flow contraction 533
at nozzle entrance as apparent from the Q criterion visualization. The jet flow contraction associated with 534
a
b
c
Velocity (m/s)
flow detachment at the nozzle entrance creates a momentary velocity decrease as shown in Figure 16-l. 535
Beyond this stage, the jet approaches the quasi-steady stage with surface breakup rapidly commencing 536
within a diameter from the nozzle exit. 537
The spatial distribution of droplet size and Weber number of each droplet outside the nozzle at the 538
quasi-steady stage for the fine mesh resolution is shown in Figure 19. The 3D surface is constructed based 539
on the location and diameter of all droplets colored by their Weber number. At the edge of the jet, the 540
droplet sizes are small and Weber numbers are large due to the high velocity of droplets just separated from 541
the liquid core. The droplet sizes increase with increasing streamwise and radial distances as the velocities 542
and Weber numbers decrease. Each peak on the surface is an individual droplet (2700 in total) from which 543
the volumetric concentration can be seen to decrease with increasing streamwise and radial distances. 544
545
Figure 19. The spatial distribution of droplet size and Weber number of each droplet outside the nozzle at the
quasi-546
steady stage for the fine mesh (20 million cells). The 3D surface is constructed based on the location and diameter of
547
all 2700 droplets and colored by their Weber number. The Weber number of each droplet is calculated based on the
548
density of droplet (Wel) and the density of gas (Weg). It can be seen that the droplet sizes increase with increasing
549
streamwise and radial distances as the velocities and Weber numbers decrease.
550
3.5 Shock Waves 551
By 27 µs ASOP, shock waves begin to appear in both the experimental and modelled results. The 552
initiated at the nozzle entrance extend to the full nozzle length and become ventilated with the chamber gas. 554
This may be a coincidence but both are the result of increased nozzle exit velocity as the needle lift increases 555
and the sac pressure builds towards its maximum value. 556
Figure 20 shows the experimental and computed images at the onset of shock waves and beyond. The 557
first column (images a and b) shows the montaged images of shock waves edges, extracted using an edge 558
detection algorithm in MATLAB, superimposed on the experimental results. The second column (images c 559
and d) illustrates the numerical results. The white areas represent cells which have a liquid fraction greater 560
than 0.1. Image (a) at 27 µs ± 2 µs ASOP shows the first signs of the onset of shock waves, while image (b) 561
at 37 µs ± 2 µs, shows further development of shock waves than the image (a). Each of these images is 562
obtained from separate shots. Numerous shots confirm the onset of shock waves at about 27 µs ASOP. The 563
timing technique used here is explained in section 2.1. The shock waves at the time of onset are seen to be 564
most marked near the nozzle exit where the jet surface velocity is the highest. The numerical results 565
presented in the image (c) show the onset of shock waves at essentially the same time ASOP and over a 566
similar spatial extent to the measurements. An increase of about 15-25% of the air density at each shock 567
wave front can be seen in images (c) and (d). 568
569
Air Density (kg/m3)
30 60
a
b d
Figure 20. The onset of shock waves. The frames a and b (first column) are the montaged experimental images and an
570
edge detection procedure applied to the experimental results. The frames c and d, second column, illustrate the
571
numerical results at 27 µs, and 37 µs ASOP, respectively. The white areas represent cells which have a liquid fraction
572
greater than 0.1. The density range is adjusted to highlight the shock waves.
573
The method used for measurement of the interfacial velocity is similar to that employed by Hillamo et 574
al. [34]. It is assumed that the shock waves are initiated at disturbances on the interface between the liquid 575
jet and the chamber gas where the interface velocity exceeds the local speed of sound. The Mach number, 576
Ma of the jet interface may be derived from the angle of the shock wave relative to the interface, α, from the 577
relation Ma = 1/Sin α. Ma is defined as the ratio of the interface velocity to the local speed of sound in the 578
gas phase [76]. The local speed of sound in the chamber gas at the test conditions of 298 K and 30 bar is 579
about 348 m/s. The Ma applicable to each shock wave in the experimental images is calculated and the 580
results are shown in Figure 21 and 22 against axial distance from the nozzle. Errors involved in the shock 581
waves angle measurement basically originate from the method applied for drawing each line of the angle. 582
One line of this angle indicates the interfacial surface of liquid-air and another line is the shock wave 583
tangent. The main error in this measurement corresponds to the averaging approach used to draw the edge 584
representing the interfacial surface. The value of this error decreases further downstream as the deviation of 585
the averaged line from exact interfacial edge diminishes due to the lesser interface instabilities. Figure 21 586
shows data for various times ASOP during the spray transient, while Figure 22 shows data for a single shot 587
during the quasi-steady stage (Pinjection = 1200 bar). 588
For comparison with the experimentally derived interface velocity, the computed interface velocity is 589
extracted from the outer isosurface of the jet with 0.5 liquid fractions. This interface velocity is also plotted 590
in Figure 21 and 22. For the numerical results, the location of the shock waves imaged in Figure 20 591
correspond to peaks of computed interface velocity in excess of Ma = 1 shown in Figure 21. At 27 µs ASOP, 592
the Ma of three experimentally imaged shock waves, shown in Figure 20a, are measured and plotted in 593
Figure 21. At 32 µs ASOP, the number of shock waves captured increased which is evidence of an increase 594
downstream for experimental and numerical results respectively. At 37 µs ASOP, an increase in the number 596
and extent of the shock waves is captured both in the experimental and numerical results. 597
The main source of deviation between experimental and numerical results could be related to not only 598
the different calculation method but also the accuracy of the experimental shock wave capturing technique 599
which employed backlit imaging. This technique suffers from obscuration by the cloud of fine droplets 600
surrounding the spray. 601
602
Figure 21. Experimental and numerical liquid-gas interface Mach number against axial distance from the nozzle exit,
603
at various times ASOP. As the jet accelerates, the number of shock waves increases. The jet velocity has not yet
604
reached steady stage.
605
As shown in Figure 8, sometime after the opening transient, at around 45 µs ASOP, the modelled 606
nozzle exit velocity approaches the quasi-steady stage. At this stage, the shock waves are captured furthest 607
downstream as demonstrated in Figure 22. The numerical jet interface velocity is high enough to generate 608
the shock waves all the way downstream. Based on the jet diameter and liquid density, Weber number of the 609
liquid-gas interface (Wel) is calculated, varying from 0.5×10⁶ to 2×10⁶. The fluctuation in the jet interface 610
0.0 0.2 0.4 0.6 0.8 1.0 1.2 1.4
0 1 2 3 4 5 6 7 8
Ma
Dimensionless Axial Distance (Z/D)