Article 1
Ventilation positive pressure intervention effect on
2IAQ in a school building with moisture problems
3Camilla Vornanen-Winqvist1,*, Kati Järvi1, Sander Toomla1, Kaiser Ahmed1, Maria A. 4
Andersson1, Raimo Mikkola1, Tamas Marik2, Laszlo Kredics2, Heidi Salonen1, Jarek Kurnitski1, 3 5
1 Aalto University, Department of Civil Engineering, Rakentajanaukio 4, 02150 Espoo, Finland; 6
firstname.lastname(at)aalto.fi 7
2 University of Szeged, Department of Microbiology, Közép fasor 52, H-6726 Szeged, Hungary; 8
3 Tallinn University of Technology, Ehitajate tee 5, 19086 Tallinn, Estonia; firstname.lastname(at)ttu.ee 10
* Correspondence: [email protected]; Tel.: +358-50-347-2755 11
Abstract: This case study investigates the effects of ventilation intervention on measured and 12
perceived indoor air quality (IAQ) in a repaired school where occupants reported IAQ problems. 13
Occupants´ symptoms were suspected to be related to the impurities leaked indoors through the 14
building envelope. The study’s aim was to determine whether a positive pressure of 5-7 Pa prevents 15
the infiltration of harmful chemical and microbiological agents from structures, thus decreasing 16
symptoms and discomfort. Ventilation intervention was conducted in a building section comprising 17
12 classrooms and was completed with IAQ measurements and occupants´ questionnaires. After 18
intervention, the concentration of total volatile organic compounds (TVOC) and fine particulate 19
matter (PM2.5) decreased, and occupants´ negative perceptions became more moderate compared to 20
those for other parts of the building. The indoor mycobiota differed in species composition from the 21
outdoor mycobiota, and changed remarkably with the intervention, indicating that some species 22
may have emanated from an indoor source before the intervention. 23
Keywords: ventilation; positive pressure; indoor air quality; mycobiota; indoor air questionnaire; 24
moisture damage 25
26
1. Introduction
27
The success of moisture- and mold-damaged building repairs depends on many factors. 28
Reaching a consensus about the necessary repair methods and schedule is not always simple, and 29
responding to problems might therefore be delayed. Occupants´ symptoms and discomfort can have 30
multiple causes, and detecting or treating them all is not always possible nor successful [1]. In cases 31
where harmful impurities remain in the structures or crawlspaces after repairs, indoor air problems 32
might still occur. It has been shown that negative pressure indoors may introduce harmful pollutants 33
[2], e.g. fungal spores [3], which may cause adverse health effects among occupants [4]. Preventing 34
infiltration of the possible impurities from the structures or surroundings, caused by high negative 35
pressure, is crucial for maintaining a good indoor air quality (IAQ). In moisture damage repairs, a 36
thorough renovation, including ventilation, is important [5]. 37
Ventilation is strongly associated with perceived IAQ, health, and productivity [2,6]. Ventilation, 38
as well as indoor temperature and humidity, have a significant impact on human perceptions and 39
well-being [7,8]. Proper ventilation measurements should be an essential part of every IAQ 40
investigation [9]. In air-tight buildings with a mechanical ventilation system, the balancing and 41
controlling of the ventilation system and pressure differences are inevitable [10]. When evaluating 42
the effect of ventilation on perceived IAQ, pressure difference measurements are important [11]. 43
In cold-climate countries, keeping structures dry is a main issue, and ventilation design is 44
strongly related to this objective. According to the National Building Code of Finland [12], pressure 45
conditions should not generate moisture load to structures and, at the same time, not assist pollutant 46
transfer through the structures. A ventilation design is typically balanced, or the extract airflow rate 47
is slightly higher than the supply, to prevent exfiltration of moist indoor air into the structures. 48
However, in well-ventilated buildings, the indoor air is often dry, and school buildings are typically 49
occupied only during normal office hours. In such buildings, the risk for condensation is improbable 50
despite the pressure conditions. 51
This ventilation intervention study was conducted as part of the Finnish EURA- and TOXICPM 52
-research projects concerning IAQ and ventilation in renovated school buildings and microbial toxin 53
transport mechanisms. The building discussed in this study has a history of moisture damage repairs, 54
yet occupants still report IAQ-related symptoms and discomfort. The building is awaiting new major 55
repairs. Our main hypothesis is that positive pressure differences across the building envelope could 56
prevent the infiltration of harmful chemical and microbiological agents into the indoor air of 57
damaged structures, thus decreasing occupants´ perceptions of symptoms and discomfort. 58
The aims of our research project were to determine the effects of significant ventilation system 59
changes on measured and perceived IAQ in a school building with unsolved indoor air-related 60
problems, and to provide information about the applicability of moderate positive pressure in a well-61
ventilated building awaiting repairs. To test the hypothesis, chemical, microbial, and physical IAQ 62
measurements, as well as occupant questionnaires, were conducted before and after ventilation 63
system intervention. 64
2. Materials and Methods
65
2.1 Building characteristics
66
The study was carried out in a comprehensive school in Vantaa, Southern Finland. The school 67
was selected in cooperation with Vantaa Real Estate Center in the spring of 2016, based on its repair 68
history and the fact that a reasonable and controllable part of the building could be isolated for 69
implementing the positive pressure intervention without major ventilation system changes in the 70
building. Several microbial and structural investigations have been made since 2004, and the building 71
has experienced extensive moisture damage, air leakage, and ventilation system repairs during 72
previous years. Yet IAQ-related or unspecific complaints from the occupants have continued. New 73
structural repairs to the whole building have taken place since summer 2017. 74
The school was built in 1968 and fully renovated in 2003–2005. Approximately 700 students and 75
over 50 staff members work in the building. The mechanical supply and extract ventilation system 76
with heat recovery in all classrooms and corridors was installed in 2002. Each classroom has 2-3 77
supply air duct diffusers and 1-2 extract air grilles. Airflow rates are adjusted by dampers in the main 78
air handling unit and with regulation and measuring devices connected to each terminal device. The 79
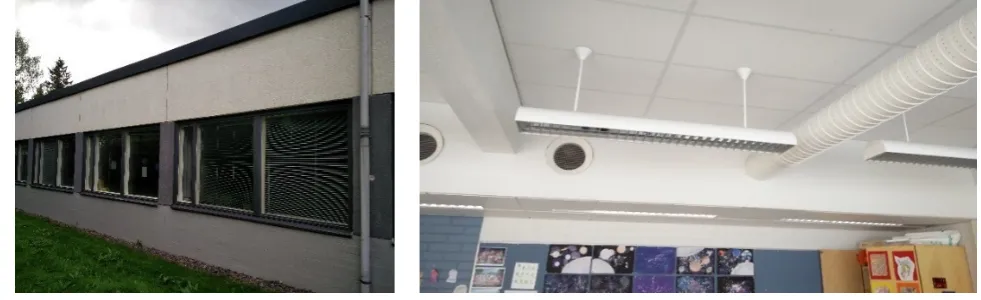
studied section of the building as seen from the outside, and the typical supply and extract terminal 80
units of a classroom in the section, are shown in Error! Reference source not found.. 81
82
Figure 1. Studied building section, a typical supply air duct diffuser, and an extract air grille in a 83
The studied part of the building consists of 12 classrooms, one corridor, six toilets, and a cleaning 85
storage area, and was served by one air handling unit. Most of the classrooms are occupied by 20–25 86
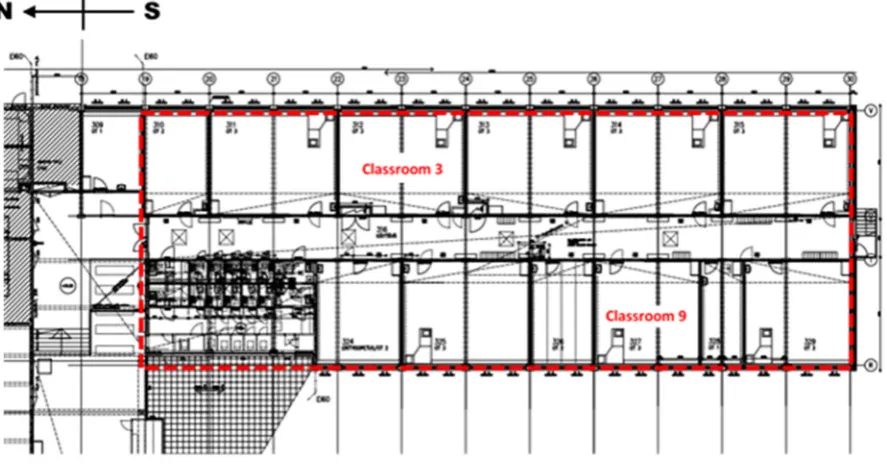
humans for a few hours per day during the normal five-day school week. The layout of the studied 87
part of the building and its orientation are presented in Error! Reference source not found.. 88
89
Figure 2. The ventilation intervention was conducted in the building section marked with red. 90
Measurements were carried out in Classrooms 3 and 9. 91
2.2 Previous investigations 92
Due to the prolonged IAQ-related complaints in the building, an indoor climate and structural 93
investigation (report August 24 2016 handed over to the Real Estate Center of the City of Vantaa) was 94
conducted in the whole building by a certified consultant company, Sweco Finland Oy, during April 95
2016 [13], prior to this ventilation intervention research project. 96
In the base floor tracer gas investigations, the air was found to infiltrate the room via wall/floor 97
junctions and service entries, and the investigated classroom had negative pressure in relation to the 98
ground filling. In outer wall tracer gas investigations, air leakages were found in the wall/floor 99
junctions, window/wall junctions, and the supports for radiators and windowsills. 100
In the surface humidity detection of floorings, high humidity was detected widely in the studied 101
building section, especially in the whole corridor area. In the cut measurement in Classroom 3, the 102
relative humidity (RH) under the flooring was normal: 28 %. In drill hole measurements of the 103
concrete slab, high humidity was measured at all eight measurement spots (corridor and classrooms), 104
with an RH between 87–95 %. Simultaneous volatile organic compound (VOC) measurements in 105
Classroom 3 did not suggest material deterioration (TVOC: 5 µg/m3, 2-ethyl-1-hexanol (2E1H): 1 106
µg/m3). However, it was recommended that the surface flooring be replaced with a more permeable 107
material to avoid future problems. 108
In Classroom 3, the structures were opened for investigation. It was found that the outer wall 109
structure did not follow the correct building design, i.e. the inner brick layer was covered by 110
insulation and a vapor-tight concrete layer, which could lead to vapor condensation during the cold 111
season. Material samples for microbiological analysis were taken from the structure’s opening. 112
Microbial growth (fungi and bacteria) was found in the wooden structures of the window-frame 113
fastening (Table 1). Actinobacteria and Exophiala* sp., which are indicators of moisture damage, were 114
been exposed to moisture and damaged because of incorrect building design. Microbial assessment 116
of indoor air did not show increased microbial levels or moisture indicator microbes. 117
Table 1. Microbial growth in outer wall structures of Classroom 3 [13]. 118
119 * 120
Indicator for moisture damage 121
** Below the definition limit 100 cfu/g 122
The investigation concluded that impurities from microbially damaged materials possibly 123
infiltrate indoor air, and might comprise a health risk. Infiltrations are caused by air leakages and 124
negative pressure, which is highest at night. Extensive structural repairs are needed in the lower parts 125
of the outer wall to improve the building design as well as seal the air leakage routes. 126
2.3 Set-up for ventilation intervention 127
The ventilation intervention was conducted in four phases: (a) airflow rates in the rooms were 128
measured to determine the initial state of the ventilation; (b) the air distribution ductwork was fully 129
balanced by an authorized company; (c) the air handling unit´s supply and extract fan speeds were 130
adjusted to generate the desired 5-7 Pa positive pressure over the building envelope in each 131
classroom; and (d) airflow rates in the rooms were re-measured after a setting period, and pressure 132
differences over the envelope were monitored during the entire set-up. Positive pressure was 133
maintained in the studied building section fairly well over the winter season, from August 2016 to 134
May 2017. 135
The aim of generating low 5-7 Pa positive pressure was to prevent potential infiltration by 136
harmful agents and avoid strong exfiltration of indoor air. In this ventilation intervention, it was 137
possible to establish a positive pressure in the building by balancing the ventilation system and by 138
adjusting fan speed control frequency in the air handling unit. 139
Related IAQ measurements were conducted simultaneously with phases (a) and (d). Occupant 140
perceptions were recorded, and microbial samples collected before the intervention and after five 141
months of positive pressure. Moisture behavior of the structures during the positive pressure period 142
was monitored, and will be reported in another journal article. 143
2.4 Measurement methods 144
Some of the measurements were conducted in the entire building section under study; others 145
were conducted in only the two classrooms with the most significant IAQ-related complaints from 146
the occupants: Classrooms 3 and 9. The measured factors and measurement devices are presented in 147
Error! Reference source not found.. 148
Room Place Date Fungi (cfu/g) Bacteria
(cfu/g)
Actinobacteria (cfu/g)
Classroom 3 Outer
wall, window frame fastening wood
April 2016
170 000 Aureobasidium sp., Mucor sp., Penicillium sp., yeast, sterile
1 400 000 < 100**
Classroom 3 Outer
wall, mineral wool in the plinth cut
April 2016
8 000
Exophiala* sp.
100 29 000*
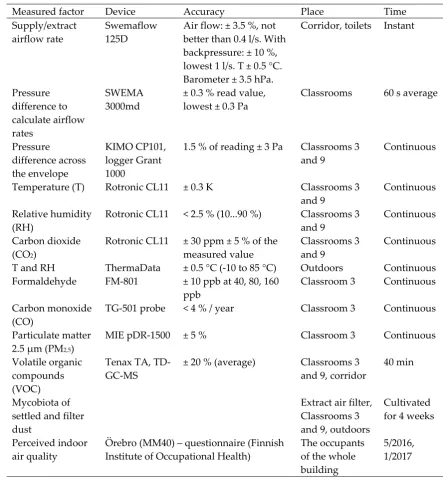
Table 2. Measurement methods and devices. 149
Measured factor Device Accuracy Place Time
Supply/extract airflow rate
Swemaflow 125D
Air flow: ± 3.5 %, not better than 0.4 l/s. With backpressure: ± 10 %, lowest 1 l/s. T ± 0.5 °C. Barometer ± 3.5 hPa.
Corridor, toilets Instant
Pressure difference to calculate airflow rates
SWEMA 3000md
± 0.3 % read value, lowest ± 0.3 Pa
Classrooms 60 s average
Pressure
difference across the envelope
KIMO CP101, logger Grant 1000
1.5 % of reading ± 3 Pa Classrooms 3 and 9
Continuous
Temperature (T) Rotronic CL11 ± 0.3 K Classrooms 3
and 9
Continuous
Relative humidity (RH)
Rotronic CL11 < 2.5 % (10...90 %) Classrooms 3 and 9
Continuous
Carbon dioxide (CO2)
Rotronic CL11 ± 30 ppm ± 5 % of the measured value
Classrooms 3 and 9
Continuous
T and RH ThermaData ± 0.5 °C (-10 to 85 °C) Outdoors Continuous
Formaldehyde FM-801 ± 10 ppb at 40, 80, 160
ppb
Classroom 3 Continuous
Carbon monoxide (CO)
TG-501 probe < 4 % / year Classroom 3 Continuous
Particulate matter 2.5 µm (PM2,5)
MIE pDR-1500 ± 5 % Classroom 3 Continuous
Volatile organic compounds (VOC)
Tenax TA, TD-GC-MS
± 20 % (average) Classrooms 3 and 9, corridor
40 min
Mycobiota of settled and filter dust
Extract air filter,
Classrooms 3 and 9, outdoors
Cultivated for 4 weeks
Perceived indoor air quality
Örebro (MM40) – questionnaire (Finnish Institute of Occupational Health)
The occupants of the whole building
5/2016, 1/2017
2.4.1 Airflow rate measurements and pressure differences across the building envelope 150
Airflow rates were measured from each ventilation duct terminal unit in every room and in the 151
corridor in the studied building section before and after balancing the ventilation, and after 152
generating the positive pressure. Pressure differences across the building envelope were measured 153
continuously for one week before the ventilation intervention and for nine months in Classrooms 3 154
and 9 after generating the positive pressure. A plastic tube with a copper core was placed outside by 155
a window that was not normally open. A measurement device and the logger were placed inside near 156
the window. The outdoor temperature was monitored simultaneously. 157
2.4.2 Temperature, relative humidity, and CO2 concentration of indoor air 158
Temperature, relative humidity, and CO2 concentrations were measured in Classrooms 3 and 9 159
intervention. Measurement devices were placed on the teacher’s desk, away from the teacher’s 161
breathing zone when seated and as close to the central area of the room as possible. 162
2.4.3 Indoor air quality (IAQ) measurements 163
VOCs were measured in Classrooms 3 and 9 and in the corridor before and after the ventilation 164
intervention. The total amount of volatile organic compounds (TVOC) and single compounds that 165
had concentrations over 1 µg/m3 were analyzed. The VOC sampling and analyses were carried out 166
according to (ISO 16000–6) standard. Air samples were taken from the middle of an empty, closed 167
room, in the central area of the room, or in the main working zone at a height of 1.5 m. The samples 168
were collected during school working hours. Air samples were collected in Markes International Ltd 169
(Llantrisant, UK) stainless steel tubes packed with Tenax TA (60/80 mesh) using GilAir Plus air 170
sampling pumps (Sensidyne, St. Petersburg, USA) at a flow rate of 200 mL/min for 40 min. 171
The samples were desorbed using a thermal desorption unit, TD-100 (Markes International Ltd, 172
Llantrisant, UK) and analyzed by a gas chromatograph, Clarus 580 (Perkin-Elmer Ltd., Beaconsfield, 173
UK), equipped with a Clarus 600T (Perkin-Elmer Ltd., Beaconsfield, UK) mass selective detector. The 174
VOCs were quantified by the scan (50–400 m/z) mode. Concentrations of TVOC and individual 175
compounds were determined from TVOC area (n-hexane to n-hexadecane) and calculated as toluene 176
equivalents. Concentrations of single compounds were also determined from the chromatogram 177
before and after the TVOC area. In the case of such compounds, the quantitative result was indicative. 178
Reference compounds and the NIST 2011 Mass Spectral Library automated mass spectral 179
deconvolution and identification system (AMDIS) was used for identification. The detection limit 180
was 0.2 µg/m3 (not included in sum concentration). 181
The formaldehyde concentration of indoor air was measured using an FM-801 formaldehyde 182
meter (GrayWolf Sensing Solution, Sheldon, USA), and carbon monoxide (CO) was measured with 183
an electrochemical sensor with a TG-501 probe using an AdvancedSense meter (GrayWolf Sensing 184
Solution, Sheldon, USA). 185
Fine particulate matter (PM2.5) was measured using an MIE pDR-1500 (Thermo Fisher Scientific, 186
Franklin, MA, USA) nephelometer equipped with a PM2.5 size-selective inlet cyclone. Formaldehyde 187
and PM2.5 were measured continuously for a one-week period before and after ventilation 188
intervention, while CO was measured for a one-week period after the intervention, in Classroom 3. 189
Formaldehyde, CO, and PM2.5 measurement devices were placed in the back of the room, at a 190
height of 1.5 m, as close to the central area of the room as possible. Inviolability of the devices had to 191
be considered since the measurements were carried out for several days in a room occupied by 192
children. 193
2.4.4. Characterization of the mycobiota in the indoor dust 194
The mycobiota of indoor dust was collected from the studied building section´s extract air filter, 195
as well as from the settled dust collected from Classrooms 3 and 9. Reference dust was collected from 196
the outdoor air. Characterization of the mycobiota was accomplished in three stages: 197
1. Sampling of dust from the extract air filter, air, and surfaces above floor level. 198
Material samples from the extract air filter were collected in sterile plastic bags. Pieces of the 199
filter material (ca. 1 cm x 1 cm) were spread on malt extract agar plates (MEA, Sharlab, Spain; agar: 200
Amresco, USA, malt extract 15 g and agar (Ohio, USA) 12 g in 500 mL of H2O). Dust samples were 201
wiped with a clean plastic bag (Minigrip) from ca. 30 x 30 cm2 surfaces 1-2 m above floor level. The 202
dust (ca. 10 mg) was spread with a sterile cotton swab on MEA plates. Air samples were collected 203
with MEA fallout plates that were kept open for an hour. MEA culture plates were inoculated, sealed, 204
and cultivated at 22 °C for four weeks. 205
2. Rapid toxicity screening of single colonies with boar sperm and somatic cell lines. 206
For initial toxicity screening, 10–20 mg of biomass (wet wt) from each colony of the original 207
culture plates was looped into 0.2 ml of ethanol and heated in a water bath for 10 min at 80 °C. The 208
obtained ethanolic lysates were exposed to porcine spermatozoa and kidney tubular epithelial cells 209
vol% decreased boar sperm motility or 5 vol% decreased proliferation of PK-15 cells by > 50 % 211
compared to the sham exposed control. Boar sperm motility inhibition assay (BSMI) measuring 212
motility inhibition (i.e. inability to respond to induction of motility in resting sperm cells exposed for 213
one day at room temperature) is described in [15]. The inhibition of cell proliferation (ICP) assay with 214
PK-15 cells and the determination of EC50 concentrations followed the methods described by [16]. The 215
colonies that displayed toxicity were streaked pure and identified to genus or species level. 216
3. Characterization and identification of the fungal isolates. 217
Fungal colonies were grouped into 12 morphotypes based on colony morphology on MEA, 218
ability to grow at 37 °C, light microscopy of the conidia and conidiophores, and responses in the two 219
toxicity assays, BMSI and ICP. The isolates were compared to the identified strains from our strain 220
collection, HAMBI, or identified according to [17]. Representatives for the morphotypes were 221
identified according to their ITS sequences [18]. 222
2.4.5 Indoor air questionnaire 223
Occupants´ indoor air-related symptoms and discomfort were recorded with the standardized 224
Indoor Air Questionnaire of the Finnish Institute of Occupational Health (FIOH) twice during the 225
research. The questionnaire was based on the Örebro Indoor Climate Questionnaire MM40 [19,20]. 226
The questionnaire consists of four different foci: (1) the work environment; (2) the work 227
arrangements; (3) the employees’ allergy history; and (4) work-related symptoms. The questionnaire 228
asked the respondents to recall environmental problems (draft, dry or stuffy air, etc.) that had 229
occurred during the past three months. 230
Staff members of the whole school were requested to participate in the questionnaire, and the 231
principal of the school arranged for the delivery of the questionnaires at the workplace. Staff 232
members had two weeks to respond to the questionnaire. FIOH collected and reported the answers. 233
Potentially significant differences between the two questionnaires were analyzed at Aalto 234
University by the SPSS statistical program, with a chi-squared test. The main interest was to 235
determine whether symptoms supposedly related to impurities from the structures could be reduced 236
by converting infiltration to exfiltration in the studied building section. 237
3. Results and discussion
238
3.1 Airflow rate measurements and pressure differences across the building envelope 239
Total airflow rates before and after the ventilation intervention are shown in Table 2. 240
Table 2. Supply and extract airflow rates before ventilation balancing, after balancing, and after 241
generating positive pressure. 242
Air flow rates [L/s]
Designed Measured before balancing 30.5.2016
Measured after balancing 22.7.2016
Measured after overpressure 2.9.2016
Room Supply /
extract
Supply Extract Supply Extract Supply Extract
1 135/135 146 189 134 135 139 125
2 270/270 313 359 273 273 287 255
3 270/270 273 348 268 265 278 247
4 270/270 301 368 271 271 291 305
5 270/270 283 341 263 264 273 269
6 270/270 259 298 271 271 276 259
7 220/220 141 287 204 202 203 188
8 80/80 126 118 65 62 65 65
9 215/215 215 262 213 216 219 214
10 135/135 133 149 136 134 143 139
11 270/270 289 279 265 264 284 277
Classroom total 2585/2585 2655 3230 2538 2532 2636 2510
Cleaning storage -/30 13 30 31
WC 1 -/30 10 30 32
WC 2 -/30 11 30 30
WC 3 -/30 13 30 36
WC 4 -/30 15 30 34
WC 5 -/30 17 30 30
WC 6 -/30 17 30 30
Corridor 320/110 330 90 329 114 303 79
TOTAL 2905/2905 2984 3415 2867 2856 2938 2812
243
Before balancing, the airflow rates were found to be heavily unbalanced in most classrooms, as 244
well as in the corridor and the toilets. According to Finnish regulations, the acceptable deviation at 245
room level and system level is 20 % and 10 %, respectively. At classroom level, the supply airflow 246
rates were within +/- 20 % of the designed values, with two significant exceptions of -36 % and +57 247
%. Almost all the classrooms had extract airflow rates over 20 % higher than the designed values. The 248
corridor extract was 18 % lower than the designed values. The extracts from the toilet and storage 249
units were 55 % lower than the designed values, which was found to be caused by the wrong rotation 250
direction of the fan. At a system level, the total extract airflow rate was 18 % higher than the designed 251
values. After generating the positive pressure, all classrooms received more supply than extract air. 252
Airflow rates were measured as spot checks from some classrooms in spring 2017, and had been 253
maintained at the required level. 254
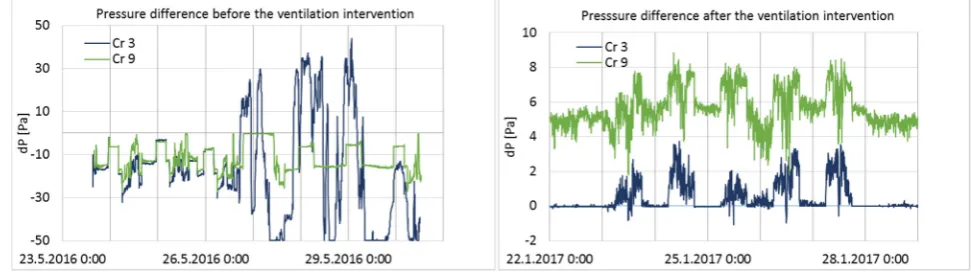
Pressure differences across the building envelope from one week before and after the 255
intervention in Classrooms 3 and 9 are shown in Figure 1. 256
257
Figure 1. One-week pressure difference across the building envelope in Classrooms 3 and 9 before 258
and after the ventilation intervention. 259
Before the ventilation balancing, pressure differences fluctuated within a large range during a 260
one-week period, and both measured rooms had a significant level of negative pressure. It should be 261
noted that the prolonged readings of -50 Pa could also have been caused by mistreating the 262
measurement devices in Classroom 3. After the ventilation balancing, the pressure differences across 263
the envelope were moderately stable and positive, and fluctuation was minimal compared to the 264
conditions before the intervention. Pressure differences over the entire ventilation intervention 265
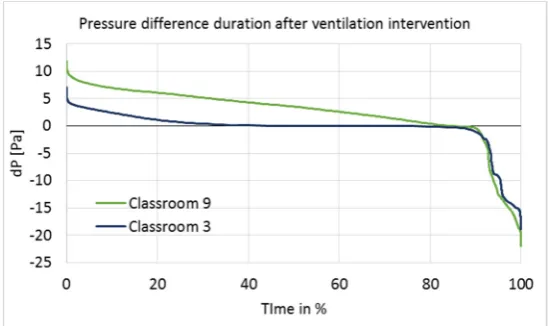
period are shown as cumulative frequency curves (duration curves) in Error! Reference source not
266
268
Figure 2. Duration of pressure differences across the envelope in Classrooms 3 and 9 during nine 269
months after ventilation intervention. 270
Positive pressure was maintained rather well in Classroom 9, but poorly in Classroom 3. In 271
Classroom 9, the pressure difference was at the optimal level of 5-7 Pa for 23 % of the measurement 272
time, and over 0 Pa for 84 % of the time. In Classroom 3, it was over 0 Pa for 45 % of the time; thus, 273
most of the time, Classroom 3 had a pressure difference very close to 0. 274
According to the set-up design, positive pressure should have been maintained continuously 275
throughout the entire intervention period. However, the results showed that the ventilation system 276
was turned off at night by the school maintenance or by the automatic remote-control system during 277
school holidays; it was also turned off during other short-term periods for unknown reasons. The 278
longest holiday period was the Christmas holiday, between December 21, 2016 and January 7, 2017, 279
during which time the ventilation system was clearly turned off every day from 4 pm to 6 am, and 280
the pressure difference became highly negative. Negative pressure differences during that period 281
were significant (up to 18 and 22 Pa in Classrooms 3 and 9; average pressure difference 7.9 and -282
8.4 Pa), generating unwanted effects on the ventilation intervention. The building was unoccupied 283
during holiday periods; thus, pressure fluctuation did not have a direct impact on the occupants. 284
However, possible impurities inside the structures may have infiltrated indoors during those periods, 285
which would have influenced the indoor conditions and might have affected the user questionnaire 286
responses accordingly. Therefore, holiday times, especially the Christmas holiday, were not excluded 287
from the data. If the Christmas holiday period is ignored, then the pressure difference becomes 288
positive (> 0) for 46 % (Classroom 3) and 88 % (Classroom 9) of the time. 289
The measured results show an increase of positive pressure when the outdoor temperature 290
increases (Figure 3), and a corresponding decrease when the outdoor temperature drops. This has 291
provided an additional challenge for positive pressure as adjustments were done during warm 292
season. These results indicate typical phenomena of heat recovery ventilation units: During the cold 293
season, the mass flow of constant volume extract fans becomes higher because the temperature after 294
heat recovery is lower and the density of the air is correspondingly higher. At the same time, the 295
supply air fan operates at stable air temperature conditions and the mass flow does not change. To 296
avoid this phenomenon, an air handling unit with density-corrected air volume flow rate control 297
299
Figure 3. Relation between outdoor temperature and pressure difference across the envelope in 300
Classrooms 3 and 9 with air handling unit without density-corrected airflow rates. 301
In a cold climate, water vapor condensation and moisture accumulation inside structures are 302
seen as potential risks when pressure differences across the envelope are positive. To evaluate the 303
risk of condensation inside the structures, excessive moisture in Classrooms 3 and 9 was calculated 304
as the difference of measured absolute humidity of indoor and outdoor air, before the positive 305
pressure period began. To monitor the possible moisture condensation risk in the structures during 306
the ventilation intervention, T and RH probes were installed inside the structures at the most 307
probable leakage paths, as well as in a reference room. According to humidity measurements, the 308
structures were dry, indicating that this moisture risk was not present because of the modest 309
humidity load in well-ventilated classrooms [21]. 310
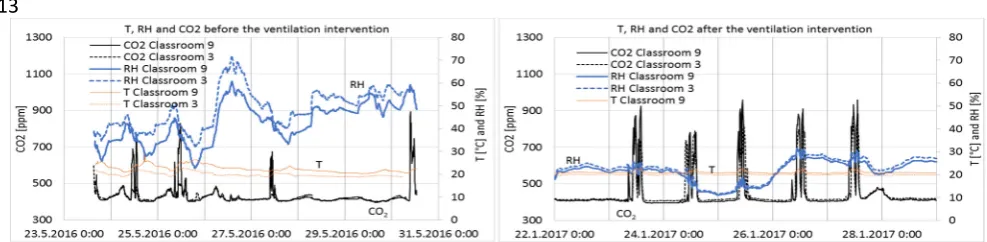
3.2 Temperature, relative humidity, and CO2 concentration of indoor air 311
Results from one week before and after ventilation intervention are shown in Figure 4. 312
313
Figure 4. Temperature, relative humidity, and CO2 concentration in Classrooms 3 and 9 one week 314
before and after the ventilation intervention. 315
The measurement results after the ventilation intervention are shown as a duration curve in Figure 5, 316
and average, minimum, and maximum values are described in Figure 5. CO2 concentration, relative 317
humidity, and temperature duration in Classrooms 3 and 9 during school´s occupancy hours, from 8 318
am to 5 pm on Mon–Fri, measured continuously from 1/2016 to 5/2017 after ventilation intervention 319
was conducted. 320
Table 3. Only results during school working hours, from 8 am to 5 pm, are shown to describe 321
323
Figure 5. CO2 concentration, relative humidity, and temperature duration in Classrooms 3 and 9 324
during school´s occupancy hours, from 8 am to 5 pm on Mon–Fri, measured continuously from 1/2016 325
to 5/2017 after ventilation intervention was conducted. 326
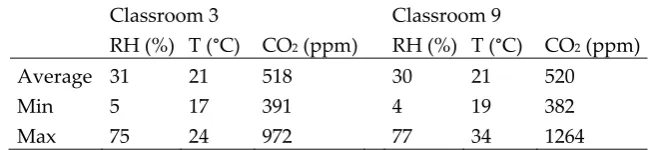
Table 3. Relative humidity, temperature, and CO2 in Classrooms 3 and 9 during school´s occupancy 327
hours, from 8 am to 5 pm on Mon–Fri, between 1/2016 and 5/2017. 328
Classroom 3 Classroom 9
RH (%) T (°C) CO2 (ppm) RH (%) T (°C) CO2 (ppm)
Average 31 21 518 30 21 520
Min 5 17 391 4 19 382
Max 75 24 972 77 34 1264
329
The maximum limit value for CO2 concentrations in Category 1 of the Finnish Classification [22] 330
is 750 ppm; the limit value in Category 2 is 900 ppm, while in Category 3 it is 1200 ppm. The levels 331
of measured values were in Category 1 and 2. Temperatures were very stable and slightly higher in 332
Classroom 9, which can be explained by the location of the room on the western side of the building. 333
The RH of the classrooms closely followed the absolute humidity of the outdoor air, i.e. values 334
are very low in cold winters and reach 75 % on summer days. In Category 1 [22], it is recommended 335
that RH should not drop for long periods below 20 %; no recommendations exist for the other 336
categories. It can be seen in Classrooms 9 and 3 that RH was below 20 % for 31 % and 26 % of the 337
school hours, respectively. Such dry air causes irritation of the respiratory tract, eyes, and skin [23]. 338
Indirectly, temperature and RH affect human perceptions of air quality and emissions from building 339
materials [24-26]. 340
3.3 Indoor air quality (IAQ) measurements 341
TVOC, VOC, formaldehyde, and CO measurement results are shown in Table 4. 342
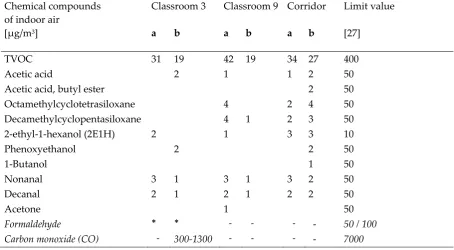
Table 4. TVOC, VOCs (concentrations over 1 µg/m3), formaldehyde, and CO before (a) and after (b) 344
ventilation intervention. 345
Chemical compounds of indoor air
Classroom 3 Classroom 9 Corridor Limit value
[µg/m3] a b a b a b [27]
TVOC 31 19 42 19 34 27 400
Acetic acid 2 1 1 2 50
Acetic acid, butyl ester 2 50
Octamethylcyclotetrasiloxane 4 2 4 50
Decamethylcyclopentasiloxane 4 1 2 3 50
2-ethyl-1-hexanol (2E1H) 2 1 3 3 10
Phenoxyethanol 2 2 50
1-Butanol 1 50
Nonanal 3 1 3 1 3 2 50
Decanal 2 1 2 1 2 2 50
Acetone 1 50
Formaldehyde * * - - - - 50 / 100
Carbon monoxide (CO) - 300-1300 - - - - 7000 (a) Sample taken 5.23.2016; (b) Sample taken 9.2.2016
346
* Below detection limit 10 ppb (̴ 12 µg/m3) 347
TVOC values decreased 21–55 % in the classrooms and in the corridor after ventilation 348
intervention. This result was statistically significant at a 95 % confidence interval (p = 0.045). Besides 349
positive pressure, no other changes were undertaken; therefore, the only known explanation for the 350
decreased concentrations is the positive pressure and infiltration mainly converted to exfiltration. 351
Concentrations were very low in general, compared to the national threshold values [27], indicating 352
good ventilation and off-gassing of materials. 353
Concentrations of single VOCs were 1-4 µg/m3, which is fairly below action level. TVOC 354
concentrations consist mainly of compounds with concentrations below 1 µg/m3. In addition to the 355
general limit value for single compounds, national limit values for the following VOCs are 2,2,4-356
trimethyl-1,3-pentanediol di-isobutyrate (TXIB) (10 µg/m3), 2E1H (10 µg/m3), naphthalene (10 µg/m3), 357
and styrene (40 µg/m3) [27]. In these samples, only 2E1H was shown, but only as low concentrations 358
from 1 to 3 µg/m3. 359
For formaldehyde, the maximum allowed value is 50 (annual average) or 100 µg/m3 (30 min 360
average), while for CO it is 7 mg/m³ (momentary concentration) [27]. The formaldehyde 361
concentration before and after the ventilation balancing was below 10 ppb (equivalent to approx. 12 362
µg/m3), which is the detection limit of the meter. After balancing, there was a concentration of 12–26 363
ppb during two hours on one day, which was probably due to some specific action in the classroom, 364
Particulate matter 2.5 µm measurement results are presented as a duration curve in Figure 6, 366
and parameters for statistical analysis are given in Table 5. 367
368
Figure 6. Duration curves of particulate matter 2.5 µm before and after the ventilation intervention in 369
Classroom 3. 370
Table 5. PM2.5 concentrations in Classroom 3 before and after the ventilation intervention: Statistical 371
parameters. 372
PM2.5 Before After
Measurement points 9 572 12 569
Mean 1.80 1.27
Standard deviation 1.06 0.97
Min 0.10 0.10
Max 5.90 5.90
373
The limit value for the PM2.5 mean concentration following 24 hours in indoor air was 25 µg/m3 374
[27]. All known PM2.5 sources in the studied building are outdoor sources; for example, traffic and 375
burning products. PM2.5 concentrations were very low before and after the intervention. However, 376
tested by the independent two-sample t-test, the difference in medians was statistically extremely 377
significant at the 100 % confidence interval (p = 0.000, 2-tailed). Daily actions can affect the PM2.5 378
concentrations temporarily; but due to the one-week measurement time, the results are reliable and 379
show a clear correlation with the positive pressure. 380
3.4 Characterization of the mycobiota in the indoor dust 381
Diversity and the pathogenic and toxigenic potential of the mycobiota cultivable from indoor 382
dust were characterized. Dust from extract filters and surfaces above floor levels were sampled and 383
cultivated before and after the ventilation intervention. Outdoor dust and air were sampled as 384
references. The fungal colonies are shown in Figure 7. 385
Figure 7. Fungal colonies sampled from the outdoor air and from the extract air filter dust before and 387
after the ventilation intervention. The outdoor air and dust contained black Curvularia-like colonies 388
(A, B, C). Extract air filter sampled before the ventilation intervention contained green Trichoderma 389
colonies (D), and green Penicillium and black Aspergillus colonies (E, F). Extract air filter sampled after 390
the ventilation intervention contained yellow Penicillium colonies and yellow Aspergillus colonies (G, 391
H, I). 392
393
The fungal colonies representing the dominant morphotypes (Error! Reference source not
394
found.) after four weeks of incubation were characterized to genus or species level (Table 7). The 395
results show that Rhizopus sp. strains unable to grow at 37 °C were the most commonly isolated fungi 396
in filter dust and settled dust collected before and after ventilation intervention. The results also show 397
that toxigenic, potentially mycoparasitic Trichoderma atroviride strains represented the dominant 398
morphotype on the three plates in both extract filter dust and settled dust collected before the 399
ventilation intervention. The dominant morphotypes in this dust contained potentially pathogenic 400
Aspergillus and toxigenic Penicillium species. 401
Table 6. The twelve morphotypes representing the dominant fungal genera and species isolated from 402
the extract filter, settled dust and outdoor air. 403
HA MBI Code
Growth at 37 oC
Toxicity Colony color
Size of conidia/ spores
Morphology in light microscope
BM
SI
ICP MEA (µm)
1. Aspergillus section Flavi
834 + - - green 5-8
2 strains + - - green 5-8
2. Aspergillus section Nigri
379 + - + black 3.5-5
3. Asp. versicolor
3670 - - + yellow 2-3
2 strains - - + yellow 2-3
4. Asp. westerdijkiae
3333 - + + yellow 2.5-3
5 strains - + + yellow 2.5-3
5. Curvularia sp.
+ +
black-grey
15 x 5
10 strains + + grey Conidio
-phore 15 x 5
6. Paecilomyces variotii
3342 + + - yellow 3-5
2 strains + + - yellow 3-5
7. Penicillium expansum
3610 - + + grey 3
1 strain - + + grey 3
8. Penicillium chrysogenum P.commune
3631 - - + green 3-4
10 strains - - + green 3-4
9. Penicillium sp.
- - - yellow 3
10 strains - - - yellow 3
10. Trichoderma longibrachiatum
3643 + + + green 1.5 x 3
1 strain + + + green 1.5 x 3
11. Trichoderma atroviride T. trixiae
3369 - + + green 3
6 strains - + + green 3
12. Rizopus nigricans
834 - - - black Spores
7-10
10 strains - - - black Spores
Table 7. Cultivable mycobiota in indoor dust from the extract air filter and from classroom surfaces 404
above the floor level. The dust was sampled before and after the ventilation intervention. Names in 405
bold indicate a dominant frequency of that colony type on > 50 % of the sampling plates; names in 406
brackets indicate the presence of a single colony on a single plate. 407
408
Microbial genera by sampling
month
Toxic colonies [%]
Number of plates containing colony morphotype School samples Settled dust Extract air filter Settled dust + Extract air filter Before ventilation
intervention
5/2016 8/2016 80
Rhizopus sp. Rhizopus sp. 3/10 T. atroviride* T. atroviride* 3/10
Penicillium chrysogenum.* P.commune*
7/10
Aspergillus niger*1 7/10 Aspergillus flavus1 2/10 (Paecilomyces sp.)*1 1/10
Asp. versicolor* 2/10
After ventilation intervention
9/2016 2/2017 40
Rhizopus sp. Rhizopus sp. 6/12 Penicillium sp. Penicillium sp. 10/12
Asp. westerdijkiae* 3/12 (Penicillium
expansum)*
1/12
T.trixiae* 1/12
(T.
longibrachiatum) *1
1/12
Reference samples (outdoors)
Fall out plate Settled dust
Sampling date 8/2016 8/2016
School yard Curvularia sp.* Curvularia sp.* 90 4/6
Barn dust Penicillium sp. Penicillium sp. <10 6/6
1 Potential pathogens able to grow at 37 oC. 409
*Toxigenic when screened with boar sperm inhibition test and/or cytotoxicity against porcine kidney cells. 410
In dust collected after the ventilation intervention, the dominant mycobiota (except Rhizopus sp.) 411
consisted mainly of nontoxigenic Penicillium strains and toxigenic Aspergillus species unable to grow 412
at 37 °C. On one plate, a toxigenic Trichodermalongibrachiatum strain able to grow at 37 °C and one 413
toxigenic Penicillium expansum colony were found. Reference samples collected outside of the school 414
contained toxigenic Curvularia sp.–like colonies, rendering these outdoor samples the highest number 415
of toxigenic colonies (Table 7). The hay barn dust did not contain toxigenic species or potentially 416
pathogenic Aspergillus strains. The indoor mycobiota differed in species composition from the 417
outdoor one, and changed simultaneously with the ventilation intervention. Interestingly, no 418
mycoparasitic Trichoderma strains were cultivable from the outdoor samples or barn dust. This 419
indicates that this species, isolated from the extract filter and settled dust before the ventilation 420
intervention, may have emanated from an indoor source. 421
3.5 Indoor air questionnaire 423
Indoor air questionnaire results from the studied building section and from the other building 424
sections are presented in Table 8. Occupants answered the questionnaire in the studied building 425
section before the ventilation intervention (5/2016) and after the intervention (1/2017), as well as 426
simultaneously in the other building sections where no ventilation or other changes had taken place. 427
Because of the low amount of data, Fisher´s exact test was used in the statistical analysis of several 428
factors instead of the chi-squared test. 429
Table 8. Indoor climate questionnaire (Finnish Institute of Occupational Health© 2006-2008, version 430
2.0) results from spring 2016 and winter 2017. Statistically significant changes at a 10 % confidence 431
interval (p < 0.1) are bolded. P-values marked with * were determined by the Fisher´s exact test (SPSS). 432
Comparison values Studied part Other parts
[28-30] 2016 2017 p-value 2016 2017 p-value
Background information
Number of answers 10 8 28 29
Answer% 71 58 62
Females (%) 21 60 75
Daily smokers (%) 10 0 0 0
Average age (years) 46 45
Average employment in this work place (years)
8 6
Work environment (%)
Draught 22 10 38 0.275* 7 21 0.253*
Room temperature too high 17 20 0 0.477* 7 7 1.000*
Varying temperature 16 20 57 0.162* 11 22 0.295*
Room temperature too low 13 30 25 1.000* 15 25 0.345
Stuffy air 34 30 38 1.000* 46 69 0.085
Dry air 35 40 50 1.000* 22 43 0.103
Insufficient ventilation 32 30 63 0.342* 43 55 0.352
Smell of mold 9 20 25 1.000* 14 21 0.730*
Unpleasant odour 17 40 25 0.638* 26 28 0.889
Environmental tobacco smoke 4 0 0 --- 0 0 ---
Noise 17 20 25 1.000* 39 45 0.672
Dim light or reflections 14 10 0 1.000* 7 10 1.000*
Dust or dirt 25 40 38 1.000* 32 43 0.408
Work regarded as interesting and stimulating (%)
Often 75 100 100 89 86
Sometimes 20 0 0 11 14
Seldom or never 4 0 0 --- 0 0 1.000*
Too much work to do (%)
Often 20 10 0 14 21
Sometimes 59 60 75 61 72
Seldom or never 21 30 25 1.000* 25 7 0.185*
Opportunity to influence work conditions (%)
Often 35 60 50 46 38
Sometimes 44 30 50 46 55
Seldom or never 21 10 0 0.798* 7 7 0.839*
Fellow workers help with problems in the work (%)
Often 72 80 100 82 83
Sometimes 22 20 0 14 17
Seldom or never 6 0 0 0.477* 4 0 1.000*
Asthma 8 10 13 1.000* 18 7 0.253*
Hay fever 38 40 75 0.188* 46 45 0.903
Atopic eczema 28 40 38 1.000* 14 17 1.000*
Stress (%)
Quite or very much 10 20 0 18 28
Some 28 20 63 29 41
No / only little 63 60 38 0.214* 54 31 0.226
Symptoms (%)
Fatigue 16 10 13 1.000* 14 34 0.077
Heavy-feeling head 9 0 25 0.183* 11 17 0.706*
Headache 7 0 13 0.444* 11 18 0.705*
Difficulties in concentrating 3 0 13 0.444* 4 14 0.352*
Eye irritation 17 20 13 1.000* 37 41 0.740*
Irritated, stuffy or running nose 20 20 25 1.000* 39 62 0.085
Hoarse/dry throat 14 10 50 0.118* 36 45 0.483
Cough 5 20 50 0.321* 11 17 0.706
Cough disturbing sleep 1 10 13 1.000* 0 0 ---
Dry of flushed facial skin 11 10 13 1.000* 7 29 0.036
Hands: dry, itching, red skin 15 10 0 1.000* 4 14 0.352*
Shortness of breath 3 10 13 1.000* 0 7 0.491*
Wheezing 1 10 13 1.000* 0 0 ---
Fever or chills 2 0 0 --- 4 7 1.000*
Joint pain 3 10 0 1.000* 4 0 0.491*
Muscular pain 4 0 0 --- 0 0 ---
Other 20 25 1.000* 4 3 1.000*
433
In the studied building section, the known changes in the conditions between the 2016 and 2017 434
questionnaires were outdoor conditions (seasons) and the ventilation intervention. In other building 435
sections, the only known change was the season. Also, psychosocial factors have an impact on 436
perceptions [23]. In the studied building section, conclusions about the effect of psychosocial factors 437
on IAQ perceptions could not be drawn compared to other building parts. 438
The first questionnaire (5/2016) was conducted during the spring when pollen may increase the 439
symptoms of allergic diseases and thus effect the perception of indoor climate; however, the air 440
handling unit had effective fine F7 class filters. The second questionnaire (1/2017) was conducted 441
during the winter when the indoor air was very dry because of the low absolute humidity of the 442
outdoor air. Dry air typically increases the prevalence of cough, nose and eye irritation, and skin 443
symptoms [23]. Mechanical ventilation is shown to increase symptom prevalence, related especially 444
to air dryness [2,6,31]. The impact of the season (spring / winter) can be seen from the results of other 445
parts of the school that were not under intervention. 446
Due to the low number of occupants and the low response rate in the studied building section, 447
individual answers were emphasized and significant differences (p-value < 0.05) were not found in 448
the statistical analysis. The unwanted negative pressure differences, especially during holidays, 449
might have affected indoor conditions and occupants´ perceptions. Between 2016 and 2017, the 450
prevalence of hoarse, dry throat (p = 0.118), heavy-feeling head (p = 0.183), cough (p = 0.321), and 451
headache, as well as difficulties concentrating (p = 0.444), increased. Also, the prevalence of varying 452
temperature (p = 0.162), draft (p = 0.275), and insufficient ventilation (p = 0.372) increased. 453
However, when comparing the changes in the studied building section to changes in the other 454
building sections, a different trend emerged. The perception of low temperature (p = 0.345), stuffy air 455
(p = 0.085), dry air (p = 0.103), and visible dust (p = 0.408) increased between 2016 and 2017 in other 456
building sections; however, it was not statistically significant. This can be explained by seasonal 457
changes. However, in the studied building section, no worsening in the same factors (p = 1.000) was 458
A high temperature decrease (p = 0.477) was reported in the studied building section, while in 460
other sections the number of perceptions was already very low in the first place. Perception of 461
unpleasant odor decreased (p = 0.638) in the studied section to the same level as it was in the other 462
sections. An increase in the perception of draft (p = 0.275, p = 0.253) and insufficient ventilation (p = 463
0.342, p = 0.352) was reported correspondingly in both sectors. 464
In the other building sections, tiredness (p = 0.077), nose irritation (p = 0.085), dryness of facial 465
skin (p = 0.036), hand skin symptoms (p = 0.352), and shortness of breath (p = 0.491) increased, while 466
no change in the studied section was seen (p = 1.000). This is an interesting result considering that, 467
simultaneously, reported asthma decreased (p = 0.253) in the other sections but not in the studied 468
section. In addition, the prevalence of hay fever increased (p = 0.188) in the studied section. In the 469
studied section, the perceptions of heavy-feeling head (p = 0.183) and cough (p = 0.381) increased more 470
than in the other sections (p = 0.706 for both). 471
It can be concluded that IAQ in the building was perceived as being worse more frequently in 472
2017. In the studied building section, major improvements in occupants´ perceptions were not 473
reported; however, neither was reported significant worsening in many of the factors that worsened 474
in the other building parts during the follow-up time. 475
4. Conclusions
476
Ventilation is an essential part of indoor environment quality. As shown in this study, even 477
relatively small changes in air flow and pressure differences can have noticeable effects on the 478
measurable and perceivable parameters of indoor air. CO2 concentration is often highlighted as an 479
indicator of sufficient ventilation rate, but should never be used alone to determine the state of 480
ventilation in an indoor space. In the studied building, CO2 measurements alone would have 481
indicated good IAQ and sufficient ventilation. In order to study IAQ and occupants´ well-being in an 482
indoor space, a holistic ventilation investigation was revealed to be essential. 483
The aim of 5-7 Pa positive pressure for a period of nine months was only partly reached. In 484
another studied classroom, the pressure difference was mostly close to 0 Pa. The TVOC and PM2.5 485
concentrations decreased significantly after ventilation intervention, yet these were initially very low. 486
The occupant questionnaire data analysis was weakened by the low number of occupants who 487
answered the questionnaire. Statistically significant improvement in occupants´ perceptions was not 488
demonstrated. The results were, however, analyzed to determine possible differences between the 489
studied building section and the other parts of the building, where no actions were taken. In the 490
follow-up questionnaire conducted after five months of positive pressure, the occupants´ perceptions 491
had worsened more moderately, if at all, compared to the occupants´ perceptions in the other 492
building sections, where perceptions had worsened significantly and the only known change in 493
conditions was the season. Seasonal effects on human perceptions were significant due to the cold 494
and dry air of the winter, and also likely due to psychosocial aspects, e.g. darkness during the winter. 495
This effect can be seen in the questionnaire data from the other building sections, but not as clearly 496
in the data from the studied building section. This indicates that positive pressure could be a practical 497
way to decrease perceived IAQ-related problems, but research with a larger occupant sample is 498
needed to confirm this indication. 499
This study also shows that the change in pressure conditions coincided with a partial but 500
important change in species composition of the indoor microbiome: The potentially pathogenic 501
species of Aspergillus able to grow at 37 °C (Aspergillus section Nigriand section Flavi strains) were 502
replaced with Aspergillus strains unable to grow at 37° C (Asp. westerdijkiae and Asp. versicolor-like 503
strains). There are only a few Aspergillus species that frequently cause infections in humans: 504
A. fumigatus and A. niger which are responsible for more than 90 % of systemic and lung infections 505
whereas A. flavus is the main cause of eye infections [32]. The occurrence of potentially pathogenic 506
isolates of Paecilomyces and Trichoderma species are of concern. However, these strains seem to be 507
minor representatives of the viable mycobiota. 508
The occurrence of potentially mycoparasitic T. atroviride strains disappeared after the 509
extract filters collected under negative pressure differences may represent viable fungi emanating 511
from building constructions, as fungal spore penetration in indoor spaces under negative pressure 512
has previously been shown. However, the impact of the sampling season cannot be excluded in this 513
case. More investigations under circumstances in which the impact of outdoor air is standardized are 514
needed for the evaluation of the sampling method used. In the method, microbes are collected from 515
the extract air filters as representatives of the microbiome within building constructions, which are 516
potentially and occasionally liberated into indoor air due to fluctuations in pressure differences 517
across the building envelope. According to this study, this method could be a relevant way to 518
investigate sources of impurities in buildings with indoor air problems. 519
This study indicates that by situational ventilation interventions, conditions in a building with 520
unsolved IAQ problems or awaiting repairs can be controlled without other major temporary actions. 521
Positive pressure could be efficient, especially in a building with microbial damage or other 522
impurities infiltrating from the structures. When utilizing positive pressure, the pressure difference 523
should be high enough to constantly cover all spaces and the variation in ventilation. Potential excess 524
moisture indoors must be low or controlled by ventilation to prevent condensation inside the 525
structures. 526
Acknowledgments: The authors warmly acknowledge The Academy of Finland (grant TOXICPM 289161), the 527
Finnish Work Environment Fund (grant EURA 115376) and Tekes (grant 4098/31/2015) for funding this research. 528
The participation of the Real Estate Center of the city of Vantaa and the studied school is greatly appreciated. 529
Sweco Finland Oy (Sweco Asiantuntijapalvelut Oy) is acknowledged for conducting the indoor climate and 530
structural investigations. Laszlo Kredics was supported by grant GINOP-2.3.2-15-2016-00012 (Széchenyi 2020 531
Programme, Hungary) and the János Bolyai Research Scholarship (Hungarian Academy of Sciences). 532
Author Contributions: Camilla Vornanen-Winqvist wrote the paper and conceived, designed, and performed 533
every experiment; Kati Järvi analyzed the questionnaire data; Sander Toomla conceived, designed, and 534
performed the ventilation experiments and contributed the measurement devices; Kaiser Ahmed designed and 535
performed the ventilation experiments; Maria A. Andersson conceived, designed, and performed the mycobiota 536
experiments, analyzed the data, and participated in writing the paper; Raimo Mikkola designed the IAQ 537
experiments, contributed measurement devices, and analyzed the VOC samples; Tamas Marik and Laszlo 538
Kredics designed and performed the identification of the fungal morphotypes; Heidi Salonen was responsible 539
for designing and conceiving the IAQ experiments and questionnaires; Jarek Kurnitski was the principal 540
investigator responsible for the study design. 541
Conflicts of Interest: The authors declare no conflict of interest. The founding sponsors had no role in the design 542
of the study; in the collection, analyses, or interpretation of data; in the writing of the manuscript, and in the 543
decision to publish the results. 544
Abbreviations
545
The following abbreviations are used in this manuscript: 546
IAQ: Indoor air quality 547
TVOC: Total volatile organic compounds 548
VOC: Volatile organic compounds 549
PM: Particulate matter 550
FIOH: Finnish Institute of Occupational Health 551
2E1H: 2-ethyl-1-hexanol 552
References
553
1. 1. Haverinen-Shaughnessy, U.; Hyvärinen, A.; Putus, T.; Nevalainen, A. Monitoring Success of 554
Remediation: Seven Case Studies of Moisture and Mold Damaged Buildings. Science of The Total 555
Environment 2008, 399, 19-27. 556
2. 2. Seppänen, O.A.; Fisk, W.J. Summary of Human Responses to Ventilation. Indoor Air 2004, 14, 102-118. 557
3. 3. Airaksinen, M.; Kurnitski, J.; Pasanen, P.; Seppänen, O. Fungal Spore Transport through a Building 558
4. 4. Airaksinen, M.; Pasanen, P.; Kurnitski, J.; Seppänen, O. Microbial Contamination of Indoor Air due to 560
Leakages from Crawl Space: A Field Study. Indoor Air 2004, 14, 55-64. 561
5. 5. Meklin, T.; Potus, T.; Pekkanen, J.; Hyvärinen, A.; Hirvonen, M.-.; Nevalainen, A. Effects of Moisture-562
Damage Repairs on Microbial Exposure and Symptoms in Schoolchildren. Indoor Air 2005, 15, 40-47. 563
6. 6. Wargocki, P.; Sundell, J.; Bischof, W.; Brundrett, G.; Fanger, P.O.; Gyntelberg, F.; Hanssen, S.O.; Harrison, 564
P.; Pickering, A.; Seppänen, O. et al. Ventilation and Health in Non-Industrial Indoor Environments: Report 565
from a European Multidisciplinary Scientific Consensus Meeting (EUROVEN). Indoor Air 2002, 12, 113-566
128. 567
7. 7. Fang, L.; Wyon, D.P.; Clausen, G.; Fanger, P.O. Impact of Indoor Air Temperature and Humidity in an 568
Office on Perceived Air Quality, SBS Symptoms and Performance. Indoor Air 2004, 14, 74-81. 569
8. 8. Wargocki, P.; Wyon, D.P.; Sundell, J.; Clausen, G.; Fanger, P.O. The Effects of Outdoor Air Supply Rate 570
in an Office on Perceived Air Quality, Sick Building Syndrome (SBS) Symptoms and Productivity. Indoor 571
Air 2000, 10, 222-236. 572
9. 9. Persily, A.; Wargocki, P. How to Evaluate Ventilation in IAQ Studies. Indoor Air 2016. 573
10. 10. Kalamees, T. Measured and Simulated Air Pressure Conditions in Finnish Residential Buildings. Build. 574
Serv. Eng. Res. Technol. 2010, 31, 177. 575
11. 11. Leivo, V.; Kiviste, M.; Aaltonen, A.; Turunen, M.; Haverinen-Shaughnessy, U. Air Pressure Difference 576
between Indoor and Outdoor Or Staircase in Multi-Family Buildings with Exhaust Ventilation System in 577
Finland. Energy Procedia 2015, 78, 1218-1223. 578
12. 12. Finnish Ministry of the Environment (YM, Ympäristöministeriö), Department of Built Environment. D2 579
Suomen Rakentamismääräyskokoelma, Rakennusten sisäilmasto ja ilmanvaihto, Määräykset ja ohjeet 2012 580
(D2 National Building Code of Finland. Indoor Climate and Ventilation of the Buildings. Regulations and 581
Guidelines 2012). 2012. 582
13. 13. Sweco Asiantuntijapalvelut Oy (Sweco Finland Oy). Sisäilmasto- ja kosteustekninen kuntotutkimus. 583
Tutkimusselostus, 22500325.314, 24.8.2016 (an Indoor Climate and Structural Investigation, Investigation 584
Report). 2016. 585
14. 14. The Finnish Institute of Occupational Health. Kooste toimistoympäristöjen epäpuhtaus- ja 586
olosuhdetasoista, joiden ylittyminen voi viitata sisäympäristöongelmiin, 27.2.2017 (Summary of the Levels 587
of Indoor Air Pollutants and Conditions that can Refer to Indoor Environment Problems). 2017, 2017. 588
15. 15. Andersson, M.A.; Jääskeläinen, E.L.; Shaheen, R.; Pirhonen, T.; Wijnands, L.M.; Salkinoja-Salonen, M.S. 589
Sperm Bioassay for Rapid Detection of Cereulide-Producing Bacillus Cereus in Food and Related 590
Environments. International Journal of Food Microbiology 2004, 94, 175-183. 591
16. 16. Bencsik, O.; Papp, T.; Berta, M.; Zana, A.; Forgó, P.; Dombi, G.; Andersson, M.A.; Salkinoja-Salonen, M.; 592
Vágvölgyi, C.; Szekeres, A. Ophiobolin A from Bipolaris Oryzae Perturbs Motility and Membrane 593
Integrities of Porcine Sperm and Induces Cell Death on Mammalian Somatic Cell Lines. Toxins 2014, 6, 594
2857-2871. 595
17. 17. Samson, R.A.; Hoekstra, E.S.; Frisvad, J.C. Introduction to Food-and Airborne Fungi.; Centraalbureau voor 596
Schimmelcultures (CBS), 2004. 597
18. 18. Andersson, M.A.; Mikkola, R.; Raulio, M.; Kredics, L.; Maijala, P.; Salkinoja-Salonen, M.S. Acrebol, a 598
Novel Toxic Peptaibol Produced by an Acremonium Exuviarum Indoor Isolate. J. Appl. Microbiol. 2009, 599
106, 909-923. 600
19. 19. Andersson, K.; Stridh, G. The use of Standardized Questionnaires in Building Related Illness (BR) and 601
Sick Building Syndrome (SBS) Surveys. in NATO/CCMS Pilot Study on Indoor Air Quality. 1992, (1992). 602
pp. 47–64. 603
20. 20. Andersson, K. Epidemiological Approach to Indoor Air Problems. Indoor Air 1998, 8, 32. 604
21. 21. Mattila, M.; Vornanen-Winqvist, C.; Jerkku, I.; Kurnitski, J. Ylipaineistuksen ja ilmanpitävyyden 605
vaikutus rakenteiden kosteustekniseen toimintaan (the Effect of Positive Pressure and Air Tighntess on the 606
Moistural Behavior of Buildings). In Rakennusfysiikka 2017: Uusimmat tutkimustulokset ja hyvät 607
käytännön ratkaisut, Osa 1., Tampere, Finland; pp. 91-96. 608
22. 22. Ruotsalainen, R.; Säteri, J., Eds.Classification of Indoor Air Environment 2008. Target Values, Design 609
Guidance and Product Requirements. FiSIAQ Publication 5, First edition ed.; Finnish Society of Indoor Air
610
23. 23. Azuma, K. Evaluating Prevalence and Risk Factors of Building-Related Symptoms among Office 612
Workers: Seasonal Characteristics of Symptoms and Psychosocial and Physical Environmental Factors. 613
Environmental health 2017, 22, 38. 614
24. 24. Haghighat, F.; De Bellis, L. Material Emission Rates: Literature Review, and the Impact of Indoor Air 615
Temperature and Relative Humidity. Building and Environment 1998, 33, 261-277. 616
25. 25. Wolkoff, P. Impact of Air Velocity, Temperature, Humidity, and Air on Long-Term Voc Emissions from 617
Building Products. Atmospheric Environment 1998, 32, 2659-2668. 618
26. 26. Fang, L. Impact of Temperature and Humidity on the Perception of Indoor Air Quality. Indoor Air 1998, 619
8, 80. 620
27. 27. Ministry of Social Affairs and Health, Finland. Decree of the Ministry of Social Affairs and Health on 621
Health-Related Conditions of Housing and Other Residential Buildings and Qualification Requirements 622
for Third-Party Experts (545/2015). 2015. 623
28. 28. Reijula, K.; Sundman Digert, C. Assessment of Indoor Air Problems at Work with a Questionnaire. 624
Occup. Environ. Med. 2004, 61, 33-38. 625
29. 29. Lahtinen, M.; Sundman Digert, C.; Reijula, K. Psychosocial Work Environment and Indoor Air 626
Problems: A Questionnaire as a Means of Problem Diagnosis. Occup. Environ. Med. 2004, 61, 143-149. 627
30. 30. Hellgren, U.M. Complaints and Symptoms among Hospital Staff in Relation to Indoor Air and the 628
Condition and Need for Repairs in Hospital Buildings. Scand. J. Work Environ. Health 2008, 34, 58. 629
31. 31. Jaakkola, J.J.; Heinoneon, O.P.; Seppänen, O. Mechanical Ventilation in Office Buildings and the Sick 630
Building Syndrome. an Experimental and Epidemiological Study. Indoor Air 1991, 1, 111-121. 631
32. 32. Paulussen, C.; Hallsworth, J.E.; Álvarez-Pérez, S.; Nierman, W.C.; Hamill, P.G.; Blain, D.; Rediers, H.; 632
Lievens, B. Ecology of Aspergillosis: Insights into the Pathogenic Potency of Aspergillus Fumigatus and 633
![Table 1. Microbial growth in outer wall structures of Classroom 3 [13].](https://thumb-us.123doks.com/thumbv2/123dok_us/7944033.1318643/4.595.83.494.136.352/table-microbial-growth-outer-wall-structures-classroom.webp)