Note
On the Evolution of Codon Volatility
Jianzhi Zhang
1Department of Ecology and Evolutionary Biology, University of Michigan, Ann Arbor, Michigan 48109 Manuscript received August 11, 2004
Accepted for publication September 30, 2004
ABSTRACT
Volatility of a codon is defined as the probability that a random point mutation in the codon generates a nonsynonymous change. It has been proposed that higher-than-expected mean codon volatility of a gene indicates that positive selection for nonsynonymous changes has acted on the gene in the recent past. I show that strong frequency-dependent selection (minority advantage) in large populations can increase codon volatility slightly, whereas directional positive selection has no effect on volatility. Factors unrelated to positive selection, such as expression-related or GC-content-related codon usage bias, also affect volatility. These and other considerations suggest that codon volatility has only limited utility for detecting positive selection at the DNA sequence level.
P
OSITIVE Darwinian selection at the DNA sequence ally high volatility simply because it has a high propor-level is usually assessed by comparing the number tion of amino acids with high volatility (e.g., Trp and of synonymous substitutions per synonymous site (dS) Arg). Controlled for amino acid composition, a geneand the number of nonsynonymous substitutions per may still have an unusually high volatility due to the nonsynonymous site (dN) from an alignment of at least frequent use of synonymous codons that are of high
two homologous protein-coding DNA sequences (Li volatility. Four of the 20 amino acids (Arg, Gly, Leu, and 1997; Nei and Kumar 2000). A significantly higher dN Ser) contain synonymous codons of different volatilities
overdSis a strong indication of positive selection (Hughes (Table 1).Plotkinet al.(2004) argued that high
volatil-andNei1988). Plotkin and co-workers recently intro- ity (after control for amino acid composition and geno-duced a new method for detecting positive selection mic average patterns of synonymous codon usage) is a using just one DNA sequence, and this method is based result of positive selection for nonsynonymous changes on the concept of codon volatility (Plotkinet al.2004). and that volatility can be used as a statistic for detecting Volatility of a codon is defined as the probability that positive selection. In particular, it was proposed that a random point mutation in this codon is nonsynony- compared with a low-volatility codon, the presence of mous. Codon volatility necessarily depends on muta- a high-volatility codon in a gene sequence indicates a tional patterns, such as the ratio of transitional to trans- greater probability that the previous substitution was versional changes. In the simplest mutation model (SMM) nonsynonymous (Plotkin et al. 2004). Although this where all nucleotides have equal mutation rates and all interpretation is valid, it does not follow that high volatil-nucleotides are equally exchangeable, the volatility of
ity indicates positive selection. Furthermore, in theory, a codon is the proportion of point-mutation neighbors
positive selection for nonsynonymous changes may not that encode different amino acids (Plotkinet al.2004).
increase codon volatility for the following reason: The For instance, TTG (Leu) has a volatility of 6/8, because
only advantage of having a high-volatility codon is its great 6 of its 8 non-stop-codon neighbors are nonsynonymous.
potential of generating nonsynonymous mutations in the Table 1 lists the volatility of all 61 sense codons under
future. But natural selection cannot foresee the future. the SMM. One can see that codon volatility varies from
As long as two codons code for the same amino acid, 0.5 (CGA for Arg) to 1 (TGG for Trp or ATG for Met).
the high-volatility codon does not confer higher fitness. The volatility of a gene is the average volatility for all
Therefore, it is unclear under what conditions codon the codons in the gene. A gene may have an
exception-volatility would indicate positive selection. Here I ad-dress this question by computer simulation and ana-lysis of genomic sequence data. My results suggest that 1Address for correspondence:Department of Ecology and Evolutionary
positive selection rarely increases codon volatility and
Biology, University of Michigan, 3003 Natural Science Bldg., 830 N.
University Ave., Ann Arbor, MI 48109. E-mail: [email protected] that factors other than positive selection can affect
TABLE 1
Codon volatility under the simplest model of mutation
TTT Phe 0.889 TCT Ser 0.667 TAT Tyr 0.857 TGT Cys 0.875
TTC Phe 0.889 TCC Ser 0.667 TAC Tyr 0.857 TGC Cys 0.875
TTA Leu 0.714 TCA Ser 0.571 TAA Stop TGA Stop
TTG Leu 0.750 TCG Ser 0.625 TAG Stop TGG Trp 1.000
CTT Leu 0.667 CCT Pro 0.667 CAT His 0.889 CGT Arg 0.667
CTC Leu 0.667 CCC Pro 0.667 CAC His 0.889 CGC Arg 0.667
CTA Leu 0.556 CCA Pro 0.667 CAA Gln 0.875 CGA Arg 0.500
CTG Leu 0.556 CCG Pro 0.667 CAG Gln 0.875 CGG Arg 0.556
ATT Ile 0.778 ACT Thr 0.667 AAT Asn 0.889 AGT Ser 0.889
ATC Ile 0.778 ACC Thr 0.667 AAC Asn 0.889 AGC Ser 0.889
ATA Ile 0.778 ACA Thr 0.667 AAA Lys 0.875 AGA Arg 0.750
ATG Met 1.000 ACG Thr 0.667 AAG Lys 0.875 AGG Arg 0.778
GTT Val 0.667 GCT Ala 0.667 GAT Asp 0.889 GGT Gly 0.667
GTC Val 0.667 GCC Ala 0.667 GAC Asp 0.889 GGC Gly 0.667
GTA Val 0.667 GCA Ala 0.667 GAA Glu 0.875 GGA Gly 0.625
GTG Val 0.667 GCG Ala 0.667 GAG Glu 0.875 GGG Gly 0.667
don volatility. Thus, the utility of this method appears all genes have volatilities between 0.5 and 1. Figure 1A
limited. shows the distribution of volatility for all 3624 genes
from the complete genome sequence of the K12 strain of Escherichia coli. The mean volatility is 0.761 and the RESULTS AND DISCUSSION
standard deviation is 0.014. One can see that gene vola-tility has a narrow distribution, with the standard devia-Volatility varies slightly among genes:Because
volatil-ity is between 0.5 and 1 for each codon, it follows that tion being only 1.8% of the mean. The distribution is
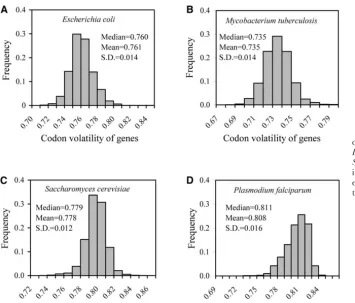
Figure 2.—Frequency distributions of
(observed volatility divided by expected volatility controlled for the amino acid composition of the gene and the genomic average of synonymous codon usage) among all genes of (A)E. coli, (B)M. tubercu-losis, (C)S. cerevisiae, and (D)P. falciparum. Volatility server (http://volatility.cgr.harv ard.edu/cgi-bin/volatility.pl) was used for the computation.
also symmetric, as the median (0.760) is very close to Directional positive selection does not increase codon volatility: To investigate whether continuous positive mean (0.761). The same pattern is observed in several
other prokaryotic and eukaryotic genomes examined selection favoring nonsynonymous substitutions would increase the codon volatility of a gene, I conducted (Figure 1), except for the malaria parasitePlasmodium
falciparum, which appears to have an asymmetric distri- a computer simulation. In the simulation, I randomly generated a sense codon and then introduced muta-bution that may be due to its exceptionally high AT
content in the genome. tions randomly according to the SMM described above.
I used different types of selection measured by thedN/dS
As mentioned, gene volatility is affected by the amino
acid composition of the gene as well as by synonymous ratio. For example, whendN/dSwas 2, a nonsynonymous
mutation was twice as likely as a synonymous mutation codon usage. It is thus possible to compute the expected
volatility of the gene using its amino acid composition to be fixed. After a long period of evolution (equivalent todS ⫽ 10), I measured the volatility of the resultant
and the average frequencies of synonymous codons
found in the genome (Plotkinet al.2004). The ratio codon and compared it with that of the initial codon. This simulation was repeated 20,000 times. The results () of the observed volatility to the expected volatility
measures the deviation in volatility due to the bias of showed that neither positive (dN/dS⬎1) nor negative
(dN/dS⬍ 1) selection affected the evolution of codon
synonymous codon usage of the gene from the genomic
average. Higher volatility than expected is indicated by volatility (Table 2). The average codon volatility was always 0.74–0.75 and codon frequencies did not change ⬎1 and lower volatility than expected is indicated by
⬍1. Figure 2A shows the distribution offor all the by the selection. For example, in the extreme case of positive selection with dN/dS ⫽ 8, the mean starting
genes ofE. coliK12. Again, the distribution is very
nar-row, with the standard deviation being only 0.46% of volatility was 0.74647 and the mean resultant volatility was 0.74678, and their difference was not statistically the mean. The same is true for other species examined
(Figure 2). These patterns show that the variation in significant (P⬎0.05;Z-test). Among the 20,000 codons simulated, volatility increased in 7771 codons during gene volatility is largely due to the among-gene variation
in amino acid composition and that gene volatility be- the evolution, reduced in 7740 codons, and remained unchanged in the rest of the cases. Again, the two num-comes extremely homogenous when the amino acid
composition variation is controlled for. This implies the bers, 7771 and 7740, are not significantly different (P⬎ 0.05; binomial test). These simulation results demon-rarity of selection that would substantially increase gene
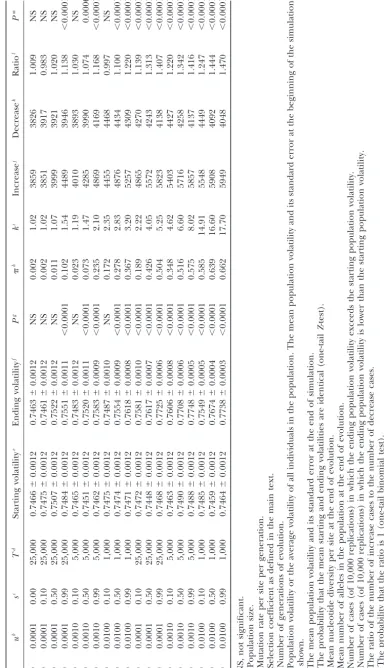
nonsynony-TABLE 2
Directional positive or negative selection does not affect codon volatility
Mean starting Mean ending
dN/dS volatility⫾SEMa volatility⫾SEMa Increaseb Decreasec Ratiod
8.0 0.74647⫾0.00085 0.74678⫾0.00085 7771 7740 1.004
4.0 0.74650⫾0.00085 0.74690⫾0.00085 7837 7694 1.019
2.0 0.74610⫾0.00085 0.74650⫾0.00085 7780 7769 1.001
1.0 0.74737⫾0.00085 0.74676⫾0.00085 7722 7701 1.003
0.5 0.74768⫾0.00085 0.74577⫾0.00085 7700 7868 0.979
0.2 0.74620⫾0.00085 0.74702⫾0.00085 7560 7527 1.004
0.1 0.74734⫾0.00085 0.74792⫾0.00085 6875 6907 0.995
aUnder none of the conditions examined is the mean ending volatility significantly different from the mean
starting volatility (P⬎0.05,Z-test).
bNumber of cases (in 20,000 simulations) in which the ending codon volatility exceeds the starting volatility. cNumber of cases (in 20,000 simulations) in which the starting codon volatility exceeds the ending volatility. dRatio of the number of increase cases to the number of decrease cases. Under none of the conditions
examined is the ratio significantly different from 0 (P⬎0.05, binomial test).
mous changes does not increase codon volatility and heritable. Second, under strong overdominant selection or frequency-dependent selection, multiple alleles at a thus volatility cannot be used as an indicator for such
selection. given codon site may be segregating. This, in conjunction
with the heritability of codon volatility, may allow high-Strong frequency-dependent selection may increase
codon volatility:In the above simulation, I assumed that volatility codons to generate more nonsynonymous co-dons that are positively selected for, which could increase for every codon, there were at most two alleles
segre-gating in the population at any given time. This is identi- the average volatility of the gene in the population. To investigate this possibility, I conducted a computer cal to the infinite-site model of population genetics
(Kimura1969, 1971) applied at the codon level and it simulation of frequency-dependent selection in a hap-loid population. Frequency-dependent selection and is a reasonable model for most genes in reality. For
example, virtually all single-nucleotide polymorphisms overdominant selection have similar effects on molecu-lar evolution (TakahataandNei1990). I here used the observed in human populations have only two different
nucleotides. However, this model does not apply to genes frequency-dependent selection in a haploid population due to its simplicity. I began the simulation by randomly under strong overdominant selection or
frequency-dependent selection (minority advantage), such as the generating a sense codon and assigning it to the entire population ofNhaploid individuals in generation 0. In mammalian major histocompatibility complex genes
where more than two different nucleotides may be seg- generationt,Nalleles were chosen randomly from the gene pool of generation t ⫺ 1, under both selection regating at a single site (HughesandNei1988, 1989).
I suspect that these types of selection might increase and drift. All synonymous codons encoding amino acid ihad the same fitness offi ⫽1⫺spi, wherepiwas the
codon volatility for two reasons. First, it has been noted
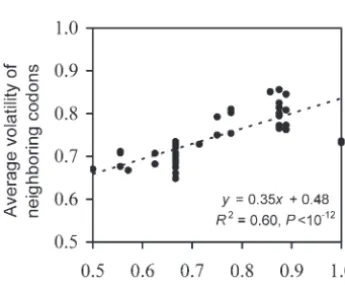
that high-volatility codons tend to have neighboring total frequency of synonymous codons encoding amino acidi ands (0 ⱕs ⱕ 1) was the selection coefficient. codons of high volatility (PlotkinandDushoff2003),
as shown in Figure 3. This means that codon volatility is This fitness formula reflected one form of minority ad-vantage, where the fitness of an allele was linearly deter-mined by the allele frequency. Random mutations were then generated with a rate ofuper nucleotide site per generation. Evolution continued forTgenerations, and the average codon volatility for the population in gener-ationTwas computed and compared with that in gener-ation 0. I used sufficiently largeTvalues to ensure that the population reached equilibrium at the end of the simulation. The simulation was repeated 10,000 times. Table 3 lists the simulation results under various condi-tions. To reduce computer time, I used small population sizes (N) but relatively large selective coefficients (s) and high mutation rates (u) so thatNuwas in the range of 0.001–1 andNswas in the range of 0–99.Nuis usually between 0.01 and 1 for prokaryotes and unicellular eu-Figure3.—Correlation between the volatility of a codon
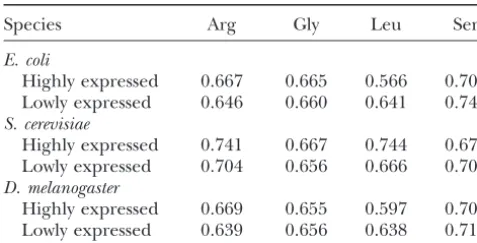
TABLE 4 nomenon is due to selection for high translational effi-ciency through preferential use of synonymous codons
Expected volatility in highly and lowly expressed genes
whose cognate tRNA has high concentrations. As men-tioned, four amino acids have synonymous codons of
Species Arg Gly Leu Ser
different volatilities. Table 4 lists the average volatility
E. coli for each of these amino acids computed by considering
Highly expressed 0.667 0.665 0.566 0.705
the average synonymous codon usage in highly and
Lowly expressed 0.646 0.660 0.641 0.742
lowly expressed genes ofE. coli,Saccharomyces cerevisiae, S. cerevisiae
andDrosophila melanogaster(Sharpet al.1988). It is
obvi-Highly expressed 0.741 0.667 0.744 0.673
Lowly expressed 0.704 0.656 0.666 0.703 ous that codon volatility can be affected by gene
expres-D. melanogaster sion level. The actual amount of effect, however,
de-Highly expressed 0.669 0.655 0.597 0.700 pends on the frequencies of these four amino acids in a Lowly expressed 0.639 0.656 0.638 0.715 protein, particularly Arg, Leu, and Ser. A recent analysis showed that the synonymous codon usage in genes highly The expected volatility for each amino acid is the average
volatility for all synonymous codons (Table 1) weighted by expressed in one stage of the developmental cycle ofP. codon frequencies inSharpet al.(1988). Only the four listed falciparum differs from that in genes highly expressed amino acids have synonymous codons of different volatilities.
in another stage (Peixotoet al.2004). It is unclear, how-ever, whether this difference resulted from codon volatil-ity-related selection (Plotkinet al.2004) or from transla-lular eukaryotes (LynchandConery2003). Thus, our tion efficiency-related selection that may arise if tRNA simulation was biologically meaningful. As predicted, concentrations vary in different developmental stages. frequency-dependent selection could increase codon Furthermore, in some organisms, GC content varies volatility, and this increase became more obvious when substantially in different regions of the genome (e.g., Ns and Nu were larger. In higher eukaryotes, codon mammals;Bernardi2004), which may lead to variable volatility is less useful as an indicator for positive selec- expected codon volatility for different genomic regions. tion because N and Nuare generally quite small. For Thus, use of the genomic average synonymous codon instance, in humans, N is about 104 (Takahata et al.
usage to compute the expected codon volatility may be 1995) anduis about 2⫻10⫺8per generation (Yiet al.
inappropriate. 2002), and Nuis thus 2⫻10⫺4. However, even under
In this work, the simplest mutation model was used. the most extreme condition examined (N ⫽ 100,s ⫽ In reality, mutational patterns are quite complicated 0.99,u⫽0.01), the mean codon volatility increased by and may vary among genes and genomes. Although ⬍4%, suggesting that codon volatility responded to only codon volatility can be computed given a mutational a small extent to the frequency-dependent selection for model (Plotkinet al.2004), the lack of knowledge of nonsynonymous changes. Note that the above selection exact mutational models for a given gene or genome was quite strong, as it could maintain on average 17.7 adds another layer of uncertainty to the application of alleles in the population of 100 haploids and resulted codon volatility in detecting positive selection.
in a nucleotide diversity of 0.662. It should be noted Conclusions:In contrast to the claim of Plotkin et that the above simulation scheme was somewhat differ- al.(2004), I find that codon volatility does not increase ent from conventional population genetic analysis, be- by directional positive selection for nonsynonymous cause it was the behavior of a single codon, not that of changes, and it increases only slightly by strong fre-a DNA sequence, thfre-at wfre-as exfre-amined. The simulfre-ation quency-dependent selection in large populations. Given can be regarded as a special case in which at any time that factors unrelated to positive selection also affect of evolution only the variation at one codon of the gene codon volatility, the utility of this measure in detecting affects fitness. In reality, nonadditive fitness effects of positive selection at the DNA sequence level seems lim-different codons of a gene would make the situation ited. Nevertheless, the idea of using just one DNA se-much more complicated. Nevertheless, the simple simu- quence to detect natural selection (Plotkinet al.2004) lation demonstrates the extent to which frequency- is novel and attractive, and it would be interesting to dependent selection could affect codon volatility. develop other measures that may accomplish this goal.
Expression-related codon usage bias potentially
af-I thank Hunter Fraser and Xionglei He for discussions. David Webb
fects codon volatility:Although codon volatility could be and two anonymous reviewers provided valuable comments on the enhanced by frequency-dependent selection and thus manuscript. This work was supported by a startup fund from the University of Michigan and National Institutes of Health grant
GM-in prGM-inciple may be used as an GM-indicator for positive
se-67030 to J.Z.
lection, codon volatility may also be affected by factors un-related to positive selection for nonsynonymous changes. For instance, it is well known that synonymous codon
usage bias is related to the level of gene expression in LITERATURE CITED
many organisms, with a greater degree of bias in highly Bernardi, G., 2004 Structural and Evolutionary Genomics: Natural Selec-tion in Genome EvoluSelec-tion.Elsevier, Amsterdam.
phe-A virus. Proc. Natl. phe-Acad. Sci. USphe-A100:7152–7177. at major histocompatibility complex class I loci reveals
overdomi-Plotkin, J. B., J. DushoffandH. B. Fraser, 2004 Detecting selec-nant selection. Nature335:167–170.
tion using a single genome sequence of M. tuberculosis and
Hughes, A. L., andM. Nei, 1989 Nucleotide substitution at major
P. falciparum.Nature428:942–945. histocompatibility complex class II loci: evidence for
overdomi-Sharp, P. M., E. Cowe, D. G. Higgins, D. C. Shields, K. H. Wolfeet
nant selection. Proc. Natl. Acad. Sci. USA86:958–962.
al., 1988 Codon usage patterns inEscherichia coli,Bacillus subtilis,
Kimura, M., 1969 The number of heterozygous nucleotide sites
Saccharomyces cerevisiae,Schizosaccharomyces pombe,Drosophila
mela-maintained in a finite population due to steady flux of mutations.
nogasterandHomo sapiens; a review of the considerable within-Genetics61:893–903.
species diversity. Nucleic Acids Res.16:8207–8211.
Kimura, M., 1971 Theoretical foundation of population genetics at
Takahata, N., andM. Nei, 1990 Allelic genealogy under overdomi-the molecular level. Theor. Popul. Biol.2:174–208.
nant and frequency-dependent selection and polymorphism of
Li, W. H., 1997 Molecular Evolution. Sinauer, Sunderland, MA.
major histocompatibility complex loci. Genetics124:967–978.
Lynch, M., andJ. S. Conery, 2003 The origins of genome
complex-Takahata, N., Y. SattaandJ. Klein, 1995 Divergence time and ity. Science302:1401–1404. population size in the lineage leading to modern humans. Theor.
Nei, M., andS. Kumar, 2000 Molecular Evolution and Phylogenetics. Popul. Biol.48:198–221.
Oxford University Press, New York. Yi, S., D. L. EllsworthandW. H. Li, 2002 Slow molecular clocks
Peixoto, L., V. FernandezandH. Musto, 2004 The effect of ex- in Old World monkeys, apes, and humans. Mol. Biol. Evol.19: pression levels on codon usage inPlasmodium falciparum.Parasitol- 2191–2198.
ogy28:245–251.