General Models of Multilocus Evolution
Mark Kirkpatrick,*
,1Toby Johnson
†,‡and Nick Barton
†*Section of Integrative Biology, University of Texas, Austin, Texas 78712,†Institute of Cell, Animal and Population Biology,
University of Edinburgh, Scotland EH9 3JT, United Kingdom and‡Department of Zoology, University of British Columbia,
Vancouver, British Columbia V6T 1Z4, Canada
Manuscript received October 23, 2001 Accepted for publication May 1, 2002
ABSTRACT
In 1991, Barton and Turelli developed recursions to describe the evolution of multilocus systems under arbitrary forms of selection. This article generalizes their approach to allow for arbitrary modes of inheritance, including diploidy, polyploidy, sex linkage, cytoplasmic inheritance, and genomic imprinting. The framework is also extended to allow for other deterministic evolutionary forces, including migration and mutation. Exact recursions that fully describe the state of the population are presented; these are implemented in a computer algebra package (available on the Web at http://helios.bto.ed.ac.uk/evolgen). Despite the generality of our framework, it can describe evolutionary dynamics exactly by just two equations. These recursions can be further simplified using a “quasi-linkage equilibrium” (QLE) approximation. We illustrate the methods by finding the effect of natural selection, sexual selection, mutation, and migration on the genetic composition of a population.
E
VOLUTION involves simultaneous changes at 1. The infinitesimal model assumes that very manygenes influence the phenotype, such that each allele many genetic loci. Modeling these changes is
diffi-cult because associations between alleles at different loci has an infinitesimal effect (Fisher 1918; Bulmer
1980;TurelliandBarton1994). In this limit, the
(“linkage disequilibria”) cause the effects of selection
acting on one locus to spill over onto other loci, generat- genetic variance contributed by allelic variation at
each locus is constant, and evolutionary change is
ing indirect selection (seeEwens1979, p. 195). These
indirect effects influence the evolution of genes that are due solely to changes in associations among loci. This
is an accurate and general approximation for short-themselves under direct selection, altering the course of
adaptation (e.g., Hill and Robertson 1966; Barton term change under strong selection, but cannot
de-scribe changes in allele frequencies over the longer 1983). Moreover, indirect selection determines the fate
of modifier genes that have important effects even if term.
2. The hypergeometric model (Kondrashov 1984;
they themselves are free of direct selection. Examples
of such modifiers include female mating preference Barton1992;Doebeli1996) also assumes that loci
are unlinked and have equal effects, but allows the
genes (Fisher 1952), modifiers of recombination
(Otto and Michalakis 1998), and modifiers of the number of loci to be finite. However, the stability of solutions to this model is limited to certain selection
mutation rate (Dawson1999;Sniegowskiet al.2000).
The most obvious approach to modeling multilocus regimes (Shpak and Kondrashov 1999; Barton
andShpak2000), which do not include many scenar-systems is simply to follow the frequencies of all possible
genotypes. There are three basic drawbacks here. First, ios of evolutionary interest, such as stabilizing
selec-tion. the number of genotypes grows exponentially with the
3. Another method introduced byFisher(1953)
mod-number of loci, rapidly overwhelming both analytical
els a population by following the inheritance of “junc-and simulation approaches when there are even a
mod-tions” between chromosome regions with different est number of genes. Second, the quantities that are
ancestries. This approach is well suited to describing often of most interest, such as allele frequencies and
the ancestry of samples of neutral genomes (Hudson
mean phenotypes, are obscured by working with
geno-1990) and models of hybridization, in which selec-types. Third, approximations for the dynamic equations
tion can be approximated as acting on the propor-appear more naturally when we work with quantities
tions of genetic material derived from different other than genotype frequencies.
source populations (Baird1995). It is again
intracta-Several approximate approaches have been developed
ble over long timescales, however, since the number to deal with these problems.
of junctions increases geometrically.
4. Price(1970) gave an exact and completely general equation, in which the average change in a trait is 1Corresponding author:Section of Integrative Biology C0930,
Univer-sity of Texas, Austin, Texas 78712. E-mail: [email protected] precisely equal to its covariance with relative fitness
plus the change due to transmission. This takes the proach is illustrated with examples in the following sec-tion.
classical approach of quantitative genetics, by
follow-The notation and recursions set out in this article ing only the phenotype and disregarding the (usually
have been implemented in a set ofMathematicapackages
unknown) genetics that underlies it.
(Wolfram1999) that are available on the Web at http:// 5. Several independent developments extend Price’s
helios.bto.ed.ac.uk/evolgen. These packages use the approach by following the mean, variance, and
general notation, in essentially the same form as in this
higher moments of the phenotypic distribution (e.g.,
article, and apply this notation to define functions
ap-BartonandTurelli1987;Bu¨ rger1991;Shapiro
propriate for selection and recombination in diploids.
et al.1994). Each moment depends on higher
mo-appendix dgives examples that show how the recursions ments, however, and so approximations are required
can be computed automatically to give algebraic expres-to give a closed set of dynamical equations. Such
sions for genetic changes in an arbitrary set of loci. approximations are accurate under restricted
cir-cumstances only. In contrast to thermodynamics, where molecular motions can be averaged out over
A GENERAL NOTATION FOR MULTILOCUS
macroscopic scales, genetic details do influence phe- EVOLUTION
notypic evolution.
Here we lay out a notation that is sufficiently flexible to account for the different modes of inheritance and
BartonandTurelli(1991, hereafter BT91)
devel-evolutionary forces that motivate the model. The section oped the quantitative genetic approach to provide a
starts by introducing the concepts on which the notation complete description of multilocus systems, with no
re-relies, shows how the notation can describe genotypes strictions on the relation between genotype and
pheno-and populations, pheno-and then describes the relation
be-type. This developed from work by Barton (1983,
tween phenotypes and genotypes.
1986),BartonandTurelli(1987), andTurelliand
Contexts and Positions, Selection, and Transmission:
Barton(1990); it was paralleled by independent work
It is useful to begin by defining the word “gene” to ofChristiansen(1987) andBu¨ rger(1991).Barton
mean a particular copy of a nonrecombining sequence andTurelli’s (1991) approach contains three key
ele-at some locus in some individual. Thus two different ments. First, it gives a general representation of
popula-genes may or may not reside at the same locus, and if tions with multiple alleles and multiple loci. Second, it
they do they may or may not be in the same allelic state. derives exact recursions for the effects of selection and
A gene at a given locus can be found in any of a number recombination on allele frequencies and the
associa-of situations: It might be carried by a male or a female, tions between alleles at different loci. Third, it finds a
it might have been inherited from a mother or a father, “quasi-linkage equilibrium” approximation (QLE) that
or it might reside in one deme or another. We refer to allows the recursion equations to be greatly simplified
this collection of qualities as the gene’scontext.Context
under some conditions.
is a key concept in our notation and it is important in Although the notation and framework of the BT91
two ways. First, it determines how evolutionary forces approach are general in many respects, the methods it
act on the gene. A selection coefficient, for example, develops are restricted to certain forms of inheritance.
may depend on whether the gene is carried by a male Their notation can describe autosomal genes in
ran-or a female. If there is genomic imprinting, then the domly mating diploids and in nonrandomly mating
hap-selection coefficient will also depend on the sex of the loids. It cannot, however, accommodate such
complica-individual from which the gene was inherited. Second,
tions as nonrandom mating in diploids, polyploidy, sex a gene’s context affects how it is transmitted. Consider
linkage, genome imprinting, and cytoplasmic inheri- two autosomal loci in a diploid individual. If there is
tance. The main aim of this article is to show how the no recombination between the loci during meiosis, the
BT91 approach can be generalized to include all forms resulting gamete will carry copies of the genes that both
of inheritance. We also show how migration and muta- descended from the individual’s mother or father; with
tion can be described in the same framework. recombination, the gamete will carry one gene from
This article begins by presenting a notation that is the individual’s mother and one from the father.
sufficiently flexible to accommodate a variety of evolu- The information we need to specify a gene’s context
tionary forces and modes of inheritance. Next, we derive varies between models. In a model of a spatially
struc-general recursion equations that describe how the ge- tured population, the context will include geographical
netic state of a population changes over the course of information. Likewise, in a life history model the context
a generation. The following section shows how the selec- specifies the life stage of the individual carrying it. The
tion and transmission coefficients that appear in the context will include the sex of the individual carrying
recursions are calculated for any particular situation. We a gene in a model with two sexes, but not in a model
then present the QLE approximation for the recursions, of a hermaphroditic population.
ap-context is written in a series of subscripts whose elements transmission depend both on the gene’s context and on the mode of inheritance obeyed by its locus (autoso-carry the relevant information. In this article we use the
convention that for diploid populations with two sexes, mal, Y-linked, cytoplasmic, etc.).
Describing genotypes and populations:The genotype
the first subscript of the context gives the sex of the
individual carrying the gene, which we call its “sex of of an individual at positioniis represented by the
indica-tor variableXi. With just two alleles per locus, Xi can
carrier.” The second subscript gives the sex of the parent
from which it was inherited, its “sex of origin.” Sexes take two values, which it is convenient to set at 0 or 1;
for this special case, the frequency of allele 1 at position are denoted by “m” for male and “f ” for female. For
example, genes at a diploid locusithat are carried by iis writtenpiand the frequency of allele 0 asqi⫽1⫺
pi. A fact that is useful later is that under these
conven-females and that descended from a male (the female’s
father) are referred to asifm. These are then four possi- tions, the expected value ofXi(averaging over all
indi-viduals in the population) is equal to pi. When there
ble contexts for genes at this locus. Contexts in
her-maphrodites would not include the sex of carrier (since are more than two alleles, we can choose any distinct
values to distinguish the alleles. If we are considering all individuals are the same sex), but would include the
sex of origin to denote whether the gene was transmitted alleles that have additive effects on a quantitative trait,
it is convenient to set the values equal to their effects through an egg or a sperm. One would account for
more than two sexes (as when modeling a plant popula- so that the expectation ofXiequals the position’s
contri-bution to the mean value of the trait. tion with tristyly) by simply allowing the subscripts to
take more than two possible values. Subscripts can be These conventions can be generalized if the situation
demands it. When a position has pleiotropic effects on added to denote other information, such as the deme
or the family in which a gene resides. a set of k traits, the variable Xi becomes a vector of
length k. In multiallelic models, vectors can also be
We use the termpositionto refer to a particular locus
in a particular context. An example of a position is the used as an alternative to the scalar-value convention
described in the last paragraph. We can define the indi-place in the genomes of females where genes inherited
from males (their fathers) at locusi reside. Positions, cator to be a vector of length equal to the number of
alleles, all entries of which are zero except for the one like loci, are defined independently of the allelic states
of the genes that reside there. Withndiploid loci in a corresponding to the allelic state. (This approach might
be used in a model of genes with additive effects if, for
dioecious population, there are 4npositions that genes
occupy (n loci ⫻ two sexes of carrier ⫻ two sexes of example, alleles with the same effect mutate to other
alleles at different rates.) Other conventions are also origin). Open-faced lowercase letters refer to single
po-sitions, for examplei⫽ifm. Open-faced uppercase letters possible: For example, each position could be
repre-sented by a vector of length two, with the first giving
refer to sets of positions, e.g., A ⫽ {i, j}. A genome,
denotedG, is the set of all positions in an individual. the allelic effect and the second a label for the allele.
In general, an individual is represented by a vector
With a single diploid locusi, for example, the genome
for a male isG ⫽ {imm,imf}, and for a female it isG⫽ Xcontaining the values of his/her indicator variables
for every position in the genome. It is useful below to
{ifm,iff}. The notation is summarized in Table 1.
Two fundamental kinds of events that occur during extend this vector to include positions from more than
one individual.
the course of a generation areselectionandtransmission.
“Selection” accounts for variation in the contribution The genetic state of a population can be completely
described by a set of statistical moments that we call of different genotypes to the next stage in the life cycle.
Fitnesses are assigned to either individuals or groups, associations. These include associations among genes
within a haploid genome, which are conventionally re-depending on the form of selection. The simplest case
is viability selection, in which case fitnesses are assigned ferred to aslinkage disequilibria.We use the more general
term, however, since we are concerned with associations to individuals. For sexual selection and assortative
mat-ing, we account for the relative contributions of mated among arbitrary sets of positions, which may or may not
be linked and may or may not be in a population that is pairs of male and female genotypes; here fitnesses are
assigned to all possible kinds of pairs (BT91). Thus at equilibrium. Indeed, we need to consider associations
between positions that are in different individuals. The according to our use of the term, with nonrandom
mat-ing there can be selection even when all individual geno- relation between different measures of linkage
disequi-librium is summarized in thediscussion.
types have equal survival, mating success, and fecundity.
Group selection is described by assigning fitnesses to Our notation allows multilocus moments to be
de-fined in a variety of ways. The key quantities that deter-all possible combinations of genotypes that could
com-prise a group. mine the moments are a set ofreference values.There is
one reference value for each position, and the reference By “transmission” we mean an event that changes the
context of a gene. A simple example is meiosis followed value for positioniis denoted℘i. (Note the distinction
between an italicpi, which denotes an allele frequency,
by syngamy: A gene that was carried by a female becomes
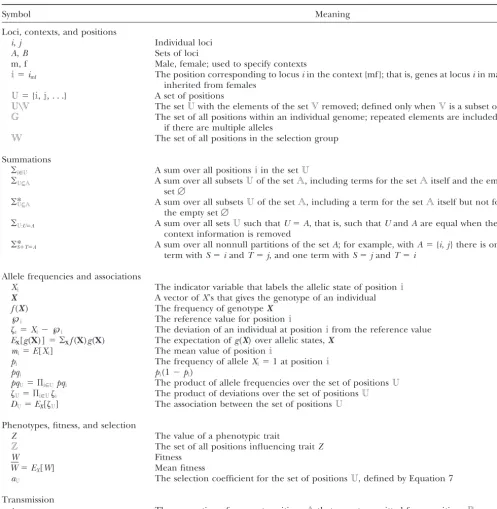
TABLE 1 Summary of notation
Symbol Meaning
Loci, contexts, and positions
i,j Individual loci
A,B Sets of loci
m, f Male, female; used to specify contexts
i⫽imf The position corresponding to locusiin the context {mf }; that is, genes at locusiin males
inherited from females U⫽{i,j, . . .} A set of positions
U\V The setUwith the elements of the setVremoved; defined only whenVis a subset ofU G The set of all positions within an individual genome; repeated elements are included
if there are multiple alleles
W The set of all positions in the selection group
Summations
兺i僆U A sum over all positionsiin the setU
兺U債A A sum over all subsetsUof the setA, including terms for the setAitself and the empty set⭋
兺*U債A A sum over all subsetsUof the setA, including a term for the setAitself but not for the empty set⭋
兺U:U⫽A A sum over all setsUsuch thatU⫽A, that is, such thatUandAare equal when the
context information is removed
兺*S⫹T⫽A A sum over all nonnull partitions of the setA; for example, withA⫽{i,j} there is one term withS⫽iandT⫽j, and one term withS⫽jandT⫽i
Allele frequencies and associations
Xi The indicator variable that labels the allelic state of positioni
X A vector ofX’s that gives the genotype of an individual
f(X) The frequency of genotypeX
℘i The reference value for positioni
i⫽Xi⫺℘i The deviation of an individual at positionifrom the reference value
EX[g(X)]⫽兺Xf(X)g(X) The expectation ofg(X) over allelic states,X
mi⫽E[Xi] The mean value of positioni
pi The frequency of alleleXi⫽1 at positioni
pqi pi(1⫺pi)
pqU⫽兿i僆Upqi The product of allele frequencies over the set of positionsU
U⫽兿i僆Ui The product of deviations over the set of positionsU
DU⫽EX[U] The association between the set of positionsU
Phenotypes, fitness, and selection
Z The value of a phenotypic trait
Z The set of all positions influencing traitZ
W Fitness
W⫽EX[W] Mean fitness
aU The selection coefficient for the set of positionsU, defined by Equation 7
Transmission
tA←B The proportion of genes at positionsAthat were transmitted from positionsB
describe a population, we first make a change of vari- particularly simple meaning for biallelic models.
De-fined that way, if there are no differences in allele fre-ables, such that the allelic state of an individual gene
at positioniis measured relative to the reference value quencies between positions at a locus (e.g., between
males and females), the reference value is equal to the for that position,℘i:
frequency of allele 1 at that locus (℘i⫽℘i⫽pi). The
i⫽ Xi⫺ ℘i. (1)
new indicator variable i then takes the values 1⫺ pi
and⫺pi.
Choice of the reference values is up to the investigator.
Typically it is useful to define℘ias the expected value Next we define the product of all the ’s in the set
of positionsA:
loci are measures of higher-order associations in the population. Following the standard terminology for sta-tistical moments, we say that the associations are “cen-tered” when the reference values are set equal to the current allele frequencies.
Equations 1–3 provide a recipe for translating
geno-typic frequencies into a set of reference values℘and
associationsDthat completely describe the genetic state
of a population. The reverse translation is of course also possible. For example, with biallelic loci and the reference values defined to be equal to the current allele
frequencies (℘i⫽ pi), the frequency of genotypeXis
f(X )⫽
兿
i僆G[Xipi⫹(1⫺Xi)qi]⫹兺*U債G{DU(⫺1)(|U|⫺兺i僆UXi)
兿
i僆G\U[Xipi⫹(1⫺Xi)qi]},Figure 1.—A model of a dioecious population with four
autosomal loci. Open circles are genes inherited from a fe- (4)
male; solid circles are genes from a male. Three of the
associa-tions between the 16 posiassocia-tions are shown. where|U|means the number of positions in setU, and
G\Ustands for the positions in setUthat are left after
those in setVare taken away. The first term in Equation
4, a product that includes one term for each position
A ⫽兿i僆Ai. (2)
in the genome, gives the genotype frequency that would
The symbol僆indicates that the product includes one be found in the absence of any associations. The second
term for each element in the set A. If we choose an term accounts for the effects of the associations.Gis a
individual at random from the population, thenAis a set of all positions in a genome whose sex of carrier is
random variable. The association between the alleles at the same as that of X. Expressions more general than
the positions in setA is defined as the expectation of Equation 4 that allow for multiple alleles and arbitrary
A taken over the whole population, definitions for the reference values can be derived using
results that are developed below.
DA⫽EX[A], (3)
Summations of the kind seen in the second term of Equation 4 make frequent appearances in this article.
whereEX[·] denotes an expectation over the distribution
The sum includes one term for each possible subsetU
of genotype frequencies. The DA are therefore
mo-of positions in the setG, including G itself. When an
ments, that is, measures of statistical association. As an
asterisk appears, as in Equation 4, the sum does not example of the notation, the association between alleles
include a term in which U equals the empty set, ⭋.
at lociiandjin a diploid male, one inherited from his
Thus, ifGconsists of the two positionsiandj, the sum
female parent (mother) and the other from his male
in Equation 4 will have three terms asUtakes on the
parent (father), is writtenDimfjmm. Products over empty
values {i}, {j}, and {i,j}. When the summation symbol is
sets are defined to be 1, so that D⭋ ⫽ 1. The D’s are
not followed by an asterisk, the sum does include a term
the same as BT91’sC’s. Figure 1 illustrates the notation.
in whichU⫽ ⭋.
[We assume here and below that the indicatorsXihave
The notation allows for more than two alleles per scalar values (0 or 1, say). If they are vectors, then the
locus. It does become more complicated in that event, pairwise D{i,j} are matrices, and nth-order associations
however, because the extra degrees of freedom require
are tensors of rankn.]
us to account for associations with repeated positions. The associations have particularly simple
interpreta-With three alleles, for example, the allele frequencies tions when the reference points are chosen to be the
at a position are described by the two variablesDiand
current allele frequencies (℘i⫽pi). Moments for single
Dii. However, when there are only two alleles per locus,
positions vanish:Di⫽0. Associations between pairs of
associations containing repeated positions can be ex-positions are equal to the covariance in the allelic state
pressed in terms of associations with no repeated posi-of genes at those positions. Departures from
Hardy-tions. (This article focuses mainly on biallelic loci, which
Weinberg proportions are measured by D’s involving
is perhaps not a severe restriction as loci can be defined pairs of positions at the same locus that have the same
as single-nucleotide sites. Readers who are interested in sex of carrier but different sexes of origin; for example,
loci with multiple alleles should consult BT91, or the
Dimfimm for locus i in males. When there are no sex
documentation with theMathematicapackages, for more
differences in allele frequencies,Dimfjmfis equal to the
details about those models.) conventional measure of pairwise linkage
disequilib-Two basic equations for simplifying associations for rium (also called gametic phase disequilibrium)
DUii⫽piqiDU⫹(1 ⫺2pi)DUi, ter. Consequently, Equation 6 applies when the trait
under consideration is fitness. BT91 showed that this
2
i ⫽ piqi⫹ i(1 ⫺2pi) (5)
insight is useful because thebcoefficients then take on
special significance: They can be used to calculate how (see BT91, Equation 5). Here and throughout,
expres-sions of the formAB stand for A 傼 B, the union of the genetic state of the population changes.
We noted earlier that fitness (that is, relative repro-setsAandB; thusDUi⫽DU傼i, etc.
The relation between phenotypes and genotypes:This ductive output) can depend on just the genotype of the
individual (as with viability selection), on the genotype notation is sufficiently flexible to allow for any relation
between phenotypes and genotypes. LetZbe the value of a mated pair (as with any form of nonrandom
mat-ing), or on the genotypes of a larger group of individuals of a phenotypic character in an individual. This value
can be written in general as a function of the individual’s (as with kin or group selection). To describe the effects
of selection, we need to consider together the genomes genotype,
of theselection group, by which we mean the set of
individ-Z(X)⫽Z⫹兺A債GbA(A⫺DA)⫹eZ, (6)
uals that interact to determine their mutual fitness. With simple viability selection and random mating, the
selec-whereZis the trait mean in the population and eZis a
random environmental component that is independent tion group is a single individual. Often it is useful to
define the selection group to be a male and female
of genotype and that has mean 0. The A that appear
on the right-hand side are calculated from the genotype mated pair, which allows for nonrandom mating as well
as viability selection. The selection group can be
ex-vectorXon the left using Equations 1 and 2. (Note that
the term in the sum corresponding to the null setA⫽ panded to more than two individuals to accommodate
group selection.
⭋makes no contribution because ⭋ ⫽D⭋⫽ 1.)
Equation 6 can describe any kind of genetic domi- We denote the set of all positions in a selection group
asW. For example, take a selection group consisting
nance, epistasis, sex differences in expression, genomic
imprinting, etc. The relation between genotype and of a male and female in a mated pair. With a single
biallelic diploid locusi, the selection group isW⫽{imm, phenotype is determined by the choice of the
coeffi-cients bA. If there is gene-by-environment interaction, imf,ifm,iff}. With three alleles, the selection group is the
same, but with each element appearing twice.
the b becomes a function of the state of the
environ-ment; it may be convenient to include that environmen- The absolute fitness of a selection group is defined
to be the ratio of its frequency after selection to its tal state as a component of the context. Equation 6 also
applies with multiple alleles, provided that the set G frequency before. When a selection group consists of
more than one individual, its “frequency” before selec-includes the appropriate number of repeated elements.
For example, suppose that there are three alleles at tion is equal to the product of the frequencies of the
genotypes of those individuals. Take, for example, a
locusiand two alleles at locusj.For haploid genotypes,
the setGis then defined as {i,i,j}. The coefficientsbi, selection group consisting of a mated pair of male and
female genotypes. The frequency before selection can
bj,bii,bij,biijare then required to account for the 5 d.f.,
and the setAin the summation of Equation 6 ranges often be taken as the product of the frequencies of
the respective male and female genotypes, since the
over all five distinct subsets ofG.
The bcoefficients can become quite numerous. For premating “groups” are equivalent to randomly chosen
pairs of males and females. The frequency of the selec-example, with just two biallelic loci each with four
possi-tion group after selecpossi-tion is the frequency with which ble contexts (say, two sexes of carrier and two sexes of
those genotypes are found together among all mated
origin), there are 28⫺1⫽255 possiblebcoefficients:
pairs (weighting the pairs by their relative fecundities, 8 corresponding to single positions, 28 corresponding
if they differ). This representation of selection can ac-to pairs of positions, etc. The number of coefficients
count for viability selection within each sex as well as drops dramatically, however, in many cases. With no
nonrandom mating and fecundity selection. epistasis, genotype-phenotype relations can be fully
de-The genotype of the selection group is described by scribed with only 8 distinct coefficients, while with a
the vector X, which includes the allelic state for every
completely additive model (no dominance and no
epis-position in every individual in the group. Denoting the tasis), only 4 distinct coefficients are needed.
frequencies of the group’s genotype before and after selection asf(X) andf⬘(X), the group’s absolute fitness
EVOLUTION BY SELECTION AND TRANSMISSION as W(X), and the population’s mean fitness asW, we
see from Equation 6 that we can always write the ex-Here we use the notation proposed above and results
pected relative fitness of the genotype of a selection from BT91 to find how the genetic composition of a
group in the form population changes over the course of a generation.
We first show how selection and transmission change a
w(X)⫽W(X)
W ⫽
f⬘(X)
f(X) ⫽1⫹兺U債WaU(U⫺DU) (7) population and then end with some statistical
book-keeping.
The coefficientsaAdefined by Equation 7 are called definitions of the selection group will produce the same
results so long as the definition that is chosen is used
selection coefficients. The coefficient aA represents the
force of selection acting on the position in setA. These consistently throughout the calculations.
Given any set of assumptions about how genotypes coefficients can account for any form of selection within
individuals (including dominance, epistasis, and geno- (or phenotypes) affect lifetime fitness, Equation 7 can
be used to calculate the corresponding selection coeffi-mic imprinting) and any form of nonrandom mating.
Note that selection coefficients defined this way typically cients. appendix a presents a simple example of two
loci under epistatic viability selection. When several se-depend on allele frequencies, associations, and
refer-ence values, even if the fitnesses of genotypes are con- lection events occur over the course of a generation,
the job is made easier by calculating coefficients for stant (BT91). If phenotypes include environmental
(nongenetic) components, then the frequencies f( ) each event in isolation and then combining them. For
example, suppose that fitness is the product of viability
andf⬘( ) represent expectations averaging over those
components (see applications). Note that the selec- through two stages of the life cycle, each represented
by Equation 7 but with coefficientsbUandcU. For biallelic
tion coefficients defined by (7) differ from those
de-fined in BT91. Although similar in form, the fitness loci, the overall selection coefficient is
functions are not the same, and so selection coefficients
aU⫽兺V債UbVcU\V. (8)
from our system and that of BT91 cannot be
inter-changed. [To prove Equation 8, writewa(X)⫽wb(X)wc(X), expand
Selection coefficients have simple interpretations. each of thew’s using Equation 7, use Equations 5 to
With biallelic loci, the coefficientaimeasures the force eliminate products of’s, and finally match the
corre-of direct selection acting on positionito increase the sponding coefficients of the ’s on the right and left
frequency of allele 1. Selection coefficients with multi- sides.] In the event of weak selection, the situation can
ple subscripts indicate that those positions have nonad- be simplified further by approximation: If the selection
ditive effects on fitness. For example, dominance at a coefficientsbandcare of orders, thenaU⫽bU⫹cUto
locus i in diploid males is measured by aimfimm. This leading order ins.
coefficient measures the force of selection favoring al- Given the selection coefficients, we can determine
lele 1 at locus i when it appears in two copies, one the state of a population following the selection event.
inherited from a female (the individual’s mother) and BT91 showed how the new allele frequencies and
associ-the oassoci-ther from a male (associ-the faassoci-ther). Nonadditive fitness ations are given by
interactions between loci are represented by selection
D⬘A⫽DA ⫹兺U債WaU(DAU⫺ DUDA). (9)
coefficients that have multiple positions with the same
sex of carrier. The selection coefficientaiffjff, for exam- This is our main result for the effects of selection. We
ple, measures the departure from additivity for the al- see that the change in the associations for positions in
leles at loci i and j that are carried by females and setA, represented here by the second term on the right,
were inherited from females. The effects of nonrandom is equal to a sum of all the selection coefficients acting
mating appear in selection coefficients that include on sets of positions in the population, weighted by the
both male and female sexes of carrier. When there are association between those positions and the ones in setA.
more than two alleles per locus, there are selection Equation 9, which gives the new moments in terms
coefficients that have the same position repeated. [The of the old reference values, can be used to calculate
notation can accommodate a continuum-of-alleles model changes in allele frequencies caused by selection. If we
where there are an infinite number of alleles per locus, choose the reference values to be the allele frequencies
provided that fitness can be approximated by a polyno- before selection (℘
i⫽ pi), then the change in allele
mial function (see BT91). It may not be possible, how- frequency at positioniis equal toD⬘
i. With two alleles
ever, to obtain a good approximation to a continuum- per locus, Equation 9 gives
of-alleles model using a finite set of moments.]
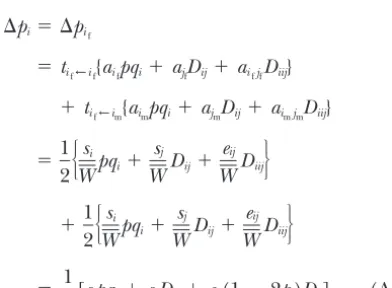
⌬pi⫽D⬘i ⫽兺U債WaUDUi⫽ aipqi⫹兺U債W
U⬆i ,
aUDUi, (10)
Two points about Equation 7 are worth keeping in mind. If the phenotype contains an environmental
com-where
ponent, the relative fitnessw(X) is understood to mean
the relative fitness averaged over that environmental
pqU⬅
兿
i僆Upiqi. (11)variation. Second, the selection coefficients depend on
how the selection group is defined. For example, with On the right side of Equation 10, the first term
repre-sents selection acting directly on alleles at positioni.
random mating the selection group can be defined as
a single individual, and no selection coefficients that The second term represents the effects of indirect
selec-tion: the force of selection acting on other positions include both sexes of carrier appear. But if the selection
group is defined as a mated pair, the fitness function that is transmitted to positionithrough the associations.
Equation 10 gives an exact expression for the change of Equation 7 generates selection coefficients with both
sexes of carrier even under random mating. This dis- in allele frequency at positionicaused by selection. If
all positions at locusiare equivalent, then this is equal
TABLE 2
to the change in allele frequency at that locus. If not,
the overall change at locus iis found by averaging⌬pi Examples of transmission coefficients under meiosis
over all the positions at that locus. (Note, however, that and syngamy
the average allele frequency is not sufficient to fully
describe the population.) Haploid autosomes
tif←im⫽
1⁄ 2
Transmission:“Transmission” refers to an event that
tifjf←imjf⫽rij/2
changes the contexts of genes. Obvious examples are meiosis, where a gene carried by a diploid individual
Diploid autosomes
becomes a gene in a haploid individual (the gamete), t
ifm←imm⫽
1⁄ 2
and fertilization, where the reverse transition happens. t
ifmjfm←imfjmm⫽r
m
ij/2
Migration can also be considered as a form of transmis- t
Amf←Afm⫽(1⫺rfA)/2
sion, since genes change their context as they move from
Sex linkage in diploids: lociiandjX-linked,kautosomal
one location to another. The effects of transmission
tim←im⫽0
on the state of the population are determined by the
tifmjfm←imfjmf⫽1 transmission coefficients.The transmission coefficienttA←B
tiffjff←ifmjfm⫽(1⫺r
f
ij)/2
is defined simply as the probability that the positions
tifmkfm←imfkmf⫽
1⁄ 2
in setA were inherited from positions in setB. (Note
that this is generally not the same as the probability that
the positions in setBare transmitted to setA.)
To clarify the meaning of these coefficients, consider
autosomal loci in a haploid population with two sexes. and associations) that describe a population is simple.
The transmission coefficienttim←ifis the probability that Equation 3 implies that the moments after transmission,
a gene at locusiin a male was inherited from a gene at D″A, are then just a linear combination of the moments
locusiin a female and is therefore1⁄2. The transmission before, D⬘
A. When the reference values are chosen to
coefficientt{im,jm}←{if,jf}is the probability that the genes at be equal for positions at each locus, the effect of
trans-lociiandjin a male were both inherited from a female mission is particularly simple:
(the mother), which is (1⫺rij)/2, whererijis the
recom-D″A⫽兺U:U⫽AtA←UD⬘U. (12)
bination rate between lociiandj.
There are three constraints on transmission coeffi- This is our main result for the effects of transmission.
cients. First, transmission coefficients are zero unless The summation is over all sets of positionsUthat could
each position in setAhas a corresponding position in become setAfollowing transmission. The notation “U:
set Bfrom which it descended. This implies that sets U⫽ A” means that UandA must be equal when the
AandBmust be equal when the context information context information is stripped from them, that is, when
is stripped from all of their positions; that is, tA←B ⫽ 0 U⫽A.(Taking the example of dioecious diploids, with
ifA⬆B.(For example,tiff←jfm⫽0 becausei⬆j; a gene A ⫽ ifm, the sum in Equation 12 has four terms atU
at locusicannot be descended from a gene at locusj.) takes the values iff, ifm, imf, and imm.) This requirement
Second, the coefficients representing transmission to follows from the first constraint on transmission
de-any given setA must sum to 1. (In the notation intro- scribed above. Equation 12 needs modification if
differ-duced below, 兺B:B⫽AtA←B ⫽ 1.) A third constraint on ent positions at the same locus have different reference
the coefficients applies when transmission represents values, as discussed in Changing reference values below.
recombination, segregation, and/or syngamy. Then the The two-locus example presented inappendix ashows
sex of origin for each position in setAmust equal the how transmission coefficients are used in calculating
sex of carrier for the corresponding position in setB, changes in allele frequencies.
since that is the sex of the parent from which a gene Equation 12 can be easily generalized to allow
differ-in setAdescended. ent genotypes to follow different transmission rules.
Ex-Transmission coefficients often involve recombina- amples include cases where there is meiotic drive or
tion between groups of more than two loci. We userA genetic variation in recombination rates. As in Equation
to denote the probability that recombination occurs 6, we write the transmission coefficients as a polynomial
somewhere in the set of loci A; that is, the alleles at function of genotype,
those loci passed to a gamete are a mixture of those
tA←U(X)⫽tA←U⫹兺V債T␦tA←U|V(V⫺D⬘V), (13)
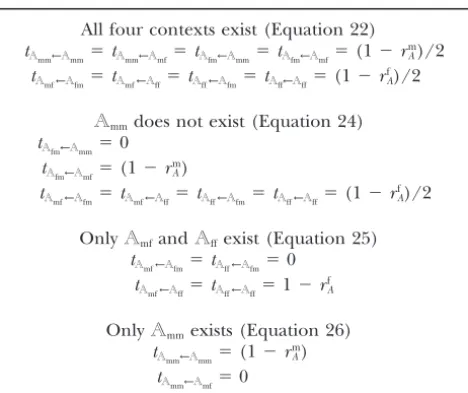
inherited from the individual’s mother and father. Ta-ble 2 gives the transmission coefficients for several cases
of interest, including autosomes, X-linked loci, and cyto- whereTis the set of all positions that influence
trans-mission. The transmission coefficienttA←Uis the mean
plasmic factors.
Many models assume that there is no genetic variation probability that genes at positions A were inherited
from positionsU, averaged over all genotypes. The
coef-for the rules of transmission. In that case, the effect of
Von the transmission coefficienttA←U, in the same way last expression is the main result for changing reference
values.
that the selection coefficient aV represents the effects
The previous section notes that the transmission
of the setVon fitness. To find the effects of transmission
equation (12) does not hold when different positions on the associations, substitute (13) into (12) and then
at the same locus have different reference values (that average over all genotypes:
is,℘i⬆℘jfor somei⫽j). In that case, the associations
D″A⫽ EX[兺U:U⫽AtA←U(X)U] between positions before transmission must be adjusted
to the reference values for the positions that those genes
⫽ 兺U:U⫽AtA←UD⬘U⫹兺U:U⫽A兺V債T␦tA←U|V(D⬘UV⫺ D⬘UD⬘V)
will occupy after transmission, (14)
D″A⫽兺U:U⫽AtA←U兺U債A[D⬘A\U
兿
i僆U(℘i⫺ ℘i*)], (16)
(cf. Barton1995, Equation 3). This equation can be used to study the evolution of alleles that modify the
where℘i* is the reference value for the position in set
transmission system, for example, by altering
recombi-Athat corresponds toiin setU.
nation rates or the breeding system. In fact, Equation
With the exception of random drift, all of genetic 14 is similar to Equation 9, which describes the effect
evolution can be concisely represented by two equa-of selection. One can think equa-of selection as a special
tions: Equation 9 for the effects of selection and other form of genotype-dependent transmission, where the
deterministic forces and Equation 12 or 16 for the ef-transmission is between corresponding positions at
con-fects of transmission. These can be supplemented by secutive stages in the life cycle and where the
transmis-Equation 15, which does the bookkeeping needed to sion coefficients are just the relative fitnesses.
ensure that the associations have a simple
interpreta-Changing reference values:As described earlier, our
tion. Other deterministic forces, like mutation and system of describing a population is defined relative to
migration, can also be described by these equations. a set of reference values. The investigator is free to leave
Mutation can be represented as a form of frequency-these fixed or to change them as often as desired. It
dependent selection and migration as a form of trans-is often convenient, however, to change the reference
mission (since genes change their contexts when they values once per generation. By updating the reference
move). It is easier to find the effects of mutation directly, values to the current allele frequencies, the associations
however, which we do below. Before doing that, how-have simple interpretations, and we can calculate the
ever, we develop an approximation that greatly simpli-per-generation changes in allele frequencies. Moreover,
fies the equations for selection and transmission. updating only once per generation avoids a
prolifera-tion of alegebra, involving reference values at
intermedi-ate stages that eventually cancel. Sometimes it is conve- THE QLE APPROXIMATION
nient to update the reference values at the zygote stage.
The recursions derived above can be used to calculate Alternatively, it may be easiest to update them before
the exact dynamics for a wide range of multilocus popu-transmission, since under normal meiosis (no meiotic
lation genetic models. Although this approach may give drive, etc.) allele frequencies are unchanged and the
more insight than directly following genotype frequen-change in associations caused by transmission often
cies, it will not necessarily be any more tractable. That takes a simple form when the associations have already
is because exact results require following the dynamics been centered. If we are interested only in finding the
of the same number of variables, regardless of whether evolutionary equilibrium, changing reference values
they are genotype frequencies or moments (that is, al-from one generation to the next is not an issue.
lele frequencies and associations). One of the great Changing the reference values changes the
associa-appeals of the moment-based approach introduced by
tionsD, because the latter are defined in terms of the
BT91 is that in some situations expressions for the associ-former. Denote the associations before and after the
ations can be greatly simplified by approximation. In
change asD″A andDA, respectively, and the reference
this section, we derive approximate expressions for the values before and after as℘″i and℘i. (If the reference
associations and changes in allele frequencies when the values have not been changed since the start of the
population is in a state of QLE. The concept was
intro-generation, then℘″i ⫽℘i.) The associations after the
duced by Kimura (1965) and greatly generalized by
reference values change are found using Equations 1–3:
Nagylaki(1993) andNagylakiet al.(1999); a concise
DA⫽EX[兿i僆A(Xi⫺℘i)]⫽EX[兿i僆A(Xi⫺℘″i)⫹(℘″i ⫺℘i)] summary of those results is given inBu¨ rger(2000, p. 82). The first fundamental assumption we must make is
⫽兺U債A兿i僆U(℘″i ⫺℘i)EX[兿j僆A\U(Xj⫺℘″j)] that all the associationsDare of ordera, by which we mean that they are not larger than a constant factor
⫽兺U債A[D″A\U兿i僆U(℘″i ⫺℘i)]. (15)
times the largest of thea’s. BT91 shows that this
condi-Because the sum in (15) is not asterisked, it includes tion is met when the forces that generate associations
within a sex (epistasis, migration, etc.) are weak relative
to recombination and when nonrandom mating is not D⬘A ⫽DA⫹ 兺*U債WaUDUA⫹ O(a2)
strong. An intuitive justification is that the associations ⫽
DA⫹ aApqA⫹ O(a2), (17)
are produced by evolutionary forces that are of order
a (see Equation 9) and will not accumulate to values whereAis a set of distinct positions andpq
Ais defined
that are much larger than that if the forces breaking by Equation 11. The asterisked 兺* indicates that the
them down (recombination, segregation, and muta- sum does not include the term withU⫽ ⭋; it has been
tion) are sufficiently strong. The second assumption separated out to give the first term,D
A.
needed for the QLE approximation is that all the selec- The first step of Equation 17 follows from Equation
tion coefficientsaareⰆ1. BT91 shows that when these 9 because theDare of orderaand therefore the term
two conditions hold, a population rapidly settles into a a
UDUDA in Equation 9 is of order a3 and so can be
state where the allele frequencies are changing slowly, neglected. The second step follows because the term
and the associations are close to the equilibrium values a
UDUA in the first line is of ordera2except whenU⫽
they would reach if the allele frequencies were in fact A, in which event the reduction formula Equation 5
stationary (see also Nagylaki1993). We can then ne- gives usD
UA⫽ DAA⫽pqA ⫹O(a).
glect terms involving higher powers of thea’s and also The effect of changing reference values can also be
higher powers of theD’s (because they are of ordera). simplified. Equation 10 shows that the change in the
Furthermore, the effects of a series of events of selec- allele frequencies is of order
a.If we define the
refer-tion, migrarefer-tion, and mutation can be added together,
ence values to be the allele frequencies, then the
quanti-provided they are each of order a (Kirkpatrick and
ties (℘″i ⫺℘i) that appear in the product in Equation
Servedio 1999).
15 are of ordera.That equation therefore reduces
sim-Approximations for the associations:We assume that
ply to DA ⫽D″A ⫹O(a2), meaning that the effect of
there are two alleles at each locus, which simplifies the
updating the reference values can be neglected. Assume analysis. The approach can be extended to multiple
that differences between positions at the same locus are alleles following the leads of BT91. The main results
O(a), which holds under normal sexual inheritance.
developed below are illustrated with a simple two-locus
With help from Equations 12 and 17 we then get the full
example inappendix a.
recursion for the associations over an entire generation: Consider a life cycle in which we define the reference
values to be the allele frequencies at the zygote stage. D
A⫽ 兺U:U⫽AtA←U(DU⫹ aUpqU). (18)
A series of selection events occur during the course of
the generation. The generation ends with transmission, On settingDA⫽DA ⬅D˜, we get a QLE approximation
creating the zygotes for the next generation. We seek for the associations that is accurate to orderO(a):
to derive an approximation for the dynamics of allele
DˆA⫽ 兺U:U⫽AtA←UD˜U⫹兺U:U⫽AtA←UaUpqU. (19)
frequencies that is accurate up to (and including) terms
of ordera2, which we denoteO(a2). From Equation 10,
The first sum on the right is zero if the positions inA
we see that approximation requires in turn that we find
include more than one sex of origin. That is because if
an approximation for the associationsDthat is accurate
Aincludes more than one sex of origin, thenUin the
to ordera.To do that we find the values that give an
first sum would have to include more than one sex of
equilibrium for the recursion equations for theDthat
carrier. ButDUis of ordera2if the positions inUinclude
are accurate to order a; those solutions are our QLE
both sexes of carrier, since it represents associations approximations for the associations. The results apply
between alleles in two randomly chosen zygotes. not just to selection but to other deterministic forces
Equation 19 is the main result of this section. It gives that generate associations (such as migration) so long
the solutions for the associations implicitly: The QLE as they are weak relative to recombination and
segrega-value D˜A on the left side depends on the QLE values
tion. To simplify the derivations, we assume that there
for the other associations, which appear as D˜Uon the
is no genetic variation in the transmission coefficients,
right side. The relationship is linear (because of the
an assumption that could be relaxed (see Barton
linear form of the transmission Equation 12), and so 1995). However, we must assume that the transmission
the solution can always be found using standard matrix
coefficients are sufficiently large that forces of ordera
algebra. Thus the D˜ can be calculated directly, using
do not eventually generate strong associations. (This
standard matrix methods, given a set of transmission requires that the largest of absolute values of the
selec-rules that specify thet’s, a set of allele frequencies from
tion coefficientsais much smaller than the smallest of
which we can calculatepqU, and a set of selection
coeffi-the absolute values of coeffi-the eigenvalues of coeffi-the matrix of
cientsa.We have implicitly assumed here that the
selec-transmission coefficientstA←U.)
tion coefficients are constant in time, but the approach To begin deriving an approximate recursion for the
can be generalized to changing environments (see BT91,
D, Equation 9 gives the cumulative effect of selection
Appendix B; Barton 1995, Appendix 4). Briefly, the
and other deterministic forces on the associations
selection coefficients that are discounted by terms like allele’s sex of origin does not affect its expression). The approach outlined here can be directly extended to
exp(⫺rAt). If, however, the environment changes on
a time scale that is slow relative to the rate at which allow for more than two sexes, as might be appropriate
to describe a population with partial selfing. associations are changed by transmission, then the
re-sults given above apply. Careful consideration of Equation 19 shows that the
associations fall into three cases. Case 1 are associations The next two sections illustrate how to do this by
carrying out the calculations for autosomal genes in among a set of positionsAthat include both sexes of
carrier. The QLE approximation for these associations dioecious haploids and for autosomal, sex-linked, and
cytoplasmic genes in diploids. is simplyD˜A⫽0. That is because these represent
associa-tions between genes in two or more randomly chosen
Autosomal genes in haploids:The QLE approximation
for autosomal inheritance in a haploid population with zygotes.
Case 2 are the associations between a set of positions two sexes was found by BT91. This section rederives
their result to illustrate the new notation and how to that all have the same sex of carrier, but some have a
male and others a female sex of origin. This kind of use Equation 19 to find a QLE approximation.
The context for each gene now contains only its sex association exists for some sets of positions (for
exam-ple, autosomal), but not others (for examexam-ple, sets with of carrier. That is because an individual carries only one
gene at each locus, rather than the two that must be only cytoplasmic loci). If they do exist, Equation 19 gives
the QLE approximation distinguished in the case of diploids. The comments
following Equation 19 imply that for this case the first
D˜A⫽兺U:U⫽AtA←UaUpqU. (21)
sum on its right side reduces to (tA←AfD˜Af⫹tA←AmD˜Am),
whereAf stands for setA with the sexes of carrier for These associations come from nonrandom mating in
all its positions converted to f and similarly forAm. The the previous generation: Associations between genes
associations among a set of autosomal loci are equal in with different sexes of origin within an individual appear
male and female zygotes, so D˜Af⫽D˜Am, and further when there are correlations between the genotypes of
those quantities must be equal toD˜Aon the left side of mating males and females in the previous generation.
Equation 19 because all the positions inA must have These associations, which include Hardy-Weinberg
dis-the same sex of carrier. With no sex differences in re- equilibria (an excess or deficit of heterozygotes), are
combination we have tA←Af⫽tA←Am⫽(1⫺ rA)/2, zero under random mating because then the selection
where (1⫺rA) is the probability that the loci in setA coefficients for positions with both sexes of carrier are
are not broken apart by recombination, and the factor of order a2. The transmission coefficient t
A←U can be
of 1⁄2 accounts for the probability that genes in set A
translated into recombination rates according to the
were inherited from a given parent. way that the genes in setAare inherited, as discussed
Putting those facts together gives the QLE approxima- above in the section on transmission.
tion Case 3, the last category of association, is when all
positions in A have the same sex of carrier and all
D˜A⫽
1
rA
兺U:U⫽AtA←UaUpqU⫹ O(a2). (20) have the same sex of origin. Here DA represents an
association among genes within a single individual that were inherited from the same parent. The QLE approxi-This is equivalent to BT91’s Equation 25. Some
superfi-mations for this case depend on how the genes in set cial differences are caused by three changes in notation.
Aare inherited. They can be calculated by first writing
Their result is expressed in terms of recombination rates
out Equation 19 for the associations that do exist, given rather than transmission rates. Second, BT91 separately
the mode of inheritance, out of the four possible cases defined within-male, within-female, and between-sex
D˜Aff,D˜Afm,D˜Amf, andD˜Amm, where, for example,Afmmeans (nonrandom mating) selection coefficients; all of these
that all positions in setAhave a female sex of carrier
are included in the sum on the right side of Equation
and a male sex of origin. Inspection of the transmission 20. Last, they counted separately selection coefficients
coefficients reveals that these expressions do not de-with different permutations of the same set of positions,
pend on any associations that do not exist (e.g., D˜Afm
which generates the combinatorial terms in their
ex-does not depend onD˜Ammwhen all genes in setA are
pression.
Autosomal, sex-linked, and cytoplasmic genes in diploids: X-linked, becausetAfm←Amm⫽0). Last, solve the resulting
equations. That procedure leads to the following results Now consider autosomal genes in a diploid population
with two sexes. The context for a gene now includes for autosomal, X-linked, Y-linked, and cytoplasmic
genes. The transmission coefficients used in the calcula-both its sex of carrier and sex of origin. We allow for
nonrandom mating and sex differences in selection and tions are shown in Table 3.
When all the genes in set Aare autosomal, all four
recombination. To simplify the calculation, however,
we assume that there is no genetic variation in recombi- of the possible case 3 associations exist. Solving Equation