DOI: 10.1534/genetics.110.116087
Expression Quantitative Trait Loci: Replication,
Tissue- and Sex-Specificity in Mice
Atila van Nas,* Leslie Ingram-Drake,
†Janet S. Sinsheimer,* Susanna S. Wang,
‡Eric E. Schadt,
‡Thomas Drake
§and Aldons J. Lusis*
,†,**
,††,1*Department of Human Genetics,†Department of Medicine and**Department of Microbiology, Immunology and Molecular Genetics,
††Molecular Biology Institute,§Pathology and Laboratory Medicine, David Geffen School of Medicine, University of California,
Los Angeles, California 90095 and‡Department of Genetics, Rosetta Inpharmatics, a wholly owned subsidiary of Merck & Co. Inc., Seattle, Washington 98109
Manuscript received February 28, 2010 Accepted for publication April 16, 2010
ABSTRACT
By treating the transcript abundance as a quantitative trait, gene expression can be mapped to local or distant genomic regions relative to the gene encoding the transcript. Local expression quantitative trait loci (eQTL) generally act incis(that is, control the expression of only the contiguous structural gene), whereas distal eQTL act intrans. Distal eQTL are more difficult to identify with certainty due to the fact that significant thresholds are very high since all regions of the genome must be tested, and confounding factors such as batch effects can produce false positives. Here, we compare findings from two large genetic crosses between mouse strains C3H/HeJ and C57BL/6J to evaluate the reliability of distal eQTL detection, including ‘‘hotspots’’ influencing the expression of multiple genes intrans. We found that.63% of local eQTL and
.18% of distal eQTL were replicable at a threshold of LOD.4.3 between crosses and 76% of local and
.24% of distal eQTL at a threshold of LOD.6. Additionally, at LOD.4.3 four tissues studied (adipose, brain, liver, and muscle) exhibited.50% preservation of local eQTL and.17% preservation of distal eQTL. We observed replicated distal eQTL hotspots between the crosses on chromosomes 9 and 17. Finally,.69% of local eQTL and.10% of distal eQTL were preserved in most tissues between sexes. We conclude that most local eQTL are highly replicable between mouse crosses, tissues, and sex as compared to distal eQTL, which exhibited modest replicability.
G
ENETIC variations in gene expression contribute to the molecular architecture underlying complex diseases such as atherosclerosis, diabetes, and cancer (Lusis et al. 2008). Detection of gene expression insegregating populations has led to the identification of expression quantitative trait loci (eQTL) (Damerval et al. 1994;deVienneet al. 1994; Machlederet al. 1997).
Global mapping of gene expression provides a useful form of functional variation for positional cloning and can facilitate the modeling of causal interactions and biologic networks (Schadtet al. 2005; Ghazalpouret al.
2006; Rockman and Kruglyak 2006; Cookson et al.
2009; Montgomeryand Dermitzakis2009).
Distinguishing between local (sometimes termed ‘‘cis’’) and distal (sometimes termed ‘‘trans’’) eQTL enhan-ces our understanding of the candidate genes underly-ing the disease phenotype. Due to their close proximity, genetic variants underlying local eQTL most likely affect molecular mechanisms involved in transcription,
splic-ing, or mRNA decay, and most act in cis (Dosset al.
2005). Distal eQTL, on the other hand, generally consist of variants that act intrans. One variety oftrans-eQTL, termed ‘‘hotspots,’’ regulates the levels of many different transcripts. For example, one mouse study identified genetic variants influencing the transcription factor RUNX1 affecting the gene expression of a group of distal genes involved in the RUNX1 pathway (Bystrykh et al. 2005). Distal eQTL are of particular interest to complex trait studies since they may perturb entire pathways and mediate complex gene–gene and gene– environment interactions. An important example of a
trans-effect relevant to complex disease is sex (vanNas et al. 2009), as QTL studies of males and females have detected striking sex–gene interactions (Wang et al.
2006; Lusiset al. 2008).
In this study, we evaluated the reproducibility of eQTL detection of two large genetic crosses of mouse strains C3H/HeJ and C57BL/6J. We chose these genetic crosses, which had been developed for other studies, because they were quite similar in overall design as well as genetic backgrounds. We evaluated transcript levels in adipose, brain, liver, and muscle of both sexes. The results have both practical and basic importance. A complication with human studies is the difficulty of
Supporting information is available online athttp://www.genetics.org/ cgi/content/full/genetics.110.116087/DC1.
1Corresponding author:University of California, Med-Cardio/Microbio
Box 951679, 3730 MRL, Los Angeles, California 90095-1679. E-mail: [email protected]
Figure1.—Replication of local (a) and distal (b) eQTL between crosses. The percentage of eQTL that replicated between crosses at various LOD thresholds is depicted in adipose, brain, liver, and muscle tissue. The eQTL at LOD.2.7, 4.3, and 6 of the mouse crosses were screened for detection at LOD.2.7 in their respective comparison crosses. The percentage indicates the degree of replication of eQTL at LOD.4.3 in cross I that overlap in cross II at LOD.2.7 over the total number of eQTL at LOD.4.3 detected in cross I and vice versa. For example, at LOD.6,.80% of the local eQTL in cross I were preserved in cross II of the adipose tissue.
procuring samples from tissues of interest. Thus an important question is whether accessible tissues such as blood cells act as a proxy for less accessible tissues. A recent human study of several tissues concluded that conservation of eQTL between tissues was low (Dimas et al. 2009). Our results are in agreement for distal eQTL, but they show high conservation of local eQTL. Our results also provide data relevant to basic questions such as conservation of biologic networks between tissue, the global nature of genetic regulation, and the basis of sex differences.
MATERIALS AND METHODS
Mouse inbred strains C57BL/6J and C3H/HeJ F2
re-ciprocal intercross:A murine F2population consisting of300
mice was generated by intercrossing F1mice of parental strains
C57BL/6J (B6) and C3H/HeJ (C3H). Mice were fed a chow diet containing 4% fat until 8 weeks of age and then were placed on a ‘‘Western’’ diet containing 42% fat and 0.15% cholesterol for 12 weeks. After a 12-hr fast, the mice were anesthetized by isoflurane for retroorbital sinus blood collec-tion and subsequently killed at 20 weeks of age for tissue collection of adipose, whole brain, liver, and muscle. The mice were genotyped at1500 single-nucleotide polymorphisms (SNPs) uniformly distributed over the mouse genome at an average density of 1.5 cM (Table 1 andFile S1).
Mouse inbred strains C57BL/6J ApoE/ and C3H/HeJ ApoE/ F
2 intercross data set: The genotype and gene expression data from adipose, brain, liver, and muscle of the F2mouse population used in this study have been previously
described (Wang et al. 2006). The C57BL/6J ApoE/ (B6.ApoE/) parental strains were purchased from Jackson
Laboratory (Bar Harbor, ME) and the C3H/HeJ ApoE/
(C3H.ApoE/) parental strains were generated by
backcross-ing B6.ApoE/to C3H for 10 generations. The C3H.ApoE/
parental strains were genotyped using 1300 markers throughout the genome and there was no evidence of contaminating regions. Since the B6.ApoE/parental strains
were purchased from Jackson labs ( JAX), no additional genotyping was performed to confirm the purity of the background strains. The region flanking the ApoE gene is derived from strain 129 in both parents. We previously showed that in ApoE/ from JAX the region extended 5–10 Mb
proximal and 15–20 Mb distal to the ApoE gene (Lusiset al. 2007). This region did not contain any significant or suggestive (LOD.2.7) eQTL in the wild-type cross.
The F2 mouse population consisting of 334 mice (169
female, 165 male) was generated by intercrossing F1mice of
parental strainsB6.apoE/ and
C3H.apoE/. Mice were fed
chow diet containing 4% fat until 8 weeks of age and then were placed on a Western diet containing 42% fat and 0.15% cholesterol for 16 weeks. After a 4-hr fast, the mice were anesthetized by isoflurane for retroorbital sinus blood collec-tion and subsequently killed at 24 weeks of age for tissue collection of adipose, whole brain, liver, and muscle. The mice were genotyped at1300 SNPs uniformly distributed over the mouse genome at an average density of 1.5 cM (Table 1 andFile S2).
Gene expression analysis: The RNA and microarray pro-cessing, as previously described (Heet al. 2003), was performed at Rosetta Inpharmatics (Seattle, WA). The custom ink-jet microarrays (Agilent Technologies, Palo Alto, CA) contain 2186 control probes and 23,574 noncontrol oligonucleotides
extracted from mouse Unigene clusters and combined with RefSeq sequences and RIKEN full-length clones. Total RNA was extracted from homogenized mouse tissues with Trizol reagent (Invitrogen, Carlsbad, CA) according to the manufacturer’s protocol. Labeled cDNA with either Cy3 or Cy5 was hybridized to at least two microarray slides with fluor reversal and sub-sequently scanned using a laser confocal scanner. Gene expression changes between two samples were quantified on the basis of spot intensity relative to background, adjusted for experimental variation between arrays using average intensity over multiple channels, and fit to an error model to determine significance (type I error). Gene expression is reported as the ratio of the mean log10intensity (ml ratio) relative to the pool
derived from 150 mice randomly selected from the F2
pop-ulation. Gene expression data from mice with complete genotype data and at least 95% complete phenotype and array data were used. The microarray data from this study have been deposited in the Gene Expression Omnibus (GEO) under accession nos. GSE2814, GSE3086, GSE3087, GSE3088, GSE11065, GSE11338, GSE12795, and GSE12798.
eQTL replication analysis:The eQTL within a cross (sex as an interactive covariate) and in female and male mice were calculated utilizing the scanone function in RQTL. One thousand permutations of n¼ 500 randomly chosen gene transcripts resulted in a significance threshold of LOD.6. Genes with eQTL of LOD.2.7 were selected for replication comparison between the crosses, tissues, and sexes. An eQTL detected within 10 Mb from the nearest marker of the gene was identified as a local eQTL, whereas an eQTL outside of 10 Mb from the nearest marker of the gene was defined as a distal eQTL. The eQTL with the highest LOD score per chromo-some was chosen for the analysis. For each comparison between crosses, tissues, and sex, the degree of overlap was calculated by ascertaining if the eQTL detected in one group at LOD.4.3 or LOD.6 can be detected at LOD.2.7 in the other group. Specifically, the percentage of overlap was calculated as the number of genes with eQTL of LOD.4.3 or LOD.6 of one group that intersect with eQTL at LOD
.2.7 of the comparison group over the total number of genes with LOD.4.3 or LOD.6 of the first group. The groups that were compared for their eQTL were as follows: Ivs.II; adipose vs.brain, adiposevs.liver, adiposevs.muscle, brainvs.liver, brainvs.muscle, and livervs.muscle; and malevs.female.
The reasons we chose to present our replication results using a less stringent threshold are the following:
1. Replicating a specific genetic linkage or association re-quires much more power than finding any significant result in the first place when there are multiple genes that affect trait values. Brian Suarez and colleagues (Suarez et al. 1994) nicely demonstrate this property and others have also demonstrated this same principle. Suarez and colleagues argue that in the initial study, a successful result is the detection of any one (or a few) of a number contributing genes but in the replication a successful result is the much harder problem of finding this (these few) same gene(s) again. A related problem is that the significance of the results in the first cross are actually inflated (the winner’s curse problem) and so are more difficult to replicate. Thus we use a lower threshold for the second, replication cross. 2. The reason for using such a high threshold for the first cross is that we are conducting thousands of tests and need to adjust our significance level accordingly to avoid a severe multiple-testing problem. In the replication, however, we are effectively looking at the limited number of regions that were near significant findings from the first cross; thus the number tests is reduced and we can use a less severe adjustment for multiple testing.
We defined an eQTL hotspot by the highest relative frequency of eQTL at LOD$5.7. Specifically, we searched for loci with eQTL greater than or equal to three standard deviations above the average frequency of distal eQTL in one tissue. The following thresholds were used to detect hotspot loci: adipose$10, brain$20, liver$13, and muscle$8.
RESULTS
To investigate the extent of eQTL preservation, we de-termined the degree of overlap between two mouse crosses (cross I and cross II) of inbred strains C57BL/6J and C3H/ HeJ. Integrating the genotype and gene expression trait data, we utilized the linkage software RQTL cartographer and calculated the eQTL in the adipose, brain, liver, and skeletal muscle tissue of the crosses. We used LOD.4.3 as a threshold of significance, LOD.2.7 as a suggestive threshold, and LOD
.6 as a high threshold of significance. We chose significance thresholds at a suggestive, a significant, and a high LOD score to capture the commonly used thresholds to determine if these lead to reasonable replication in eQTL studies. The thresholds LOD.4.3 and 2.7 were chosen on the basis of a previous study by Lander and Kruglyak, who reported the number of false positives detected in a QTL at various significance thresholds (Landerand Kruglyak1995). Specifically, a LOD.4.3 was defined as the baseline of significance, which is approximately equivalent to aP-value,105, whereas LOD.2.7 is equivalent
to aP-value,103, reflecting a more suggestive threshold. The
threshold LOD.6 was chosen on the basis of the results of permutation (n¼1000) we performed in this analysis onn¼ 500 randomly chosen transcripts.
For each eQTL at the various LOD score thresholds, we determined if it was detected in both crosses. The eQTL in one cross was considered replicated if it was detected within 10 Mb of an eQTL in the other comparison cross of the same tissue. In this study, local eQTL were defined as loci containing the gene of the transcript abundance that maps within 10 Mb of the nearest QTL. To determine the degree of local and distal eQTL that replicated, we calculated for each LOD score threshold the percentage of eQTL that overlap between the crosses, tissues, and sexes. The eQTL hotspots were determined by the enrichment of gene expression traits that mapped to the same loci.
Replication of local eQTL between crosses:To investigate the degree of local eQTL replication in the mouse crosses, we determined what percent of the local eQTL at LOD.4.3 or LOD.6 in one cross could be detected in the other cross at LOD . 2.7. We compared the crosses in this way in both directions, and the results were highly consistent. At LOD.
4.3, our results showed .60% of the local eQTL replicated (63–76%) across all the tissues of the mouse crosses I and II. At LOD.6,.76% of the local eQTL between crosses I and II replicated at this LOD score threshold, reaching as high as 80% replication (83–86%) in brain, liver, and muscle tissue (Figure 1 and supporting information,Table S1).
Figure 4.—Replication of distal eQTL between crosses at different signifi-cance thresholds. The per-centage of eQTL that replicated between crosses at various LOD thresholds is depicted in (a) adipose, (b) brain, (c) liver, and (d) muscle tissue. The eQTL at LOD.2.7–10 of the mouse crosses were screened for detection at LOD .2.7–10 in their re-spective comparison crosses. The heat map re-flects the degree of replica-tion as the percentage of eQTL at various LOD thresholds in cross I that overlap in cross II at vari-ous LOD thresholds and vice versa. For example, in adipose tissue (a), 80% of eQTL at LOD. 2.7 in cross II were detected in cross I (bottom right cor-ner).
Replication of distal eQTL between crosses:To determine the degree of replication of distal eQTL, we ascertained the number of distal eQTL at LOD.4.3 or LOD.6 in one cross that could be detected at LOD.2.7 in the other cross. At LOD
.4.3, we detected.18% replication of distal eQTL over all tissues between crosses I and II, with.21% in brain, liver, and muscle. At LOD.6 the degree of replication among distal eQTL was greater. Over 25% of the distal eQTL replicated across tissues, reaching .30% in liver and .40% in brain (Figure 1 andTable S1).
Preservation of local eQTL across tissues: To explore the degree of replication of local eQTL across tissues, we used the same screening strategy as above. At LOD.4.3,50% of the local eQTL were preserved in tissues. The muscle tissue exhibited the highest degree of preservation (56–66%) com-pared to the other tissues (adipose, 52–65%; liver, 51–58%) and the brain the lowest degree of preservation (50–56%). At LOD.6, we observed a similar pattern of preservation,.56% of local eQTL muscle (63–73%), adipose (62–74%), liver (59– 65%), and brain tissues (56–61%) (Figure 2 andTable S2).
Preservation of distal eQTL across tissues:To investigate the degree of distal eQTL replication across tissues, we screened each distal eQTL at LOD.4.3 and LOD.6 for detection in the comparison tissue at LOD.2.7. At LOD.
4.3, 18% of the distal eQTL were detected across tissues. Muscle showed the highest preservation (20–22%) compared to the other tissues (adipose, 19–23%; brain, 19–22%; and liver, 18–21%). At LOD .6 the preservation of distal eQTL was adipose, 23%; brain, 26%; liver, 21%; and muscle, 28% (Figure 2 andTable S2).
Preservation of local eQTL between female and male mice:To investigate how sex affects the degree of preservation of eQTL, we determined if eQTL at LOD.4.3 and LOD.6 in female mice were detected at LOD.2.7 in male mice and vice versa. At LOD.4.3,70% of the local eQTL were preserved between female and male mice: adipose, 69–75%; brain tissue, 79–85%; liver, 77–80%; and muscle, 75–83%. At LOD . 6,
.79% of local eQTL (79–92%) were preserved between male and female mice in all tissues: adipose, 79–85%; liver and muscle tissue, 84–91%; and brain, 87–92% (Figure 3 andTable S3).
muscle, 10–16%. At LOD.6,.25% of the distal eQTL were preserved across tissues between females and males, with the exception of female adipose tissue in cross I: adipose, 15–30%; brain, 48–73%; liver, 34–49%; and muscle, 33–36% (Figure 3 andTable S3).
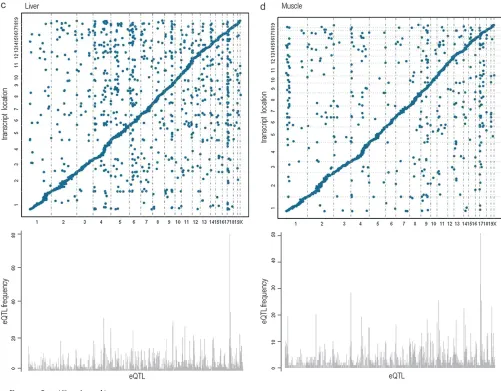
Replication of eQTL hotspots: To investigate if the distal eQTL hotspots replicate between the crosses, we determined which chromosomes had the highest relative frequency of distal eQTL at LOD.6. The brain consisted of the most pronounced replicated distal eQTL hotspots on chromosomes 1, 4, 11, and 17. In the liver tissue replicated hotspots were detected on chromosomes 4, 6, 9, and 17. In muscle, replicated hotspots were found on chromosomes 1, 4, 9, and 17. And in adipose, distal eQTL hotspots replicated on chromosomes 8, 9, and 17. Interestingly, the same hotspot on chromosome 9 (105.18– 106.57 Mb) was observed in all tissues, although in varying degrees. We also detected the same hotspot across all tissues on chromosome 17 (24.53 Mb) with the exception of adipose tissue (11.64 Mb). These results show that tissue-specific distal eQTL hotspots as well as those across tissues are replicable in mouse crosses. (Figures 4 and 5).
We also determined if the transcripts mapping to these hotspots were enriched for a biological functional category. For hotspots observed across tissues on chromosome 17 (11.64– 24.53 Mb), transcripts were modestly enriched for ‘‘integral to plasma membrane’’ (p ¼0.021) as well as ‘‘non-membrane-bounded organelle’’ with PDZ domains (common structural
domain that mediates protein–protein interactions for signal-ing complexes) found in diverse signalsignal-ing proteins (p¼0.025). For hotspots found in only one tissue, transcripts were enriched for tissue-specific functions. For example, at chro-mosome 11 (36.82 Mb) in brain, two of the transcripts were shown involved in the regulation of ‘‘glial cell development’’ (p ¼0.024); in liver at chromosome 6 (94.46 Mb) two genes were found in the pathway for ‘‘glucose homeostasis’’ (p ¼0.037) and in adipose at chromosome 8 (84.79–95.42 Mb), seven genes were involved in pathways for ‘‘lipid biosynthetic pro-cess’’ (p¼0.0039) and ‘‘palmitate’’ (p¼0.021) (Figure S1and Table S4).
Additionally, we ascertained if these loci harbored genes responsible for regulating a high frequency of transcripts such as transcription factors. We identified several chromosomes with transcription factors at these hotspots, including chromo-some 1 (174.91–178.85 Mb), Usf1, Upstream transcription factor 1 (173.34 Mb) andAtf6, Activating transcription factor 6 (172.62 Mb); chromosome 4 (132.40 Mb), RUNX3, Runt related transcription factor 3 (134.67 Mb); and chromosome 17 (24.53 Mb),E4f1, E4F transcription factor 1 (24.56 Mb) (Figure S1andTable S4).
Although the majority of these genes were not well anno-tated, some transcription factors were localized at or near several hotspot loci. In particular, Atf6, one of the primary genes involved in regulating genes in the unfolded protein response system, resides near a hotspot on chromosome 1 Figure5.—(Continued ).
(175.34 Mb) that was found to be enriched for transcripts involved in protein synthesis (P#6.90E-05) (Davenportet al. 2008).
DISCUSSION
Our results have led to several conclusions: First, local eQTL are highly preserved between studies, whereas distal eQTL were only modestly replicable. Second, most local eQTL were not tissue specific, in that an eQTL in one tissue (of the four tissues studied here) was likely to be observed in another tissue. This finding has impor-tant implications for human studies where tissue avail-ability is a problem. Third, although thousands of genes differed in expression between males and females, most local eQTL were preserved between sexes whereas distal eQTL were not. Fourth, several hotspots were preserved between crosses, sexes, and multiple tissues. The identity of the underlying genes will be of considerable interest. There were some differences between the two crosses, notably the presence of an ApoE null mutation in cross I, and these undoubtedly decreased the replication of eQTL (Table 1).
Previous eQTL reports have shown similarly high levels of replication of local eQTL between mouse crosses (Peirceet al. 2006). Interestingly, the strongest
replicated distal eQTL hotspot we observed in brain on chromosome 1 (174–178 Mb) was previously reported on chromosome 1 (170–174 Mb) in the same tissue (Peirceet al. 2006). However, a recent study detected
low replicability between human cell lines from different tissues (Dimaset al. 2009). Since the latter analysis was
performed in only 75 individuals, the power was more limited than in our study. Moreover, these authors used a relative high threshold for significance for both identi-fication of the eQTL and replication in a separate tissue. The importance of eQTL studies has recently been
reviewed (Rockman and Kruglyak 2006; Cookson
et al. 2009). eQTL analyses allow the modeling of causal interactions that can be used to identify candidate genes influencing biologic pathways (Schadt et al.
2005) and the construction of directed coexpression networks (Chenet al. 2008). The modeling of biologic
networks has proved to be particularly informative when combined with genome-wide association studies, making possible the identification of causal genes at a locus, the annotation of genes of unknown function, and the clarification of new candidate genes in biologic pathways.
The high level of replication between crosses of distal as well as local eQTL suggests that systems genetics approaches should be capable of addressing
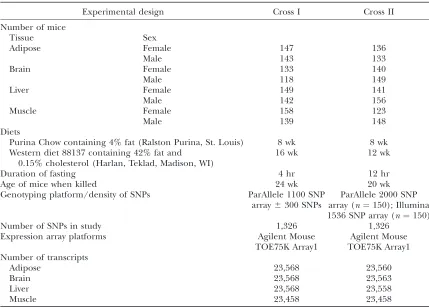
mecha-TABLE 1
Comparison of experimental design between the crosses
Experimental design Cross I Cross II
Number of mice
Tissue Sex
Adipose Female 147 136
Male 143 133
Brain Female 133 140
Male 118 149
Liver Female 149 141
Male 142 156
Muscle Female 158 123
Male 139 148
Diets
Purina Chow containing 4% fat (Ralston Purina, St. Louis) 8 wk 8 wk Western diet 88137 containing 42% fat and
0.15% cholesterol (Harlan, Teklad, Madison, WI)
16 wk 12 wk
Duration of fasting 4 hr 12 hr
Age of mice when killed 24 wk 20 wk
Genotyping platform/density of SNPs ParAllele 1100 SNP array6300 SNPs
ParAllele 2000 SNP array (n¼150); Illumina 1536 SNP array (n¼150)
Number of SNPs in study 1,326 1,326
Expression array platforms Agilent Mouse
TOE75K Array1
Agilent Mouse TOE75K Array1 Number of transcripts
Adipose 23,568 23,560
Brain 23,568 23,563
Liver 23,568 23,558
nisms governing transcription and RNA processing. For example, it should be possible to examine control of chromatin structure by integrating eQTL data with ChIP-chip or ChIP-seq methodologies (Zhuet al. 2008). Also,
massively parallel sequencing of transcripts from ge-netic crosses (RNA-seq) should result in the mapping of loci controlling RNA splicing as well as transcript levels (Heinzen et al. 2008; Veyrieras et al. 2008).
Although similar eQTL approaches are clearly feasible for human studies, genetic heterogeneity and environ-mental factors result in greatly diminished power (Cooksonet al. 2009). It is noteworthy that
coexpres-sion networks developed using mouse data exhibit considerable overlap with human networks (Emilsson et al. 2008).
We thank Hong-Xiu Qi for assistance in animal husbandry, in-cluding animal care, collecting plasma and tissues, and performing the body fat assays; Larry Castellani for assistance in collecting plasma and constructive criticism; Sharda Charugundla for performing the lipid assays; Melenie Rosales, Daria Estrada-Smith, Ping-Zi Wen, Sonal S. Sheth, Sudheer Doss, Xu-Ping Wang, Judy Wu, Xia Yang, and Yi-Shou Shi for their assistance in animal husbandry; Kathleen Ranola, Madlen Ayvasian, and Arpa Ghazarian for assistance in processing the tissues; Eleazar Eskin and Rita Cantor for statistical advice; Calvin Pan for assistance in data management; Sonia Carlson and Stephen Edwards for help in transfer of tissues and organization of data between institutions; and Richard C. Davis for guidance, discussions, and insight. This work was supported by National Institutes of Health (NIH) grants HL28481, HL094322, HL087944, and HL30568 (to A.J.L.) and 5R01DK72206 (to T.D.). A.v.N. was supported by NIH training grant 5T32HD07228. Disclosure statement: The authors have nothing to disclose.
LITERATURE CITED
Bystrykh, L., E. Weersinget al., 2005 Uncovering regulatory
path-ways that affect hematopoietic stem cell function using ‘genetical genomics’. Nat. Genet.37(3): 225–232.
Chen, Y., J. Zhu, P. Y. Lum, X. Yang, S. Pintoet al., 2008
Vari-ations in DNA elucidate molecular networks that cause disease. Nature452(7186): 429–435.
Cookson, W., L. Liang, G. Abecasis, M. Moffatt and M.
Lathrop, 2009 Mapping complex disease traits with global
gene expression. Nat. Rev. Genet.10(3): 184–194.
Damerval, C., A. Maurice, J. M. Josse and D. de Vienne,
1994 Quantitative trait loci underlying gene product varia-tion: a novel perspective for analyzing regulation of genome expression. Genetics137:289–301.
Davenport, E. L., G. J. Morganand F. E. Davies, 2008 Untangling
the unfolded protein response. Cell Cycle7(7): 865–869.
de Vienne, D., A. Maurice, J. M. Josse, A. Leonardi and C.
Damerval, 1994 Mapping factors controlling genetic
expres-sion. Cell. Mol. Biol.40(1): 29–39.
Dimas, A. S., S. Deutsch, B. E. Stranger, S. B. Montgomery, C.
Borelet al., 2009 Common regulatory variation impacts gene
expression in a cell type-dependent manner. Science
325(5945): 1246–1250.
Doss, S., E. E. Schadt, T. A. Drakeand A. J. Lusis, 2005 Cis-acting
expression quantitative trait loci in mice. Genome Res.15(5): 681–691.
Emilsson, V., G. Thorleifsson, B. Zhang, A. S. Leonardson, F.
Zink et al., 2008 Genetics of gene expression and its effect
on disease. Nature452(7186): 423–428.
Ghazalpour, A., S. Doss, B. Zhang, S. Wang, C. Plaisieret al.,
2006 Integrating genetic and network analysis to characterize genes related to mouse weight. PLoS Genet.2(8): e130. He, Y. D., H. Dai, E. E. Schadt, G. Cavet, S. W. Edwardset al.,
2003 Microarray standard data set and figures of merit for com-paring data processing methods and experiment designs. Bioin-formatics19(8): 956–965.
Heinzen, E. L., D. Ge, K. D. Cronin, J. M. Maia, K. V. Shiannaet al.,
2008 Tissue-specific genetic control of splicing: implications for the study of complex traits. PLoS Biol.6(12): e1.
Lander, E., and L. Kruglyak, 1995 Genetic dissection of complex
traits: guidelines for interpreting and reporting linkage results. Nat. Genet.11(3): 241–247.
Lusis, A. J., A. D. Attieand K.Reue, 2008 Metabolic syndrome:
from epidemiology to systems biology. Nat. Rev. Genet.9(11): 819–830.
Lusis, A. J., J. Yuand S. S. Wang, 2007 The problem of passenger
genes in transgenic mice. Arterioscler. Thromb. Vasc. Biol.
27(10): 2100–2103.
Machleder, D., B. Ivandic, C. Welch, L. Castellani, K. Reueet al.,
1997 Complex genetic control of HDL levels in mice in re-sponse to an atherogenic diet. Coordinate regulation of HDL lev-els and bile acid metabolism. J. Clin. Invest.99(6): 1406–1419. Montgomery, S. B., and E. T. Dermitzakis, 2009 The resolution of
the genetics of gene expression. Hum. Mol. Genet. 18(R2): R211–R215.
Peirce, J. L., H. Li, J. Wang, K. F. Manly, R. J. Hitzemannet al.,
2006 How replicable are mRNA expression QTL? Mamm. Genome17(6): 643–656.
Rockman, M. V., and L. Kruglyak, 2006 Genetics of global gene
expression. Nat. Rev. Genet.7(11): 862–872.
Schadt, E. E., J. Lamb, X. Yang, J. Zhu, S. Edwardset al., 2005 An
integrative genomics approach to infer causal associations be-tween gene expression and disease. Nat. Genet.37(7): 710–717. Suarez, B. K., C. L. Hampeand P. VanEerdewegh, 1994 Problems of
Replicating Linkage Claims in Psychiatry in Genetic Approaches to Mental Disorders.American Psychiatric Press, Washington, DC.
vanNas, A., D. Guhathakurta, S. S. Wang, N. Yehya, S. Horvath
et al., 2009 Elucidating the role of gonadal hormones in sexu-ally dimorphic gene coexpression networks. Endocrinology
150(3): 1235–1249.
Veyrieras, J. B., S. Kudaravalliet al., 2008 High-resolution
map-ping of expression-QTLs yields insight into human gene regula-tion. PLoS Genet.4(10): e1000214.
Wang, S., N. Yehya, E. E. Schadt, H. Wang, T. A. Drakeet al.,
2006 Genetic and genomic analysis of a fat mass trait with com-plex inheritance reveals marked sex specificity. PLoS Genet.2(2): e15.
Zhu, J., B. Zhang, J. Zhu, B. Zhang, E. N. Smith et al.,
2008 Integrating large-scale functional genomic data to dissect the complexity of yeast regulatory networks. Nat. Genet.40(7): 854–861.
Communicating editor: D. W. Threadgill