DOI: 10.1534/genetics.107.083428
Note
The Anomalous Effects of Biased Mutation Revisited: Mean–Optimum
Deviation and Apparent Directional Selection Under Stabilizing Selection
Xu-Sheng Zhang
1and William G. Hill
Institute of Evolutionary Biology, University of Edinburgh, Edinburgh EH9 3JT, United Kingdom
Manuscript received October 16, 2007 Accepted for publication April 14, 2008
ABSTRACT
Empirical evidence indicates that the distribution of the effects of mutations on quantitative traits is not symmetric about zero. Under stabilizing selection in infinite populations with normally distributed mutant effects having a nonzero mean, Waxman and Peck showed that the deviation of the population mean from the optimum is expected to be small. We show by simulation that genetic drift, leptokurtosis of mutational effects, and pleiotropy can increase the mean–optimum deviation greatly, however, and that the apparent directional selection thereby caused can be substantial.
I
N most models of the maintenance of genetic variance in quantitative traits by mutation–selection balance it is assumed, not least for mathematical sim-plicity, that the distribution of the effects of mutations on these traits is symmetric about zero (e.g., Bulmer1980; Turelli1984; Barton1990; Keightleyand Hill
1990; Zhangand Hill 2002). Mutation-accumulation
experiments indicate, however, that mutations sig-nificantly affect average values of quantitative traits (Santiagoet al. 1992; Lymanet al. 1996; Mackay1996;
Keightley and Ohnishi 1998; Lynch et al. 1998;
Garcia-Doradoet al. 1999; Vassilievaand Lynch1999;
Ostrowet al. 2007; P. D. Keightleyand D. L. Halligan,
personal communication). For example, Garcia-Dorado et al. (1999) found that the mean effect of mutations on abdominal bristle number in Drosophila melanogaster is
0.24 environmental standard deviations.
Recently, Waxmanand Peck (2003) investigated a
model in which this symmetry assumption was relaxed,
i.e., a bias from zero in the mean of the distribution of mutational effects. They found that the deviation between the mean phenotypic value of the trait and the optimum (the mean–optimum deviation) is small. Similar estimates were previously obtained by Bu¨ rger
(2000; see p. 247, Equation 7.13). Both analyses were based on a number of other similar assumptions, however, which turn out to have an important influence on the mean–optimum deviation. In this note we consider some of these assumptions and focus on their impact on Waxmanand Peck’s (2003) conclusions.
Waxmanand Peck(2003) assumed a model in which
the allelic effects of mutations at individual loci were normally distributed, but with a mean that departed from zero. Although they allowed differences among the parameters of the distribution of mutant effects at four different loci, in accordance with Welch and
Waxman (2002), this generated overall distributions
that did not deviate far from the normal (e.g., kurtosis
4 in the model for their Figure 3;cf. 3 for the normal). Furthermore, in Waxman and Peck’s method of gener-ating mutations, the mutants occurring most commonly have an effect equal to the bias. Empirical evidence shows, however, that the distribution of mutational effects on quantitative traits is leptokurtic, with most mutations having very small effects and a few having very large effects (Simmonsand Crow1977; Mackayet al.
1992; Caballeroand Keightley1994; Garcia-Dorado et al.1999; Lynchet al.1999; P. D. Keightleyand L. D.
Halligan, personal communication). Hence a normal
distribution is inappropriate.
The mutational variance produced per generation is of rather similar magnitude for different traits and species, VM ¼12lEða2Þ 103s2E (Falconer and
Mackay 1996; Houle et al. 1996; Lynchand Walsh
1998; Keightley2004), wheres2
Eis the environmental
variance, l is the average number of mutations per generation per haploid genome, andais the difference in value between mutant and wild-type homozygotes. As VM from published experiments depends on the
mean square rather than the variance of mutational effects and the mutational bias on the trait implies that
E(a)¼D6¼0, this indicates that, even if all mutants had the same effect, the biasDcould not exceed ffiffiffiffiffiffiffiffiffiffiffiffiffiffi2VM=l
p
(see
1Corresponding author: Institute of Evolutionary Biology, School of
Biological Sciences, University of Edinburgh, W. Mains Rd., Edinburgh
EH9 3JT, United Kingdom. E-mail: [email protected]
Vassilievaand Lynch1999, p. 122). Thus the bias has to
be small if the mutation rate is high, whereas Waxman
and Peck’s (2003) method of generating biased
muta-tional effects with unlimited nonzero mean also implies that the mutational varianceVMcan take any value.
A further important and unrealistic assumption of Waxman and Peck’s model is that mutants have an effect on fitness solely through their effect on the trait by stabilizing selection and have no pleiotropic effect on fit-ness acting through other traits, contrary to the known widespread pleiotropic effect of mutations (Barton
and Keightley2002; Mackay2004). Bu¨ rger’s (2000)
model was also based on the assumptions of no pleio-tropic selection and distributions of mutant effects that are close to the normal. Therefore, to take into account empirical knowledge of mutation parameters, we use a more general joint-effect model as in our previous studies (Zhang and Hill 2002). This includes both
pleiotropic and stabilizing selection and a distribution of effects that is much more leptokurtic than the normal and has a mode at zero. We have previously assumed a symmetric effect of mutations on the trait, but we now remove this assumption.
MODEL AND METHOD
A population of N diploid monoecious individuals, with discrete generations, with random mating, and at Hardy–Weinberg equilibrium, is assumed. Mutations are assumed to have additive effects on a quantitative trait z, with a being the difference in value between homozygotes, and pleiotropic effects on fitness, withs(s $ 0) being the difference in the fitness between ho-mozygotes. Further, it is assumed for simplicity that there is no linkage, epistasis, or overdominance. The quantitative trait is assumed to be under real stabilizing selection with the optimum phenotype at zero and strength characterized by the variance Vs of its fitness
profile. As mutational effects tend to reduce the magni-tude of quantitative traits (see references listed above), we consider only negative bias, but the same conclusions would hold for positive bias.
Mutants can have positive or negative effects on the trait. Both were assumed to follow a gamma (aa, ta)
distribution with scale parameteraaand shape
param-eterta, but with a higher chance P (.12) of having a
negative value, so that mutational effects have mean (i.e., the bias) D ¼ (1 2P)ta/aa and mean square
e2
a[Eðjaj 2Þ ¼t
aðta11Þ=a2a¼2VM=l. This was termed
the ‘‘proportional’’ method by Keightley and Hill
(1987) and is illustrated in Figure 1. The maximum bias in this sampling method is thereforeD¼ ta/aa. The
mutational bias and the mean–optimum deviation are expressed in terms of the environmental standard devi-ationsE. The pleiotropic effects(s.0) on fitness of mutations was assumed to follow a gamma (as, ts)
distribution.
The pleiotropic effect of mutations can cause appar-ent stabilizing selection because individuals that carry more mutations are more likely to have extreme trait values and lower fitness, inducing a quadratic relation-ship between them (Keightleyand Hill1990). With
biased mutations, the population mean will be drawn in the direction of bias, and apparent directional selection on the trait due to a linear association between pheno-typic value and fitness will arise from the real stabilizing selection. If the trait value under selection isz and its fitness isw, the strength of selection can be decomposed into linear and quadratic terms using regression meth-ods (Lande and Arnold 1983): w ¼ a 1 bz 1 gz2.
Suppose that the observed fitness, which includes the pleiotropic effect, iswifor an individual having simulated
trait valuezi. Employing least squares, we can estimate
both the linear and the quadratic selection gradients,
b¼Covðw;zÞm4covðw;z 2Þm
3 s2m4m32
and g¼Covðw;z
2Þs2covðw;zÞm 3 s2m
4m32
; ð1Þ
wheres2,m
3, andm4are the observed variance and the
third and fourth moments of trait values, respectively. If
m3is very small these formulas reduce to
b¼Covðw;zÞ
s2 and g¼
Covðw;z2Þ m4
ð2Þ
(Landeand Arnold1983).
Analysis was undertaken by including biased muta-tion in our individual-based Monte Carlo simulamuta-tion program (Zhang et al. 2004). Each generation the
sequence of operations was mutation, selection, mating, and reproduction. The fitness of individual i was assigned aswi¼1 ½Sjsij1zi2/2Vs, wherezi¼Sjaijis
the value of the trait and the optimum is assumed to be
Figure1.—The distribution of mutational effects on the
zero. If 0,wi#1, then the chance that individualiwas
chosen as a parent of the next generation was pro-portional towi; otherwise, it had no offspring.
The population was started from an isogenic state. Under the approximation of the house-of-cards model (Turelli 1984), Monte Carlo simulations show that
after 3Ngenerations the population reaches a dynamic equilibrium with its mean phenotypic value and the genetic variance distributed around constant values. Hence, for the following 1000 generations, the mean, the variance, and the third and fourth moments of trait values were computed and averaged to calculate the mean phenotypic value, the variance, and linear and quadratic selection gradients ½using formulas (1) at equilibrium. Results given in the figures were calculated from 16 replicates. In addition, it was assumed that the genomic mutation ratel¼0.1, the mutational variance is VM¼0:001s2E, there are 500 mutable loci, and the
strength of stabilizing selection is Vs¼5s2E (except
Figure 6, whereVsranges from 5 to 30).
RESULTS
Waxmanand Peck(2003) assumed an infinite
pop-ulation and found that the predicted mean–optimum difference (M–OD) is proportional to the per-locus rate of mutation. For plausible choices of parameter values, their estimate of the maximum M–OD could not be
.0.01sE. Using their model of normally distributed
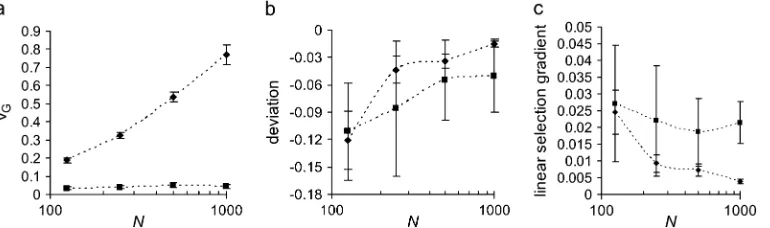
mutant effects, but in a finite population, numerical simulations show that genetic drift can enhance the M–OD as pointed out by Waxman and Peck, such that this deviation can be substantial if the population size (N) is small (Figure 2). For example, it can be up to 0.1sEwhen the effective population size is100 and the
mutational bias is D ¼ 0.04. Hence the apparent directional selection becomes much stronger with re-duced population size. With our joint-effect model, similar but smaller increases are found in both the M– OD and the strength of the apparent directional selection (Figure 2).
With our proportional model of gamma-distributed effects with more than half the mutants decreasing the trait, simulations show that the genetic variance VG
appears insensitive to mutational bias, as predicted by Waxmanand Peck(2003). With increasing mutational
bias within its possible range, the size of the M–OD and the apparent directional selection increase, but the ap-parent strength of stabilizing selection decreases (Fig-ure 3). If the mutational effects on the trait are sampled from a reflected gamma distribution (i.e., symmetric about the mean) but with mean equal to the bias, as assumed by Waxman and Peck but using a normal distri-bution, we also found that the M–OD increased non-monotonically. However, for given parameter values, the M–OD is slightly larger than that obtained by the proportional method, but the linear selection gradients of the two models are roughly the same (data not shown).
Pleiotropic effects of mutants on fitness obviously add to the effects of stabilizing selection and therefore reduce genetic variance (Figure 4, a and d), just as when mutation effects are unbiased (Zhangand Hill
2002). For a given biasD, pleiotropic selection increases the M-OD up to some point, but then stronger pleiotro-pic selection decreases it (Figure 4b). When pleiotropleiotro-pic selection is much stronger than stabilizing selection, clearly all mutants will be deleterious and will be lost rapidly, leading to small genetic variance and small M– OD. It is analogous to the situation when the mutation ratel/0 (Bu¨ rger2000, p. 236, Equation 6.10). When
pleiotropic selection is relatively weak, however, such that stabilizing selection predominates, the argument is more subtle (see the appendix for analysis). In the
absence of pleiotropic effects, mutants of positive effect are at a relative selective advantage to the majority of the mutants that reduce the trait, thereby maintaining the mean near the optimum (see Equation A1). With small pleiotropic effects, the duration of segregation and fixation probability of the increasing mutants is also reduced, allowing the mean to drift away from the optimum. Increasing strength of the pleiotropic
selec-Figure 2.—Influence of
effective population size on (a) genetic variance, (b) the mean–optimum de-viation, and (c) the linear selection gradient. Results are given for two models: stabilizing selection with mu-tation effects normally dis-tributed with mean equal to the bias, as assumed by Waxman and Peck(2003)
tion increases the apparent directional selection mono-tonically, however, because individuals that carry more mutants are expected to have a lower trait value and thus smaller fitness. The increase in apparent directional selection can be substantial: for example, with pleiotro-pic selection of strengthE(s). 0.1, the gradient bof apparent directional selection increases from near zero to 0.06 for the parameters used in Figure 4.
As in the nonbiased mutation model, genetic variance decreases as trait effects of mutants become more leptokurtic (Zhang and Hill 2002); with extreme
leptokurtosis (ta , 0.2), the M–OD depends greatly
on the value of the shape parameterta, but is affected
little at higher values ofta (Figure 5b). The
leptokur-tosis can greatly strengthen the apparent directional selection (Figure 5c) but appears to have a weak effect on the apparent strength of quadratic selection (data not shown). If the real stabilizing selection is weaker (i.e., increasing Vs), the apparent stabilizing selection
also weakens and the genetic variance increases, and also, as predicted by Waxmanand Peck(2003), the M–
OD increases but the apparent directional selection
Figure3.—Influence of mutational bias on (a)
genetic variance, (b) the mean–optimum devia-tion, (c) the linear selection gradient, and (d) the quadratic selection gradient. Increasing and decreasing mutational effects on the trait have a gamma distribution withta¼0.1 and a higher probability,P¼1
2(1Daa/ta), of having negative values, and pleiotropic effects on fitness are expo-nentially distributed with meanE(s)¼0.05. The population size isN¼600.
Figure4.—Influence of the pleiotropic effect
weakens (Figure 6). With an increase in the leptokur-tosis of the pleiotropic effect (i.e., decreasing its shape parameterts), both apparent directional and quadratic
selection weaken and genetic variance increases (Zhang
and Hill 2002), but the M–OD remains roughly the
same (results not shown).
DISCUSSION
In this simulation-based study we find that the mean– optimum deviation and the magnitude of apparent directional selection can be substantial. Within the range of biologically plausible values of mutation and selection parameters, the mean–optimum deviation can be large (up to 10% of an environmental standard de-viation) and the apparent directional selection caused by such a deviation can also be large, with a linear selection gradient up to0.06 for the parameter values investigated in this study. This is in contrast to the results
of Waxman and Peck (2003) and Bu¨ rger (2000),
whose models were based on real stabilizing selection, infinite populations, and mutation distributions that do not deviate far from the normal. In both studies, pre-dicted values of the M–OD were small under plausible choices of parameter values,,1 and,2% of the envi-ronmental standard deviation, respectively. Our simu-lations show that genetic drift (see Figure 2), pleiotropic selection (Figure 4), and leptokurtosis of the mutational effects on the trait (Figure 5) can all increase the M–OD and apparent directional selection. Clearly the consider-able discrepancy between our results and those of Waxmanand Peck(2003) and Bu¨ rger(2000) comes
from the combination of all three differences between the models.
These findings provide useful information for un-derstanding some problems in evolutionary biology. Perhaps the clearest example that quantitative traits are under stabilizing selection is for birth weight in humans
Figure 5.—Influence of
leptokurtosis of trait effects of mutation on (a) genetic variance, (b) the mean– optimum deviation, and (c) the linear selection gradi-ent. Mutational effects on the trait have a reflected gamma distribution but have a higher probability
P¼1
2(1Daa/ta) of having negative values, and pleiotro-pic effects on fitness are ex-ponentially distributed with meanE(s)¼0.05.N¼
600 andD¼ 0.022sE.
Figure6.—Influence of strength of real
stabi-lizing selection on (a) genetic variance, (b) the mean–optimum deviation, (c) the linear selec-tion gradient, and (d) the quadratic selecselec-tion gradient. Mutational effects on the trait have a re-flected gamma distribution withta¼0.1 but have a higher probabilityP¼0.852 of negative values, and pleiotropic effects on fitness are exponen-tially distributed with mean E(s) ¼ 0.05. N ¼
before modern medicine; but the optimum birth weight was greater than the observed mean (Cavalli-Sforza
and Bodmer1971; Zhivotovskyand Feldman1992).
As the bias of mutation effects on most traits in different model species (e.g., Drosophila, Daphnia) appears to be downward (e.g., Garcia-Dorado et al. 1999 and other
references above), it can surely be one explanation for the mean–optimum deviation.
Directional selection has been detected for many traits in natural populations, with a median gradient of 0.15 (Hoekstraet al. 2001; Herefordet al. 2004). This
estimate may be biased upward by publication bias and also by skew in the distribution of trait phenotypes, when Lande and Arnold’s (1983) formula can
over-estimate the strength of selection. Skew in the pheno-typic distribution due to asymmetric mutations can double the linear selection gradient (Figure 4c). In some field studies no genetic response in quantitative traits under functional (real) directional selection has been observed, even though there is adequate heritable variation (Kruuket al. 2002). Our results provide a
pos-sible or partial explanation: under joint pleiotropic and stabilizing selection the apparent directional selection caused by mutational bias can be substantial, especially in small populations and where mutational effects on the trait are highly leptokurtic.
We are grateful to R. Bu¨ rger, D. Houle, and an anonymous reviewer for their comments and constructive suggestions on a previous version of this manuscript. This work was supported by a grant from the Biotechnology and Biological Sciences Research Council (15/ G13242).
LITERATURE CITED
Barton, N. H., 1990 Pleiotropic models of quantitative variation.
Genetics124:773–782.
Barton, N. H., and P. D. Keightley, 2002 The nature of
quantita-tive genetic variation. Nat. Genet.3:11–21.
Bulmer, M., 1980 The Mathematical Theory of Quantitative Genetics.
Clarendon Press, Oxford.
Bu¨ rger, R., 2000 The Mathematical Theory of Selection, Recombination, and Mutation.Wiley, Chichester, UK.
Caballero, A., and P. D. Keightley, 1994 A pleiotropic
nonaddi-tive model of variation in quantitanonaddi-tive traits. Genetics138:883– 900.
Cavalli-Sforza, L. L., and W. F. Bodmer, 1971 The Genetics of Hu-man Populations.W. H. Freeman, San Francisco.
Falconer, D. S., and T. F. C. Mackay, 1996 Introduction to Quantita-tive Genetics, Ed. 4. Longman, Harlow, UK.
Garcia-Dorado, A., C. Lopez-Fanjuland A. Caballero, 1999
Prop-erties of spontaneous mutations affecting quantitative traits. Genet.
Res.74:341–350.
Hereford, J., T. F. Hansen and D. Houle, 2004 Comparing
strength of directional selection: How strong is strong? Evolution
58:2133–2143.
Hoekstra, H. E., J. M. Hoekstra, D. Berrigan, S. N. Vignieri, A.
Hoanget al., 2001 Strength and tempo of directional selection
in the wild. Proc. Natl. Acad. Sci. USA98:9157–9160.
Houle, D., B. Morikawaand M. Lynch, 1996 Comparing
muta-tional variabilities. Genetics143:1467–1483.
Keightley, P. D., 2004 Mutational variation and long-term selection
response. Plant Breed. Rev.24(1): 227–247.
Keightley, P. D., and W. G. Hill, 1987 Directional selection and
variation in finite populations. Genetics117:573–582.
Keightley, P. D., and W. G. Hill, 1990 Variation maintained in
quantitative traits with mutation-selection balance: pleiotropic side-effects on fitness traits. Proc. R. Soc. Lond. Ser. B242:95–100. Keightley, P. D., and O. Ohnishi, 1998 EMS-induced polygenic
mutation rates for nine quantitative characters inDrosophila mel-anogaster.Genetics148:753–766.
Kimura, M., 1969 The number of heterozygous nucleotide sites
maintained in a finite population due to steady flux of mutations.
Genetics61:893–903.
Kruuk, L. E. B., J. Slate, J. M. Pemberton, S. Brotherstone, F. E.
Guinnesset al., 2002 Antler size in red deer: heritability and
selection, but no evolution. Evolution56:1683–1695.
Mackay, T. F. C., 1996 The nature of quantitative genetic-variation
revisited—lessons from Drosophila bristles. BioEssays18:113–
121.
Mackay, T. F. C., 2004 The genetic architecture of quantitative trait—
lessons from Drosophila. Curr. Opin. Genet. Dev.14:253–257.
Mackay, T. F. C., R. F. Lymanand M. S. Jackson, 1992 Effects of P-element insertions on quantitative traits inDrosophila melanogaster.
Genetics130:315–332.
Lande, R., and S. J. Arnold, 1983 The measurement of selection on
correlated characters. Evolution37:1210–1226.
Lyman, R. F., F. Lawrence, S. V. Nuzhdinand T. F. C. Mackay,
1996 Effects of singleP-element insertions on bristle number
and viability inDrosophila melanogaster.Genetics143:277–293. Lynch, M, and B. Walsh, 1998 Genetics and Analysis of Quantitative
Traits.Sinauer, Sunderland, MA.
Lynch, M., L. Latta, J. Hicksand M. Giorgianni, 1998 Mutation,
selection, and the maintenance of life-history variation in a
nat-ural population. Evolution52:727–733.
Lynch, M., J. Blanchard, D. Houle, T. Kibota, S. Schultzet al.,
1999 Perspective: spontaneous deleterious mutation. Evolution
53:645–663.
Ostrow, D., N. Phillips, A. Avalos, D. Blanton, A. Boggset al.,
2007 Mutational bias for body size in rhabditid nematodes.
Genetics176:1653–1661.
Santiago, E., J. Albornoz, A. Dominguez, M. A. Toroand C. Lopez
-Fanjul, 1992 The distribution of spontaneous mutations on
quantitative traits and fitness inDrosophila melanogaster.Genetics
132:138–193.
Simmons, M. J., and J. F. Crow, 1977 Mutations affecting fitness in Drososphilapopulations. Annu. Rev. Genet.11:49–78.
Turelli, M., 1984 Heritable genetic variation via mutation-selection
balance: Lerch’s Zeta meets the abdominal bristle. Theor. Popul.
Biol.25:138–193.
Waxman, D., and J. R. Peck, 2003 The anomalous effects of biased
mutation. Genetics164:1615–1626.
Welch, J. J., and D. Waxman, 2002 Nonequivalent loci and the
dis-tribution of mutant effects. Genetics161:897–904.
Vassilieva, L. L., and M. Lynch, 1999 The rate of spontaneous
mu-tation for life-history traits inCaenorhabditis elegans.Genetics151:
119–129.
Zhang, X.-S., and W. G. Hill, 2002 Joint effect of pleiotropic
selec-tion and real stabilizing selecselec-tion on the maintenance of quanti-tative genetic variation at mutation-selection balance. Genetics
162:459–471.
Zhang, X.-S., J. Wangand W. G. Hill, 2004 Influence of
domi-nance, leptokurtosis and pleiotropy of deleterious mutations on quantitative genetic variation at mutation-selection
equilib-rium. Genetics166:597–610.
Zhivotovsky, L. A., and M. W. Feldman, 1992 On the difference
between mean and optimum of quantitative characters under
sta-bilizing selection. Evolution46:1574–1578.
APPENDIX: INFLUENCE OF PLEIOTROPIC SELECTION ON THE MEAN–OPTIMUM DEVIATION
Assume strong selection such that the frequency of any mutant allele is low and its overall selective value can be approximated by
˜s¼s1½a214az=ð4VsÞ ðA1Þ
(Zhanget al. 2004). Its mean frequency can be approximated byEðxÞ ¼2l=˜s(Kimura1969), and the population
meanz¼Pn
i¼1xiaican be evaluated as
z¼2l
ð‘
‘
ð‘
0
hða;sÞa½s1ða214azÞ=4Vs1dads; ðA2Þ
whereh(a,s) is the joint distribution of trait effectaand pleiotropic effectsof mutations. If pleiotropic selection is much stronger than stabilizing selection,s?ða214azÞ=ð4V
sÞ, then the mean value of the trait can be approximated by
z2lD=_
s, where_
sis the harmonic mean of pleiotropic effect on fitness, indicating that the M–OD decreases with pleiotropic selection.
For the situation wheresis much smaller than stabilizing selection, we consider a simplified situation where there are only two different mutants with the same pleiotropic effectsbut opposite effects on the trait:aanda(s,a.0). If the probability that the negative mutant occurs isP.1
2, we have from Equation A2
z¼2l PðaÞ
s1ða24azÞ=ð4VsÞ1
ð1PÞa s1ða214azÞ=ð4VsÞ
: ðA3Þ
It is easy to see that the mean value of the trait from (A3) is negative. We want to prove the M–OD decreases with the pleiotropic effect of mutation when it is weak (i.e., pleiotropic selection increases the size of the M–OD); that is,y[
dz=dsjS¼0,0. Differentiating both sides of Equation A3 with respect tos, after some algebra we have ats¼0,
y¼32lV 2
s ½ðPaða214azÞ2 ð1PÞaða24azÞ2Þ=ða24azÞ2ða214azÞ2 f1132lVs½Pa=ða24azÞ21ð1PÞa=ða214azÞ2g
}Pða14zÞ2 ð1PÞða4zÞ2¼ ð2P1Þða2116z2Þ18az; ðA4Þ
wherezis the solution to (A3) ats¼0;i.e.,
16z3 ð32lVs1a2Þz18ð12PÞlaVs¼0: ðA5Þ
Under the condition of 32lVs?a2, which should be satisfied for most plausible mutants, (A5) can be reduced to an
approximately linear equation with solutionz¼ ð12PÞa=4:Then 8az1ð2P 1Þða2116z2Þ 4Pð1PÞð12PÞ
a2,0, and thereforey,0.
If a trait is controlled by many pairs of mutants, (s,ai) (s,ai)i¼1,. . .,n, the same inequalitydz=dsjS¼0,0 is