ABSTRACT
LEE, JU SANG. Performance Based Evaluation of Asphalt Surface Treatments Using Third Scale Model Mobile Loading Simulator. (Under the direction of Dr. Y. Richard Kim).
This dissertation presents the research efforts to evaluate the characteristics of asphalt surface treatment (AST) performance including aggregate retention, bleeding, and skid performance using the third-scale Model Mobile Loading Simulator (MMLS3). A new test protocol is developed that uses the MMLS3 and incorporates the digital image processing technique and British Pendulum Test (BPT) for the performance evaluation of ASTs.
In this study, the new MMLS3 AST performance test method is applied to evaluate the effects of fines content, aggregate gradation, and aggregate type (i.e., granite vs. lightweight) on aggregate retention performance. It is confirmed that aggregate retention performance is improved as the fines content decreases and the gradation becomes more uniform. Moreover, it is found that the aggregate gradation factor plays a critical role in the aggregate retention performance regardless of the type of aggregate. This research also develops a performance-based uniformity coefficient as an AST performance indicator.
A methodology is developed to determine the optimum application rate based on AST performance in laboratory tests; this methodology is then extended to the field application. Based on the characteristics of AST performance determined by MMLS3 tests with various AST application rates, the AST design equation as a function of the voids at the loose aggregate state is developed.
PERFORMANCE BASED EVALUATION OF ASPHALT SURFACE TREATMENT USING THIRD SCALE MODEL MOBILE LOADING SIMULATOR
By Ju Sang Lee
A dissertation submitted to the Graduate Faculty of North Carolina State University
in partial fulfillment of the requirement for the degree of
Doctor of Philosophy
Civil Engineering
Raleigh, North Carolina 2007
Approved by:
Dr. Y. Richard. Kim (Chair of Advisory Committee)
Dr. Akhtarhusein A. Tayebali
Dr. Roy H. Borden Dr. Mohammed A. Gabr
DEDICATION
To my parents,
Huchul Lee and Sunam Park,
who made all of this possible,
BIOGRAPHY
Ju Sang Lee was born in Seoul, Korea on May 10, 1971, the son of Huchul Lee and Sunam Park. He received his Bachelor’s degree in Civil Engineering in 1997 from Seoul National University of Technology, Seoul, Korea and Master’s degree in Civil Engineering in 1999 from Dangook University, Seoul, Korea. During that time, he specialized in
ACKNOWLEDGEMENTS
First of all, it has been a great pleasure working with the faculty, staff, and students at North Carolina State University, during my tenure as a doctoral student. My deep
appreciation goes to my advisor and committee chair, Professor Y. Richard Kim, for his unfailing support and guidance during my doctoral program. He has been a continuous source of knowledge and encouragement. The members of my dissertation committee, Dr. Borden, Dr. Tayebali, Dr. Gabr, Dr. Guddati, and Dr. Ranjithan, have generously given their time and expertise to better my work. I thank them for their contribution and their good-natured support.
I thank my mother, Sunam Park, for her unconditional love and support that made all these works possible. Also, my eternal thanks go to my brother and sisters: Juwon,
Hyungsun, and Juyoung who have always been supportive of me from a distance. I express my deep gratitude to my fellow members: Jaejun, Chulmin, Taeyoung, Shane Underwood, Andrew LaCroix, Andrew Jerome, Dr. Joon, Dr. Moon, and Dr. Young. I would like to extend thanks to Sangyum who made my staying at NC State enjoyable and a memorable one.
TABLE OF CONTENTS
LIST OF TABLES... vii
LIST OF FIGURES ... viii
1. INTRODUCTION ... 1
1.1 Research Needs and Significance ... 1
1.2 Research Objectives... 4
1.3 Dissertation Organization ... 4
2. LITERATURE REVIEW ... 6
2.1 General... 6
2.2 Effects of Aggregate Characteristics on Asphalt Surface Treatment Performance 10 2.2.1 Aggregate Retention Test Methods ... 10
2.2.2 Effects of Application Rate... 13
2.2.3 Effects of Fines Content... 13
2.2.4 Effects of Gradation... 16
2.3 Asphalt Surface Treatment Design Methods ... 17
2.3.1 Hanson Design Method... 19
2.3.2 2004 New Zealand Method... 20
2.3.3 McLeod Method... 20
2.3.4 Kearby Method ... 22
2.3.5 Modified Kearby Method (Texas) ... 22
2.3.6 Multiple AST Designs ... 24
2.3.7 Other Design Methods ... 25
2.3.8 Reference Voids for AST Design ... 26
2.4 Skid Resistance of Asphalt Surface Treatments ... 30
2.4.1 Textural Measurement ... 31
2.4.2 Friction Measurement ... 33
2.5 Material Selection of Asphalt Surface Treatments ... 36
3. MATERIALS AND TESTING METHODS ... 38
3.1 Material Selection ... 38
3.2 Component Material Properties ... 38
3.2.1 Gradation of Aggregate Particle Size ... 38
3.2.2 Flakiness Index ... 40
3.2.3 Average Least Dimension... 42
3.2.4 Bulk Specific Gravity ... 42
3.2.5 Loose Unit Weight of Aggregate... 44
3.2.6 Aggregate Absorption... 45
3.2.7 Residual Asphalt Content ... 46
3.3 Specimen Preparation ... 47
3.4 Flip-Over Test... 49
3.5 MMLS3 Performance Test Procedure ... 49
3.6 Bleeding (or Flushing) Measurement ... 54
4. EVALUATION OF AGGREGATE GRADATTION ON AGGREGATE RETENTION
PERFORMANCE... 60
4.1 Selection of Optimum Aggregate and Emulsion Application Rates ... 60
4.2 Effects of Aggregate and Emulsion Application Rates ... 64
4.3 Effects of Fines Content... 69
4.4 Effects of Gradation... 75
4.5 Effects of Aggregate Type ... 80
4.6 Analytical Evaluation of Effects of Aggregate Gradation on AST Performance... 83
4.7 Performance-Based Uniformity Coefficient ... 91
5. DEVELOPMENT OF ASPHALT SURFACE TREATMENT DESIGN METHOD.... 99
5.1 Comparison of AST Design Rates Using Various Design Methods ... 99
5.2 Development of Performance-Based Asphalt Surface Treatment Design Method 102 5.2.1 Experimental Program ... 103
5.2.2 Aggregate Loss Performance... 106
5.2.3 Bleeding Performance of Asphalt Surface Treatments... 109
5.2.4 Design Methods Comparison for AST Performance ... 115
5.2.5 Determination of Optimum AST Application Rate ... 117
5.2.6 Development of AST Design Equation under MMLS3 Testing ... 119
6. EVALUATION OF SKID RESISTANCE TEST PERFORMANCE OF ASPHALT SURFACE TREATMENTS ... 124
6.1 Skid Resistance Tests and Results ... 124
6.2 Effect of Aggregate Types on Skid Resistance... 131
6.3 Correlations of Skid Resistance Test Methods ... 133
6.4 Skid Resistance Performance Evaluation using MMLS3... 136
7. CONCLUSIONS AND RECOMMENDATIONS FOR FURTHER RESEARCH ... 138
7.1 Conclusions... 138
7.1.1 Effects of Fines Content and Gradation... 138
7.1.2 Development of Performance-Based Asphalt Surface Treatment Design... 139
7.1.3 Evaluation of Skid Resistance ... 140
7.2 Recommendations for Further Research... 140
7.2.1 Evaluation of Performance-Based Uniformity Coefficient (PUC)... 140
7.2.2 Development of Asphalt Surface Treatment Design Method... 142
LIST OF TABLES
Table 2-1 Aggregate-Asphalt Compatibility Tests ... 11
Table 2-2 Specification of Maximum Percentage of Fines Content (Kandhal 1987)... 15
Table 2-3 Summary of Design Methods... 18
Table 2-4 Recommended EAR and AAR (NCDOT Standard Specifications for Roads and Structures 2002) ... 25
Table 2-5 PIARC Texture Definitions (Kuttesch 2004) ... 31
Table 2-6 Proposed Minimum Skid Number (Henry 2000) ... 34
Table 2-7 Friction Level Classifications for Runway Pavement Surfaces ... 35
Table 2-8 Types of Materials used for ASTs in North Carolina... 37
Table 3-1 Summary of the Sieve Analysis ... 39
Table 3-2 Slot Sizes Required for Different Fractions of Aggregate Size ... 41
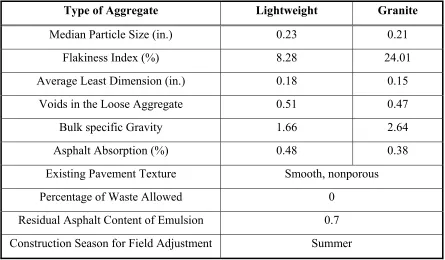
Table 3-3 Flakiness Index of Aggregates ... 41
Table 3-4 Average Least Dimension of Lightweight and Granite Aggregate ... 42
Table 3-5 Bulk Specific Gravity (BSG) of Aggregates ... 43
Table 3-6 Loose Unit Weight Test Results... 45
Table 3-7 Asphalt Absorption Test Results... 46
Table 4-1 Design Input Parameters for McLeod and Modified Kearby Methods... 61
Table 4-2 Application Rates in Optimum Mix Design Study... 63
Table 4-3 Generated Optimum Gradation in 78M Specification Range ... 89
Table 4-4 Summary of Example Gradations ... 93
Table 4-5 Data Summary of Three Different Gradations ... 97
Table 4-6 Summary of AST Performance Expectations Using Gradations ... 98
Table 5-1 Summary of Designed AST Rates... 100
Table 5-2 Experimental Program... 105
Table 5-3 Summary of Threshold Intensities for Bleeding Measurement... 109
Table 5-4 Volume Ratios of RER to RAR in AAR and EAR Combinations... 114
Table 5-5 AST Aggregate Loss and Bleeding Failure with AST Rate Combinations ... 118
Table 5-6 Summary of Optimum AST Rates and Design Factors... 122
Table 5-7 Voids Comparison between Loose Aggregate State and Compacted Aggregate State by MMLS3... 122
Table 6-1 Summary of Information for Skid Resistance Test Sections... 127
LIST OF FIGURES
Figure 2-1 Typical streaking of AST ... 8
Figure 2-2 Typical debonding failure of AST ... 9
Figure 2-3 Partial bleeding failure of AST ... 9
Figure 2-4 States of embedment of AST in asphalt... 19
Figure 2-5 Reference voids for AAR determination with various design methods... 29
Figure 2-6 Reference voids for EAR determination with various design methods ... 29
Figure 3-1 Aggregate particle size gradations ... 40
Figure 3-2 Flakiness Index plate gauge ... 41
Figure 3-3 Volume comparison of 0.22 lb (100 g) granite (left) and lightweight (right) aggregate ... 43
Figure 3-4 Loose unit weight test ... 44
Figure 3-5 Rice vacuum saturation test ... 46
Figure 3-6 AST specimen fabrication procedure: (a) emulsion application gun; (b) applied CRS-2 emulsion on the felt disk; (c) AST specimen in template; (d) hand steel compactor... 48
Figure 3-7 Weight changes of CRS-2 emulsion due to curing ... 49
Figure 3-8 MMLS3 test preparation: (a) MMLS3 test specimen; (b) specimen curing at 95°F; (c) installation of specimens on a steel base; (d) side view of MMLS3; (e) positioning MMLS3 in the temperature chamber; (f) complete MMLS3 test setup for AST testing ... 53
Figure 3-9 DIP procedure of AST specimen: (a) actual specimen; (b) image acquisition using scanner (grayscale); (c) image processing; (d) data file... 55
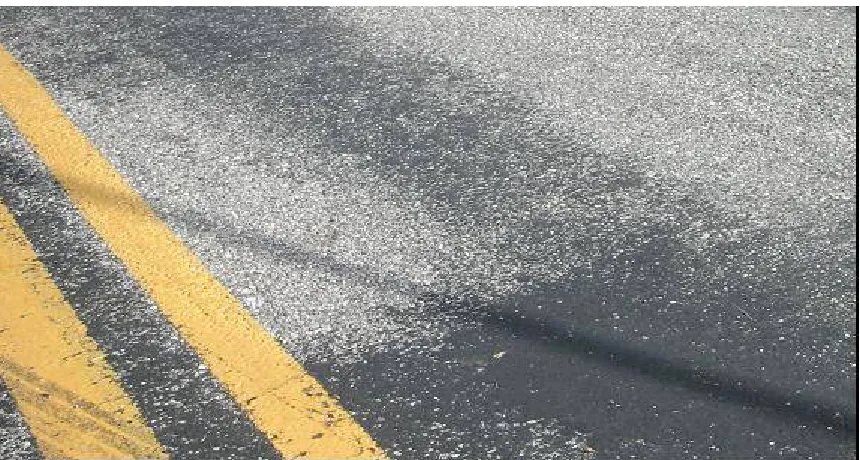
Figure 3-10 Photos of AST surface: (a) digital image of AST; (b) mapped bleeding area ... 59
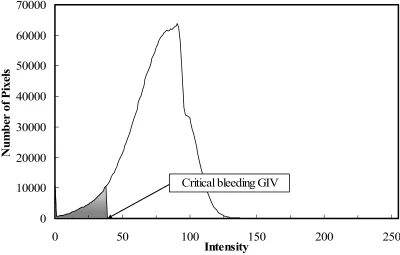
Figure 3-11 Determination of critical bleeding GIV ... 59
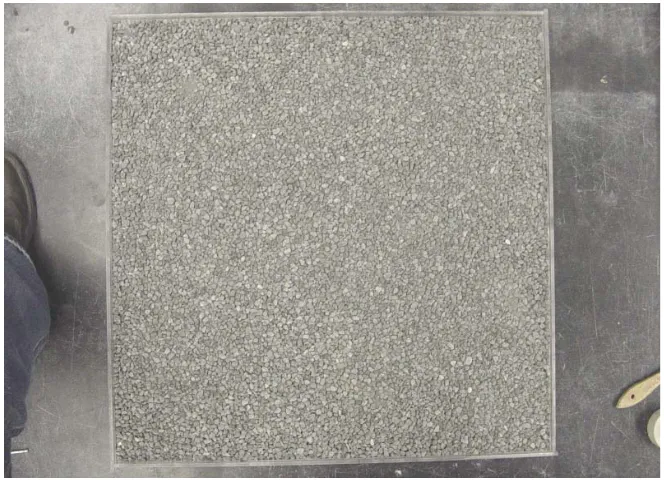
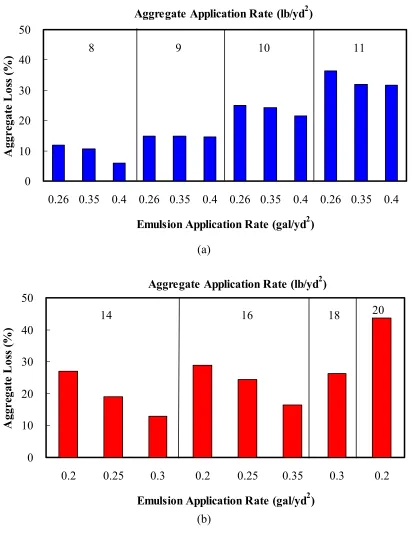
Figure 4-1 Top view of lightweight aggregate on 1/2 yd2 board... 62
Figure 4-2 Aggregate loss measured from the flip-over test: (a) lightweight aggregate; (b) granite aggregate... 66
Figure 4-3 Aggregate loss measured from the MMLS3 test: (a) lightweight aggregate; (b) granite aggregate... 67
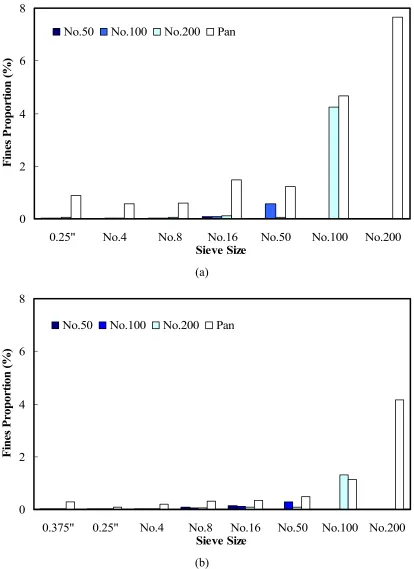
Figure 4-4 Surface texture change after the bleeding test of AST specimens with 9 lb/yd2 of lightweight aggregate and EARs of: (a) 0.26 gal/yd2; (b) 0.35 gal/yd2; (c) 0.4 gal/yd2. 68 Figure 4-5 Distribution of fines: (a) lightweight aggregate; (b) granite aggregate... 70
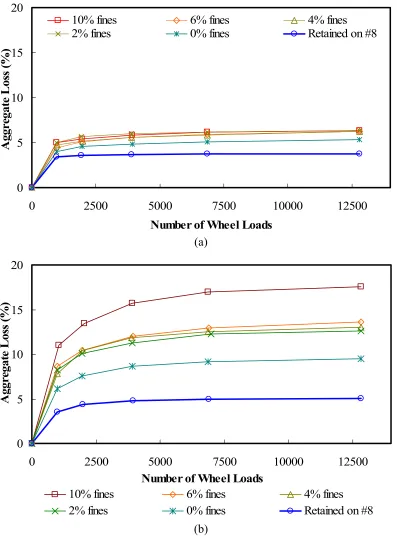
Figure 4-6 Effect of fines content and gradation on aggregate loss performance: (a) lightweight aggregate; (b) granite... 73
Figure 4-7 Normalized aggregate loss as a function of fines content at 12,800 MMLS3 wheel loads ... 74
Figure 4-8 Aggregate loss as a function of fines content after the flip-over test (FOT) and at 12,800 MMLS3 wheel loads... 74
Figure 4-9 Gradation change after eliminating aggregate retained on No. 8 sieve: (a) lightweight; (b) granite aggregate... 77
Figure 4-11 Surface textures of lightweight AST specimens before and after the aggregate
retention test: (a) original gradation with 2% fines; (b) retained on No. 8 sieve... 79
Figure 4-12 Large aggregate sitting on smaller aggregates (granite aggregate)... 80
Figure 4-13 Comparison of aggregate type ... 81
Figure 4-14 Surface textures of AST specimens before and after the aggregate retention test: (a) original gradation of lightweight aggregate with 2% fines; (b) granite with the lightweight aggregate gradation... 82
Figure 4-15 Scheme of McLeod’s AST failure criteria ... 83
Figure 4-16 Performance prediction of 78M specification... 86
Figure 4-17 AST performance in terms of median sizes ... 87
Figure 4-18 AST performance in terms of gradations ... 87
Figure 4-19 The most uniform gradations within 78M specification range ... 88
Figure 4-20 Determination of median size showing the best AST performance... 88
Figure 4-21 Performance prediction of lightweight aggregate gradation... 90
Figure 4-22 Performance prediction of granite aggregate gradation... 90
Figure 4-23 Aggregate particle setting comparison in ASTs: (a) lightweight aggregate with 9 lb/yd2 and 0.25 gal/yd2; (b) granite aggregate with 14 lb/yd2 and 0.2 gal/yd2... 91
Figure 4-24 Examples of gradation uniformity ... 93
Figure 4-25 Three created gradations with the same median for performance comparison... 97
Figure 5-1 AST application rates using different methods: lightweight aggregate ... 101
Figure 5-2 AST application rates using different methods: granite aggregate ... 101
Figure 5-3 Procedure for developing performance-based AST design ... 104
Figure 5-4 Aggregate loss performances with various AAR and EAR combinations: (a) lightweight aggregate; and (b) granite aggregate... 107
Figure 5-5 Section views of ASTs: (a) uniform-sized aggregate; and (b) graded aggregate ... 108
Figure 5-6 Residual and applied rates on AST specimens in MMLS3 test: (a) lightweight aggregate; and (b) granite aggregate... 108
Figure 5-7 Critical GIVs in GIV histograms: (a) lightweight aggregate; (b) granite aggregate ... 110
Figure 5-8 Scheme of AST bleeding performance ... 112
Figure 5-9 Bleeding performances after MMLS3 bleeding test: (a) lightweight aggregate with AARs; (b) lightweight aggregate with RARs; (c) granite aggregate with AARs; (d) granite aggregate with RARs ... 113
Figure 5-10 Aggregate loss and bleeding performances with various design methods: (a) lightweight aggregate; and (b) granite aggregate... 116
Figure 5-11 Voids reduction of lightweight and granite aggregate by MMLS3 ... 123
Figure 5-12 Voids relationship between loose aggregate and compacted aggregate by MMLS3... 123
Figure 6-1 British Pendulum Test (BPT) on AST ... 128
Figure 6-2 Histogram of British Pendulum Numbers (BPNs)... 128
Figure 6-3 Locked Wheel Skid Ttest (LWST) ... 129
Figure 6-4 Histogram of Skid Numbers (SNs) ... 129
Figure 6-5 Towing vehicle and Grip Tester (GT)... 130
1.
INTRODUCTION
1.1
Research Needs and Significance
Asphalt surface treatments (ASTs) are among the most frequently used pavement management treatments for flexible pavements. ASTs provide a nonstructural but durable and functional pavement surface that serves as a highly economical highway maintenance option when constructed properly. Typically, an AST consists of a thin layer of asphalt concrete (less than one inch thick) formed by the application of emulsified asphalt and
aggregate. ASTs are used to seal the existing pavement’s surface cracks, improve ride quality, and protect the surface against aging or oxidation. Furthermore, the surface treatment seals the existing pavement against water and air, restores its weathered and raveled surface, provides a skid-resistant surface, and improves night visibility of lane demarcations.
Application of ASTs is a common treatment in the North Carolina Department of Transportation’s (NCDOT’s) pavement preservation program. ASTs in North Carolina cover approximately 50% of paved road miles, but comprise only approximately 8% of the road maintenance budget. These numbers illustrate the effectiveness of ASTs for road
The principal failure modes in ASTs include loss of cover aggregate, streaking, debonding between the existing surface and the new AST, and flushing or bleeding. Generally, the greatest aggregate loss occurs during the initial trafficking and typically is caused by the effects of weather, poor construction, and inadequate AST application design and material selection (McLeod 1996, Shuler 1990). Too much aggregate or not enough asphalt can cause the roller or traffic to grind the excess aggregate into the seated aggregate particles and dislodge them (North Carolina Division of Highways State Road Maintenance Unit 2000). However, not enough aggregate or too much asphalt can cause bleeding.
The vast majority of agencies use quantities of emulsion and aggregate as determined by experience and/or precedence (Roberts et al. 1996). This lack of sound design
methodology may result in ASTs that have poor performance characteristics. Although typical aggregate and emulsion application rates (AARs and EARs) are available in
specifications such as ASTM D 1369-84 and the NCDOT Standard Specifications for Roads and Structures, it is recommended that a design method be used that computes the optimum AAR and EAR for each given job condition. The development of AST design methodology essentially ceased in 1970 in North America with the introduction of the McLeod method (1969), which was subsequently adopted by the Asphalt Institute (Gransberg 2005).
this study to evaluate the performance of the AST under realistic loading conditions.
Moreover, a new comprehensive AST performance test procedure has been developed using the MMLS3 that incorporates the digital image processing (DIP) technique and the British Pendulum Test (BPT).
The AST MMLS3 performance test developed in this study is applied to: 1) an evaluation of the effects of fines content and gradation on the aggregate retention
performance and 2) an investigation of the characteristics of aggregate retention and bleeding performance using various AST application rates, thus leading to the development of an AST design equation under MMLS3 test conditions in terms of voids at the loose aggregate state. Two types of aggregate (i.e., granite and expanded slate lightweight aggregate) were selected for the aggregate retention evaluation because they are both commonly used in North
Carolina.
1.2
Research Objectives
The primary objectives of the research are:
1. to develop a performance-based test method that can be used to evaluate various performance characteristics of ASTs;
2. to evaluate the effects of fines content and aggregate gradation on the AST aggregate retention performance;
3. to investigate the characteristics of AST performance with various AST application rates and evaluate the current AST design methods;
4. to develop a design tool for ASTs under MMLS3 loading conditions as a function of voids at the loose aggregate state; and
5. to evaluate the skid resistance of selected ASTs in North Carolina using different test methods and to develop the relationships among their friction numbers.
1.3
Dissertation Organization
This dissertation is composed of seven chapters. Chapter 1 introduces the research and presents the research needs and objectives. Chapter 2 summarizes the literature review of AST aggregate retention performance test methods, the effects of various factors on AST performance, and the current AST design methods. Skid resistance measurement methods are also presented in this chapter. Chapter 3 describes physical characteristics of selected
Chapter 4, a discussion of the application rate design of ASTs using the McLeod method and the modified Kearby method is followed by a discussion of the effects of AST application rates, fines content and gradation on aggregate retention performance. Chapter 5 discusses the characteristics of aggregate retention and bleeding performances with the various AST application rates, an evaluation of current design methods, and the effects of gradation and loose aggregate voids on the optimum application rate. Chapter 6 discusses the results of skid resistance performance tests obtained from the three different test methods and their
2.
LITERATURE REVIEW
2.1
General
Several similar terms for asphalt surface treatment (AST) exist in the literature, including chip seal, seal coat, surface treatment, bituminous surface treatment, sprayed seal (Austria), and surface dressing (United Kingdom). The official term used in NCDOT specifications is asphalt surface treatment (AST) (NCDOT Standard Specifications for Roads and Structures 2002).
As a result of the continued commitment by state highway agencies (SHAs) to pavement preservation, the use of surface treatments has been steadily increasing. Thus, it is imperative for the agencies to optimize the use of those treatments in terms of prolonged service life, decreased life cycle costs, increased operational efficiency, and enhanced safety. In a recent study (Ksaibati et al. 1996) aimed at evaluating the use of surface treatment practices in the United States, twenty-five SHAs rated their ASTs as good, seven (including the NCDOT) rated them as average, while three rated them as fair. Not a single SHA believed its AST operations were excellent. Several agencies, including those in Minnesota, Virginia, South Dakota, Wyoming, and Saskatchewan in Canada, recognized the need to improve overall pavement performance and consequently invested in an evaluation of their AST operations (Ksaibati et al. 1996, Alaska DOT and Public Facilities 2001, Roque et al. 1991, Shuler 1986).
applied to roads that have an average daily traffic (ADT) count of less than 2000 vehicles (Gransberg 2005).
ASTs are not meant to enhance the structural capacity of the pavement section and, therefore, should not be applied to roads that exhibit severe distresses. There are several triggers that initiate the selection of an AST, however, such as surface wear, skid resistance, oxidation, and water infiltration. In North America, the evidence of distress and the
prevention of water infiltration constitute the most common triggers for the necessity of ASTs (Gransberg 2005).
The principal failure modes in ASTs are streaking, debonding between the existing surface and the new AST, flushing or bleeding, and loss of cover aggregate. Streaking is due to the failure to apply asphalt uniformly inch by inch across the road surface, as shown in Figure 2-1. Streaking is generally caused by the asphalt sprayer’s nozzles being clogged or perhaps set at the wrong setting or some other functional problem.
A new AST may fail to establish a good bond with an existing surface for several reasons, including the presence of a layer of dust or dirt on the existing surface, the existing surface being wet or too cold, or the asphalt being too hard. Normally, this failure to establish a good bond with an existing surface causes a problem on a small area of only a few square inches or a few square feet. Occasionally, however, a few square yards and sometimes even an entire AST can fail for this reason (McLeod 1969). A typical debonding failure of an AST is shown in Figure 2-2.
bleeding may also result from the loss of a portion of the cover aggregate for any number of reasons, such as a rainfall shortly after construction, asphalt that is too hard and fails to develop adequate adhesion with the cover aggregate, and use of cover stone that is too dirty or too wet to establish good adhesion to the asphalt (McLeod 1969, Gransberg 2005).
Other major distresses in ASTs include loss of aggregate and loss of skid resistance. Because these are the two distresses evaluated in this study, their causes and measurement methods are described in more detail in the following subsections.
Figure 2-2 Typical debonding failure of AST
2.2
Effects of Aggregate Characteristics on Asphalt Surface Treatment
Performance
Aggregate loss is one of the critical AST failure modes. Generally, the most
aggregate loss occurs during the initial traffic passes once a road is newly opened to traffic. Other major causes of aggregate loss include unexpected cold and/or wet weather, excessive aggregate, inadequate traffic control during construction, inadequate embedment of the stone particles into the asphalt, inadequate aggregate characteristics, and dusty or dirty aggregate (Shuler 1990, Gransberg 2005). The aggregate loss due to construction faults occurs within a few months, and an AST with this type of problem should be repaired rather than resealed because a reseal alone will not normally last the expected life of the AST (Transit New Zealand 2005). The aggregate properties in the AST, such as gradation, shape, moisture condition, and dust, play a major role in the aggregate retention. Also, the McLeod procedure recognizes that some of the cover aggregate will be thrown to the side of the roadway by passing vehicles as the fresh seal coat is curing. The amount of aggregate that is “whipped off” in this manner is related to the speed and number of vehicles on the new seal coat. To account for this occurrence, a traffic whip-off factor is included in the aggregate design equation. Reasonable values to assume are 5% for low volume residential type of traffic and 10% for higher speed roadways, such as county roads (Alaska DOT and Public Facilities 2001).
2.2.1 Aggregate Retention Test Methods
(Kandhal 1987, Hank and Brown 1949, Benson and Gallaway 1954, Barnat 2001, Yazgan 2004), Pennsylvania Aggregate Retention Test (PART), and the sweep test (ASTM D7000). However, each of these methods applies a different form of mechanical energy to assess the aggregate-asphalt bond interaction instead of applying a mechanical force that simulates traffic wheels. Table 2-1 provides the name of each test, the agency that developed each test, and the loading characteristic of each test method.
Table 2-1 Aggregate-Asphalt Compatibility Tests
Test Agency Characteristic
Aggregate Retention Test Texas DOT, Tex-216-F Light Sweep
Vialit Test French Public Works Inverted Tray, Ball Impact Pennsylvania Retention Test Pennsylvania DOT Inverted Tray, Sieve Shaker
AST Sweep Test ASTM WK139 Replicates Sweeping
Macrosurfacing Sweep Test Koch Materials TM101 Replicates Sweeping
The Vialit test was developed by the French Public Works Research Group and standardized in BS EN 12272-3. A stainless steel ball (1.1 lb.) is dropped three times from a height of 19.7 in. onto inverted AST trays. The standard curing time for this test is 48 hours at 140°F, and sample conditioning takes place in a freezer at -7.6°F for 30 minutes. The percentage of aggregate loss after three ball drops is used for evaluation. The impact on the sample simulates a sweeping procedure after 30 minutes of curing and also a rolling
procedure after 10 minutes of curing. This test procedure has been evaluated using an AST sample fabricated in the field and examined for the effects of aggregate gradation on different asphalts by Davis et al. (1991).
The PART was developed by the National Center for Asphalt Technology at Auburn University to evaluate the adhesion of precoated aggregate in ASTs. This test uses the Mary Ann sieve shaker’s shaking and tapping action on an inverted AST tray for five minutes to evaluate AST performance.
2.2.2 Effects of Application Rate
The most common deviation from proper practice during AST construction appears to be the application of an excessive amount of aggregate. In applying too much aggregate, materials are wasted and excess aggregate may be whipped off by rapidly moving traffic. An incorrect assumption often made regarding the application of too much aggregate is that excess aggregate can simply be swept off the surface, leaving the correct application quantity in place. However, when this practice is exercised, at least two major forms of distress result: pavement distress and vehicular distress.
Pavement distress occurs when more than one aggregate thickness is present and the excess aggregate on the surface is pushed into the layer below. This action causes
dislodgement of the first layer, thus leading to loss of aggregate and changes in grading. Crushing of aggregate can also occur; this can be offset somewhat by the inclusion of hard, durable particles, but some dislodgement nonetheless occurs, creating early aggregate loss and the potential for flushing (Shuler 1990). When larger quantities of aggregate are applied, the small stones adhere and the large stones are brushed off (Benson and Gallaway 1953). It has been reported that a considerable excess of cover material is often more detrimental than a slight shortage of cover material, in that with an excess of cover material the amount of fines applied is also increased (Kearby 1952).
2.2.3 Effects of Fines Content
that prevents adhesion to the aggregate. That is, good results cannot be assured with dusty or dirty aggregate (The Asphalt Institute 1967).
Washing and drying the aggregate by mechanical means before application solves this problem almost entirely (Kandhal and Motter 1992). It is recommended that the aggregate be sprayed with water a couple of days prior to the start of the project. Washing AST aggregate with clean, potable water prior to application may assist in removing fine particles that prevent adhesion with the asphalt (Gransberg 2005). High float emulsion and polymer-modified emulsion can be successfully used with somewhat dusty aggregate because they permit a thicker and tackier asphalt film on the aggregate (Alaska DOT Public Facilities 2001).
Dust is normally defined as the percentage of fines that passes the No. 200 sieve. To improve the quality of the material in ASTs, the percentage of fines passing the No. 200 sieve has been specified in many states as a maximum of 2% at the time of manufacture, and some states require 0.5% or less passing the No. 200 sieve (Kandhal 1987, Alaska DOT Public Facilities 2001). The maximum allowable fines contents for various states are summarized in Table 2-2.
The effect of fines on aggregate retention has been studied using various test methods, including the ART (Tex-216-F), vacuum test, PART, and Vialit test. Benson and Gallaway (1953) conducted the ART (Tex-216-F) and the vacuum test and found that the presence of dust even in relatively small quantities can cause a reduction in aggregate retention.
specify a maximum of 2% dust for unwashed aggregates, Kandhal reports that 2% seems to be reasonable for low volume traffic roads, particularly if the cost of washing or precoating is very high.
Yazgan (2005) modified the Vialit test by applying more mechanical impact energy to assess the aggregate-asphalt bond. He found that fines content affects the aggregate retention independently of the embedment depth.
Table 2-2 Specification of Maximum Percentage of Fines Content (Kandhal 1987)
State Maximum Percentage Passing No. 200
Alabama 1.0 Florida 3.75 Indiana 2.0 Kansas 2.0 Maryland 1.0
North Carolina 1.5
North Dakota 4.0
Ohio 3.0 Pennsylvania 2.0
South Carolina 0.0
South Dakota 2.0
2.2.4 Effects of Gradation
Aggregate gradation plays a key role in the design, construction, and performance of ASTs. The specified gradation should be such that the texture of the seal is consistent. Tight gradation bands, which ensure a uniformly graded aggregate with minimal fines and dust, are necessary for a quality project. The literature and surveys show a consensus that single-sized aggregate with less than 2% passing the No. 200 sieve is considered ideal (Gransberg 2005). One of the most important advantages of using a one-size cover aggregate in a surfacing operation is that maximum contact is obtained between the tire and the surface. Such contact increases the frictional area and, thus, there is better skid resistance as long as the correct quantity of asphalt is used (Herrin et al. 1968).
The aggregate should be as close to uniform size as is economically practical so that the AST has only one layer of aggregate. If there is a significant difference between the largest and the smallest sized particles, the asphalt film may completely cover the smaller ones and prevent proper embedding of the larger particles. Generally, the largest size for a surface treatment aggregate should be no more than twice the smallest size, with a reasonable tolerance for oversize and undersize to allow for economical production (The Asphalt
Institute 1967). As the magnitude of the tolerance is increased, it is believed that performance quality is sacrificed. Therefore, from the viewpoint of overall economy, it may be preferable to have higher initial costs to obtain close to one size of aggregate that performs well than to have lower initial costs and higher annual maintenance expenses (McLeod 1960).
Benson and Gallaway (1959) found that an increase in the fines content from 0 to 30% of the aggregate causes a 10% reduction in aggregate retention. Therefore, in order to retain the most cover stone that adheres for a given maximum size, it is desirable to have cover aggregate that is nearly uniform in gradation. This gradation issue is also tied in with economical considerations because aggregate costs must necessarily increase as the gradation requirements become more restrictive. However, if two aggregates are otherwise the same in price and quality, the aggregate that has the uniform gradation is preferred.
Kandhal (1991) also reports a reduction in aggregate retention with the use of graded cover stones. These graded stones contain additional smaller particles that tend to fill the voids between large particles and, thus, may not become effectively embedded into the applied asphalt.
2.3
Asphalt Surface Treatment Design Methods
Table 2-3 Summary of Design Methods
Modified Kearby McLeod 2004 New Zealand Factors for
aggregate application rate
(AAR)
• Board test • Aggregate gradation • Flakiness index
• Bulk specific gravity of aggregate • Loose unit weight of aggregate • Wastage
• Aggregate gradation • Flakiness index
• Bulk specific gravity of aggregate • Wastage Factors for emulsion application rate (EAR) • AAR
• Bulk specific gravity of aggregate • Loose unit weight of aggregate • Traffic correction
• Surface condition correction • Seasonal adjustment
• Percentage of residual asphalt in emulsion
• Aggregate gradation • Flakiness index • Traffic correction
• Bulk specific gravity of aggregate • Loose unit weight of aggregate • Surface condition
• Aggregate absorption
• Percentage of residual asphalt in emulsion
• Traffic volumes
• Aggregate gradation • Flakiness index
• ADT
• Percentage of heavy commercial vehicles per day
• Texture depth • Soft substrate • Absorptive surfaces • Steep grades • Aggregate shape • Traffic volumes Reference
voids for AAR
Voids at the board test condition, approximately 50%
Voids at ultimate compacted AST state, 20%
Voids at two-year light traffic volumes, approximately 40% Reference
voids for EAR
Voids at the board test condition, approximately 50%
Voids at ultimate compacted AST state, 20%
Voids at the first major frost day, normally higher than 40% Embedment
depth (%)
Variable in terms of AST mat
thickness and aggregate type 65-80 35
Synthetic
aggregate Considered in EAR Not considered Not considered
2.3.1 Hanson Design Method
The Hanson design method was developed primarily for liquid asphalt, particularly cutback asphalt, and it is based on the average least dimension (ALD) of the cover aggregate spread on the pavement. Hanson calculated the ALD by manually callipering a representative aggregate sample to obtain the smallest value for the ALD that represents the rolled cover aggregate layer. He observed that when cover aggregate is dropped from an aggregate spreader onto asphalt, the voids between the aggregate particles are approximately 50%. He theorized that when the layer is rolled, this value is reduced to 30%, and it is further reduced to 20% when the cover aggregate is compacted by traffic, as shown in Figure 2-4. Hanson specified the percentage of voids to be filled by residual asphalt to be between 60% and 75%, depending on the type of aggregate and traffic level (Hanson 1934/35).
approx. 20% voids approx.
30% voids
Aggregates after trafficking (some breakdown and embedment) Aggregates after initial rolling
Aggregates dropped at random on aspahalt
Average height of aggregates
Average height of aggregates
Average AST thickness equals ALD of aggregate approx.
50% voids
2.3.2 2004 New Zealand Method
The Hanson method has evolved into the 2004 New Zealand. Potter et al. (1976) and Patrick (1999) indicate that the total volume of voids is significantly higher than 20% in a compacted seal, and that voids continue to decrease with further compaction under traffic. This finding was adopted in the 2004 New Zealand. This method was developed as a performance-based AST design method that considers the aggregate loss during the first winter as well as the AST voids reduction model (Transit New Zealand 2005). One of the major difficulties involved in the design of material application rates is non-uniformity of the substrate. The 2004 New Zealand employs a substrate correction factor using the sand circle (sand patch) test for the texture depth of the substrate and the ball penetration test for soft substrate.
2.3.3 McLeod Method
Throughout the 1960s, McLeod (1969) developed an AST design procedure based partly on Hanson’s previous work and also on empirical relationships and observations. His method covers both single and multiple applications of surface treatments and, like any pavement design method, it determines the quantity of aggregate, quantity and type of asphalt, and rate of asphalt application. These quantities are determined based on several equations McLeod developed (1969).
Quantity of Aggregate
80% of the aggregate will ultimately be embedded into the pavement;
the aggregate is one size (the equation is slightly modified for graded aggregate); and
the aggregate will ultimately arrange itself so that the thickness of the layer is equal to the ALD of the aggregate.
Additional consideration must be given to the type of aggregate, the type of supporting layer, climatic variations, etc.
Quantity of Asphalt
The equation used to determine the quantity of asphalt is also based on several assumptions:
20% of the total surface treatment will ultimately be asphalt (80% embedment of aggregate);
the aggregate is one size (the equation is slightly modified for graded aggregate); and
the temperature during measurement is 60°F (if different than 60°F the value must be corrected).
2.3.4 Kearby Method
One of the first efforts in the United States toward AST mix design was made by Jerome P. Kearby (1953). Kearby developed a design method to determine the amounts and types of asphalt and aggregate for one-course ASTs. Kearby’s work resulted in the
development of a monograph that provides an asphalt cement application rate in gallons per square yard for the input data of average thickness, percentage of aggregate embedment, and percentage of voids (Kearby 1953). Kearby recommends the use of a uniformly graded aggregate by outlining eight grades of aggregate based on gradation and associated average spread ratios. He also recommends that the combined flat and elongated particle content not exceed 10% of any aggregate gradation requirement. The Kearby method accounts for the effects of existing pavement conditions and traffic volume on the optimum aggregate embedment depth. The percentage of embedment should be increased for hard aggregates and reduced for soft aggregates in the case of ASTs on an existing hard surface. For ASTs under heavy traffic, the percentage of embedment should be reduced, along with the use of larger-sized aggregates; and under low volume traffic, the percentage of embedment should be increased, with the use of medium-sized aggregates.
2.3.5 Modified Kearby Method (Texas)
may turn over and subsequently ravel under traffic. In a separate research effort, Epps et al. (1980) continued the work done in Texas by Kearby (1953) and Benson and Gallaway (1953) by undertaking a research program to conduct a field validation of Kearby’s design method. Data from before and after the construction of 80 different projects were gathered and analyzed for this purpose (Holmgreen et al. 1985). It was observed that the Kearby design method predicted lower asphalt application rates than those used in the Texas practice, and so the Epps study proposed two changes to the design procedures. The first one was a correction to the asphalt application rates based on level of traffic and existing pavement conditions. The second change justified the shift of the original design curve proposed by the Kearby and Benson-Gallaway methods, as suggested for lightweight aggregates (Epps et al. 1974). Since then, practitioners and researchers have labeled this design approach as the Modified Kearby Method.
In this method, the AAR is determined using the laboratory board test method where only one aggregate layer is placed in a ½ yd2 area. The dry loose unit weight and the bulk specific gravity of the aggregate are determined and used to convert the amount of aggregate to cover the ½ yd2 area to an AAR in the field. The test board is made of plywood or
masonite with sides framed by 12 mm (1/2 in.) molding strips. The asphalt application rate is determined by an equation that includes the traffic level (vehicles per day per lane), the existing surface conditions, the residual quantity of asphalt in the emulsion or cutback, and the field factor based on field experience.
the best for the EAR prediction. In the Epps study (1974), an unusually high AAR from the Hanson method was reported for the lightweight aggregate, which may be due in part to the difference in the aggregate bulk specific gravity of the lightweight aggregate and the
conventional aggregate.
2.3.6 Multiple AST Designs
Multiple ASTs consist of two or three successive alternate applications of asphalt and aggregate. The official names for such double ASTs and triple ASTs in North Carolina are split seal and triple seal, respectively.
The McLeod method and the 2004 New Zealand method present both single and multiple AST design methods. These design methods apply the same fundamental design concept regardless of the number of AST layers. The reason for this is based on the assumption that the asphalt and aggregate required for each layer of a multiple AST are identical, with minor adjustments, to the EAR and the AAR that would be applied if each layer were to serve as an isolated single application AST. It is noted that in the McLeod method, the aggregate size of the second layer should be one-half the size of the aggregate in the first layer. This change in aggregate size is recommended because 1) using coarse
aggregate for the bottom layer can support heavier traffic volumes and 2) using smaller aggregate for the top layer can reduce windshield damage and tire noise.
The design procedure used to determine AARs and EARs for multiple ASTs is as follows:
1. Design for each layer’s AAR and EAR, as if it were to be the only layer.
first layer can form a sparsely coated aggregate layer that can cause debonding of the layers and aggregate loss due to the lack of top layer aggregate embedment.
3. Except for the first course, make no correction for the underlying surface texture. Add together the EARs determined for each layer to obtain a total asphalt
requirement.
For the split seal, the total EAR is divided into each layer of the bottom and top courses with a specified proportion (60-40 or 50-50 or 40-60), depending on the design method. The 40-60 split is used in New Zealand (Transit New Zealand 2005). For the triple seal, the recommended split ratio is 40-40-20 or 30-40-30 for the first, second, and third applications (McLeod 1969). The recommended AARs and EARs in the NCDOT specifications are shown in Table 2-4.
Table 2-4 Recommended EAR and AAR (NCDOT Standard Specifications for Roads and Structures 2002)
Type of AST Total EAR
(gal/yd2) Aggregate size
Total AAR
(lb/yd2)
Straight seal 0.35-0.40 No. 78M 17-22
Split seal 0.45-0.50 No. 78M 30-35
Triple seal 0.60-0.75 No. 78M 45-51
2.3.7 Other Design Methods
Mackintosh, (i) American Bitumen, and (j) Asphalt Institute. Although the procedures in the various design methods are not the same in all details, a number of factors are common to all (Gransberg 2005). Some of these design methods, including the Hanson, California, modified Kearby, Lovering spread modulus, and McLeod were evaluated using the MMLS3 test and are discussed in Chapter 5.3.
2.3.8 Reference Voids for AST Design
Most international AST design methods use the voids concept for their designs. The various voids reduction behaviors are defined according to the different design methods. Furthermore, the different design methods use different reference voids for their AAR and EAR designs.
In the modified Kearby method, the initial voids before roller compaction are used as the design reference voids, which are the voids at the loose aggregate state, normally around 40%-50%. This method does not include a wastage factor which can provide a better
aggregate structure in the ASTs and reduce the possibility of an uncovered aggregate area of existing pavement caused by the uneven aggregate distribution. The AAR is determined by the board test, and the EAR is determined based on the amount of emulsion that fills the loose state voids in an AST that shows a good AST performance after substantial traffic.
after approximately one year, as shown in Figure 2-5. Based on 20% voids reduction, 80% of AST volume is comprised of the aggregate, and a certain embedment depth percentage of 20% voids is applied for the EAR determination. The embedment depth percentage equals the volume of emulsion percentage in the volume of AST voids.
The Hanson method (1934/35) has evolved into the 2004 New Zealand method. According to this method, the total volume of voids is significantly higher than 20% in a compacted AST, and the percentage of voids continues to decrease with further compaction under traffic, as shown in following equation:
) ( log 07 . 0 83 . 0
(%) 10 elv
Voids = − (1) where
elv = cumulative number of equivalent light vehicles, based on the assumption that one heavy commercial vehicle (HCV) is equivalent to ten cars.
ASTs in North Carolina are applied to roads that have an average daily traffic (ADT) of less than 2000 vehicles. The AST routine service life in North America is 5.76 years (Gransberg 2005). Based on the above information, the elv is calculated as 7,989,120 with 10% HCV. The voids reduction rate is shown in Figure 2-5.
0 10 20 30 40 50 60
0.0E+00 3.0E+06 6.0E+06 9.0E+06
Cumulative Traffic
V
oi
d
s (%
)
2004 New Zealand McLeod
McLeod Modified Kearby
2004 New Zealand
Figure 2-5 Reference voids for AAR determination with various design methods
0 10 20 30 40 50 60
0.0E+00 3.0E+06 6.0E+06 9.0E+06
Cumulative Traffic
Vo
id
s (
%
)
2004 New Zealand McLeod McLeod Modified Kearby 2004 New Zealand
First major frost day
2.4
Skid Resistance of Asphalt Surface Treatments
In North America, loss of skid resistance is one of the common road conditions that indicate the need for an AST; thus, one of the major advantages of surface treatments is the increase in skid resistance (Gransberg 2005). Pavement characteristics comprise only one element in the multiple component system of a skid accident that involves the driver, roadway, the vehicle, and the weather. Road surface conditions that are indicative of potential safety hazards include bleeding, polished aggregate with a smooth microtexture, a smooth macrotexture, rutting, and an inadequate cross slope (Huang 1993).
Most SHAs have a specified cycle in which skid resistance is measured as a part of their pavement management system. The skid resistance measurements are invaluable to the decision-making as to which roads require surface treatment. However, there is no evidence that a single public highway agency has used skid numbers to directly evaluate the
performance of ASTs (Gransberg 2005).
Skid resistance changes over time. Typically, it increases in the first two years following construction as the asphalt is worn away by traffic, then decreases over the remaining pavement life as aggregates become more polished. Skid resistance tends to increase in winter when wet and cold weather creates a gritty detritus that roughens the surface. In drier summer conditions, this surface detritus is dusty, and the dust polishes the surface, resulting in a reduction in skid resistance. This seasonal variation is quite significant and can severely skew skid resistance data if not properly taken into consideration. The winter recovery may not be sufficient to balance the summer polishing (Jayawickrama and Thomas 1998, Hunter 2000).
textural and drag or friction testing. These test methods are explained in the following subsections.
2.4.1 Textural Measurement
Road pavement texture is categorized into four levels by the World Road Association (formerly known as the Permanent International Association of Road Congress or PIARC). These levels and their corresponding texture wavelengths are presented in Table 2-5.
Microtexture and macrotexture are the two levels of pavement texture that affect the friction between the pavement and the tire. If both microtexture and macrotexture are maintained at high levels, they can provide good resistance to skidding on wet pavement (Henry 2000).
Henry (2000) reports that no practical procedure for the direct measurement of microtexture profiles in traffic currently exists. The portions of the pavement surface that make contact with the tires are polished by traffic, and it is the microtexture of the surface of the exposed aggregate that comes into contact with the tire that affects the friction. Wet pavement friction at low speeds is primarily affected by the microtexture.
Table 2-5 PIARC Texture Definitions (Kuttesch 2004)
Texture Level Wavelength (λ)
Microtexture λ < 0.5 mm
Macrotexture 0.5 mm < λ < 50 mm
Ergun et al. (2005) researched the development of microtexture measurement methods with an image analysis technique that can precisely measure the road surface microtexture under laboratory conditions. Also, they developed and correlated a new friction coefficient prediction model using macrotexture and microtexture.
Meyer (1991) states that there are three common methods for measuring pavement macrotexture: profilometers, volumetric, and outflow. Profilometers typically use lasers to generate a two-dimensional assessment of the pavement macrotexture. The volumetric measurement technique, commonly called the sand patch method and specified in ASTM E 965 Standard Measuring Pavement Macrotexture Depth Using a Volumetric Technique, involves spreading a known volume of a single-sized material in a circle on the pavement surface. The volume divided by the area is reported as the mean texture depth (MTD).
Roque et al. (1991) studied the performance and the prediction of AST life. The MTD, as measured by the sand patch test, is used to characterize the surface texture and to evaluate the in-service performance of the seal coat. The MTD measurement may also be used to estimate the remaining life of the AST.
The outflow method measures the time for a known volume of water to flow from a cylinder placed on the pavement surface. The time is reported as the outflow time (OFT). The OFT is highly correlated with the MTD for nonporous pavements (Henry 2000).
2.4.2 Friction Measurement
Seneviratne (1994) studied the safety effects of ASTs using the skid resistance number in an effort to determine countermeasures to potential accidents. Although the average accident rate seems to have decreased after ASTs were applied, a definite relationship between the skid number (SN) and accident rate in the road sections that underwent AST application is not evident.
Pavement friction is measured most frequently in accordance with the locked wheel method (the LWST), as specified in the ASTM E 274 Standard Test Method for Skid Resistance of Paved Surfaces Using a Full-Scale Tire. The locked wheel friction testers usually operate at speeds between 40 and 60 mph. Once the target test speed has been
attained, a film of water is sprayed onto the pavement 10 to 18 inches in front of the test tire. This water film has a nominal thickness of 0.02 in. (0.5 mm). At this point, the wheel is locked for a period of 1 sec., and the frictional force is measured and averaged over that period of time. The SN from this test is calculated by dividing the horizontal force by the vertical load and then multiplying by 100 to obtain a whole number, which could
theoretically range from 0-100.
A SN below 40 in North Carolina indicates roads that need further study or corrective action to improve skid resistance. Most SHAs have established their own minimum SN requirements, as shown in Table 2-6.
the GripTester braked wheel fixed slip device.) The GT measures the longitudinal friction coefficient (LFC) between the pavement and a measuring wheel, which is a specific,
designated tire. A sliding rate that generates the grip force is obtained by a mechanical drive between the two carrying wheels and the measuring wheel. The measuring wheel axis is equipped with a pressure gauge system that permits the measurement of reactions, that is, the vertical force (FV) and the horizontal force (FH). The LFC measured by the GT is referred to as the grip number (GN) and is proportional to the ratio FH over FV. Table 2-7 explains the friction values of the GT for the Federal Aviation Administration (FAA) classification levels, qualified at a 40 mph test speed.
Table 2-6 Proposed Minimum Skid Number (Henry 2000)
State Minimum Skid Number (SN at speed 40 mph)
Idaho 30 Illinois 30 Kentucky 28
New York 32
South Carolina 41
Texas 30 Utah 35 Washington 30
Wyoming 35
employs a pendulum that swings across a wet section of the pavement, and the amount of retardation (drag) caused by the pavement is measured by a dial on the pendulum tester. The British Pendulum Tester is an easy device to use, and provides repeatable results and a good measurement of skid resistance. The Tester is fitted with scales that measure the recovered height of the pendulum in terms of a British Pendulum Number (BPN) over a range of 0 to 140. The typical slip speed for the BPT is commonly assumed to be about 6 mph (10 km/h). The BPN is used mainly as a substitute for the microtexture test.
Corley-Lay (1998) performed skid resistance tests on hot-mix asphalt (HMA) pavements with various surface course mixtures. She concludes that neither the BPT nor the sand patch test can be used to predict the friction number from a LWST with sufficient accuracy. However, it must be noted that her conclusions are based on the test results from HMA pavements, not ASTs.
Table 2-7 Friction Level Classifications for Runway Pavement Surfaces
40 mph 60 mph
Minimum Maintenance Planning
New Design /
Construction Minimum
Maintenance Planning
New Design / Construction
2.5
Material Selection of Asphalt Surface Treatments
AST material selection is generally dependent upon climatic conditions, aggregate quality, and product availability. Aggregate selection is a function of geological availability and transportation distance of the aggregate. The pavement’s surface, size and gradation of aggregate, and local climate are considered for the asphalt selection process (Gransberg 2005).
ASTs in North Carolina are specified with No. 78M for the aggregate size and CRS-2 or RS-2 for the asphalt type (NCDOT Standard Specifications for Roads and Structures 2002). The most common size of aggregate for a straight seal is usually a 3/8 in. (10 mm) Nominal Maximum Size of Aggregate (NMSA) (Gransberg 2005). The lightweight
aggregate has been popularly used as AST material in North Carolina. This material in ASTs provides a very skid-resistant surface, provides good color contrast which improves visibility in daylight and at night, provides a surface on which paint striping maintenance is reduced, and eliminates glass damage caused by flying stone (Epps et al. 1974). However, the lightweight aggregate size has not been specified in North Carolina.
Table 2-8 Types of Materials used for ASTs in North Carolina
Layer Aggregate Asphalt
Top Sand, 78M, or Screenings Third
Second
78M or Lightweight 5/16 in. Mat and Seal
Bottom No. 5, No.57, No.6, or No.67 Straight Seal 78M or Lightweight 5/16 in.
Top Sand, 78M, Lightweight 5/16 in., or Screenings
Split Seal
Bottom 78M or Lightweight 5/16 in.
Top Sand, 78M, Lightweight 5/16 in., or Screenings
Middle Triple Seal
Bottom
78M or Lightweight 5/16 in.
3.
MATERIALS AND TESTING METHODS
3.1
Material Selection
In this project, two types of aggregate are selected to be used with the CRS-2 emulsion: expanded slate (lightweight aggregate) with a 5/16 in. NMSA and granite No. 78M. The granite aggregate comes from the Garner quarry; the lightweight aggregate is produced by the Carolina Stalite Company using a rotary kiln expanded slate lightweight aggregate. The CRS-2 emulsion is obtained from SEACO in Columbia, South Carolina.
3.2
Component Material Properties
3.2.1 Gradation of Aggregate Particle Size
aggregate and the granite aggregate, respectively. Therefore, the lightweight aggregate has a more uniform aggregate particle size than the granite aggregate.
Table 3-1 Summary of the Sieve Analysis
Percentage Passing Sieve Size
Lightweight Granite
1/2 in. 100.0 100.0
3/8 in. 100.0 95.4
1/4 in. 66.0 64.8
No. 4 23.7 40.1
No. 8 4.9 7.4
No. 16 3.5 2.4
No. 50 2.6 0.8
No. 100 2.2 0.7
No. 200 1.6 0.4
0 25 50 75 100
0.10
Sieve Size Raised to the 0.45 Power
P
ercent
age P
as
si
ng
Spec. for 78M
Granite 78M
Lightweight 5/16"
No.4 1/4" 3/8" 1/2" No.50 No.16 No.8
No.200 No.100
0.15 0.3 1.18 2.36 4.75 6.3 9.5 12.5
0.075 19 mm
3/4"
Figure 3-1 Aggregate particle size gradations
3.2.2 Flakiness Index
The Flakiness Index (FI) is a measure of the percentage, by weight, of flat particles. It is determined by testing a small sample of aggregate particles for their ability to fit through a slotted plate (Figure 3-2). There are five slots for five different sizes (fractions), of the aggregate (Table 3-2). If the aggregate particles fit through the slotted plate, they are considered to be flat. If not, they are considered to be cubical.
Table 3-2 Slot Sizes Required for Different Fractions of Aggregate Size
Size of Aggregate
Passing Retaining
Slot Width, in.
1 in. 3/4 in. 0.532
3/4 in. 1/2 in. 0.384
1/2 in. 3/8 in. 0.258
3/8 in. 1/4 in. 0.184
1/4 in. No. 4 0.123
Table 3-3 Flakiness Index of Aggregates
Aggregate Type Lightweight Granite
Flakiness Index (%) 8.28 24.01
3.2.3 Average Least Dimension
The average least dimension, or ALD (H), is determined from the median particle size (M) and the FI. It is a reduction of the median particle size after accounting for flat particles. The ALD represents the expected AST thickness in the wheel paths where traffic forces the flat chips to lie on their flattest side. The ALD is calculated as follows:
100 ) )( 011506 .
0 ( 139285 .
1 + ×
=
FI M
H
(2)
where
H = average least dimension, in. or mm; M = median particle size, in. or mm; and FI = flakiness index, in percent.
Table 3-4 Average Least Dimension of Lightweight and Granite Aggregate
Aggregate Type Lightweight Granite
Average Least Dimension 0.18 in. (4.57 mm) 0.15 in. (3.81 mm)
3.2.4 Bulk Specific Gravity
Table 3-5 Bulk Specific Gravity (BSG) of Aggregates
Lightweight Granite Aggregate Type
Standard BSG Standard BSG
Retained on No. 8 Sieve Tex-433A 1.62 ASTM C 127 2.65 Passing No.8 and Retained
on No. 200 Sieve ASTM C 128 1.94 ASTM C 128 2.63 Passing No. 200 Sieve ASTM D 854 2.55 ASTM D 854 2.52
Total BSG 1.66 2.64
Figure 3-4 Loose unit weight test
3.2.5 Loose Unit Weight of Aggregate
The loose unit weight (W) is determined by ASTM C 29 (Figure 3-4) and is needed to calculate the voids in the aggregate in a loose condition. The design requirements for the quantities of cover aggregates to be applied per square yard for the AST are based on the ASTM BSG of the cover stone and on the fraction of voids in its loose weight condition. The fraction of voids (V) is calculated from the following equation, and the results are shown in Table 3-6:
G W V
4 . 62 1− =
(3) where
G = bulk specific gravity of the aggregate;
V = voids in the loose aggregate, expressed as a decimal.
Table 3-6 Loose Unit Weight Test Results
Aggregate Type Lightweight Granite
Total Bulk Specific Gravity, G 1.66 2.64
Loose Unit Weight (lbs/ft3), W 49.48 87.13
Voids in the Loose Aggregate, V 0.51 0.47
3.2.6 Aggregate Absorption
Figure 3-5 Rice vacuum saturation test
Table 3-7 Asphalt Absorption Test Results
Aggregate Type Lightweight Granite
Effective Specific Gravity 1.64 2.67
Asphalt Absorption (%) 0.48 0.38
3.2.7 Residual Asphalt Content
3.3
Specimen Preparation
With the exception of specimen shape and curing time, the MMLS3 specimen fabrication procedure complies with the sweep test procedure that is specified by the ASTM D7000. The AST specimen used in the MMLS3 testing has a rectangular shape with curved ends (Figure 3-8 (b)) whereas the sweep test specimen is circular. The modification of the circular sweep test specimen to a rectangular specimen is necessary because, during the aggregate retention test, some dislodged aggregate particles landed on untrafficked areas of the circular specimen and, therefore, were counted as retained aggregate. It is noted that the circular specimens were used in visual AST observation for determining the optimum AST application rates, and the rectangular specimens were used in the rest of research.
The wheel path under wandering MMLS3 loading is 7.1 in. wide, yielding a total area of 72.3 in2. Fabrication requires a felt disk with a diameter of 11.8 in. and a template with a rectangular hole. The felt disk was placed on a balance, and the template was placed and centered over the felt disk. The emulsion, heated to 158°F, was sprayed onto the felt desk according to the design application rate, and the preweighted aggregate was immediately applied to the emulsion (Figure 3-6(a) and Figure 3-6(b)). Once the aggregate had been placed on the emulsion (Figure 3-6(c)), the aggregate particles were compacted using the half-circle hand kneading compactor for three half-cycles along the wheel pass direction of the specimen (Figure 3-6 (d)). The time required for the fabrication was approximately 25 minutes.
The curing of the AST specimen was studied before developing the specimen
30 ± 3% relative humidity (RH). The degree of curing was determined by measuring the weight change of the 2 emulsion in terms of time. In Figure 3-7, the weight of the CRS-2 residue is normalized by the initial weight and expressed as a percentage decrease due to the increasing curing time. Most of the water in the CRS-2 emulsion evaporated within 12 hours, and the final residue percentage was slightly over 70%, which was obtained from the emulsion residue test by evaporation. In this project, all the specimens were cured at 95°F and 30 ± 3% RH for 24 hours to fully break and cure the emulsion for the AST performance test.
(a) (b)
(c) (d)
70 80 90 100
0 5 10 15 20 25 30 35
Time (hr)
Re
si
d
u
e o
f CRS
-2
(
%
)
@ 35± 0.1ºC & RH 35±1%
Residue by Evaporation (ASTM D244) = 68-70%
Figure 3-7 Weight changes of CRS-2 emulsion due to curing
3.4
Flip-Over Test
The flip-over test (FOT) is the part of the sweep test procedure (ASTM D7000) that measures the amount of excess aggregate on the specimen. At the end of the curing time, the specimen was turned vertically upright and any loose aggregate was removed by lightly brushing the specimen. The specimen was weighed before and after the FOT to determine the amount of excess aggregate on the specimen.
3.5
MMLS3 Performance Test Procedure
These wheels are pneumatic tires that are 11.8 inches in diameter, approximately one-third the diameter of a standard truck tire. The wheels travel at a speed of about 5,500 wheel applications per hour, which corresponds to a dynamic loading of 3.3 Hz on the pavement surface. This loading consists of a 0.3 sec. haversine loading time and a rest period of 0.3 sec. The dynamic load on the pavement surface by the MMLS3 in motion was measured by a Flexiforce® pressure sensor. The mean value of maximum dynamic loads from the four wheels was approximately 802.6 lbf. The contact area was measured to be approximately 5.27 in.2 from the footprint of one MMLS3 wheel inflated to 101.5 psi, thus resulting in a surface contact stress of approximately 152.1 psi (Lee 2004).
The major steps in the MMLS3 test preparation are shown in Figure 3-8. For AST testing under the MMLS3, specimens are attached to thin steel plates that are fastened to a steel base plate, as illustrated in Figure 3-8 (c). MMLS3 loading was applied after a 3-hour temperature preconditioning period at 77°F. The weight of the specimen attached to the steel plate was measured before and after the MMLS3 loading to determine the aggregate loss. Also, the AST was examined visually during the MMLS3 testing to determine the amount of bleeding.
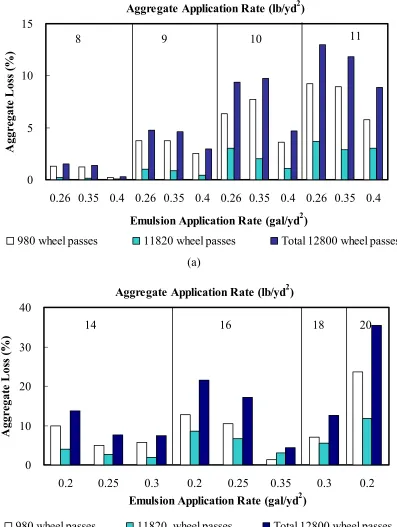
The aggregate loss during the initial traffic loading in the field (normally occurring within half a day) was measured after one wandering cycle of the MMLS3 loading. Then, MMLS3 loading was applied and the weight measurements were taken periodically over a 2-hour period (equivalent to 11,820 wheel loads) to evaluate the aggregate retention