DOI: 10.1534/genetics.107.083105
Interplay of Developmentally Regulated Gene Expression and
Heterochromatic Silencing in
Trans
in Drosophila
Brian T. Sage,
1Michael D. Wu and Amy K. Csink
2Department of Biological Sciences, Carnegie Mellon University, Pittsburgh, Pennsylvania 15213 Manuscript received October 8, 2007
Accepted for publication November 30, 2007
ABSTRACT
ThebrownDominant(bwD) allele of Drosophila contains a heterochromatic block that causes the locus to
interact with centric heterochromatin. This association silencesbw1in heterozygotes (
trans-inactivation) and is dependent on nuclear organizational changes later in development, suggesting that trans -inactivation may not be possible until later in development. To study this, a Pelement containing an upstream activating sequence (UAS)–GFP reporter was inserted 5 kb from thebwDinsertion site. Seven
different GAL4 driver lines were used and GFP fluorescence was compared in the presence or the absence ofbwD. We measured silencing in different tissues and stages of development and found variable silencing
of GFP expression driven by the same driver. When UAS–GFP was not expressed until differentiation in the eye imaginal disc it was more easily trans-inactivated than when it was expressed earlier in undif-ferentiated cells. In contrast to some studies by other workers on silencing incis, we did not find con-sistent correlation of silencing with level of expression or evidence of relaxation of silencing with terminal differentiation. We suggest that such contrasting results may be attributed to a potentially different role played by nuclear organization incisandtransposition-effect variegation.
P
OSITION-EFFECT variegation (PEV) is the silenc-ing of gene expression by nearby heterochroma-tin. The phenomenon was first described in Drosophila and has long served as a model for the downregulation of expression by chromatin compaction and changes in higher-order chromatin organization. Classiccis-acting PEV results from a chromosomal break and rejoining that juxtaposes a euchromatic gene and a block of con-stitutive heterochromatin. In contrast to earlier ideas concerning the continuous, straightforward linear spread-ing of the silent state, a collection of recent studies have found that the phenomenon is more complex. Many factors influence the susceptibility or resistance of a gene to silencing by heterochromatin incis, such as the size, composition, and distance of the heterochromatic block and, most importantly, the specifics of the ex-pression properties of the gene being silenced (for review see Talbertand Henikoff 2006).While these studies addressedcis-acting PEV, there is a similar, related phenomenon in flies of silencing by heterochromatin intrans. Intrans-acting PEV, or ‘‘trans -inactivation,’’ the block of heterochromatin and the silenced gene are not necessarily on the same DNA molecule, but are brought close to each other within the space of the interphase nucleus. It is probable that this
type of PEV is similar to downregulation of a number of normal genes in higher eukaryotes, as increasing evi-dence finds developmentally silenced loci that move into association with large blocks of heterochromatin (for example, see Suet al.2004). A well-studied example of trans-inactivation is the brownDominant (bwD) allele of the Drosophila melanogaster brown (bw) eye-color gene. The bwD allele contains an insertion of 1.6 Mbp of heterochromatin into thebrowncoding sequence (Platero
et al.1998). Except for a few small distinct spots, eyes of
bwD /bw1
flies totally lack red eye pigment. The trans -inactivation of the bw1
gene on the homologous chro-mosome is a consequence of the repositioning ofbwD into the pericentric heterochromatic compartment (Csink and Henikoff1996; Harmonand Sedat2005; Thakar
et al. 2006) through interactions of heterochromatic binding proteins (Sage and Csink 2003). In bwD/bw1 heterozygotes somatic pairing of the homologs causes thebw1chromosomal region to associate with
pericen-tric heterochromatin along with the bwD heterochro-matic insertion. Hence, the wild-typebwgene is silenced due to its localization in a neighborhood of the nucleus inhibitory to its transcription.
In parallel to the work oncisPEV, studies have found that some genes are resistant to trans-inactivation. Martin-Morris et al. (1997) have demonstrated that some mini-white transgenes can be trans-inactivated while full-lengthwhitecannot. Additionally, earlier work of ours demonstrated that transgenes with different promoters have different susceptibilities to silencing by
1Present address:Brown University, Providence, RI 02912.
2Corresponding author: University of Washington, Department of
Biology, 24 Kincaid Hall, Box 351800, Seattle, WA 98195-1800. E-mail: [email protected]
heterochromatin intrans(Csinket al.2002). One factor that differed between these promoters was the develop-mental time of expression. This is intriguing, as studies oncis-acting PEV have shown that development plays a role in silencing (Luet al.1996; Weilerand Wakimoto 1998; Ahmadand Henikoff2001). The studies oncis -acting PEV and trans-inactivation have provided in-triguing results and suggest additional questions to be addressed. For example, does gene expression play the same role in the ability of a gene to be silenced incis
and in trans? In the circumstance of cissilencing the silenced gene is always located near heterochromatin, while intrans-inactivation the heterochromatic associa-tion required for silencing changes during develop-ment (Thakarand Csink2005). Because of this, one may predict that a gene with the same pattern of ex-pression could have different susceptibilities tocisand
transsilencing.
Here we study the role that temporal, spatial, and quantitative differences in gene expression play in the susceptibility of a gene totrans-inactivation. We use an upstream activating sequence (UAS)–GFP transgene near thebrownlocus in combination with lines activating GAL4 in specific patterns of expression (Brand and Perrimon 1993). This allows an examination oftrans -inactivation when the reporter is expressed in different times of development and in different tissues and cell types. We find that transgenes whose expression is de-layed until differentiation are more likely to be silenced, while those with earlier expression are more resistant to silencing. Additionally, we found no general trend toward increased or decreased silencing of transgenes as adult flies aged, except that there was a bit less
silencing in freshly emerged adults. We also did not find a tendency for silencing established in earlier develop-mental stages to be lost upon differentiation. Examin-ing the level of silencExamin-ing in different tissues showed that even the same gene with the same driver was differen-tially susceptible totrans-inactivation in the various tissues. Finally, we were unable to find a consistent correlation between ability to betrans-inactivated and level of wild-type expression. Combined, these results demonstrate the diversity of outcomes of heterochromatin intrans
and the strong influence of developmental expression pattern in determining the sensitivity of a gene to chromatin-mediated gene silencing.
MATERIALS AND METHODS
Fly culture:All experimental crosses were done at 21°. Flies were reared on standard yeast–cornmeal–molasses medium. Starting Drosophila stocks were either obtained from the Bloomington Stock Center or previously generated in our lab (P{hsp-w-hsp26-pt-T}chrwab28) (Csinket al.2002). In this article we refer to the driver lines with abbreviations, and here we indicate the full names: P{GawB}C155, P{GawB}167Y, P{GawB}179Y, and P{GawB}c355 are denoted elav, 167Y, 179Y, and c355, respectively. P{w1mW.hs¼GAL4-arm.S}4a P{w1mW.hs ¼GAL4-arm.S}4b is denoted arm. P{w1mC¼ Act5C-GAL4}25FO1 is denoted act. P{w1mC ¼GAL4-ninaE.GMR} is
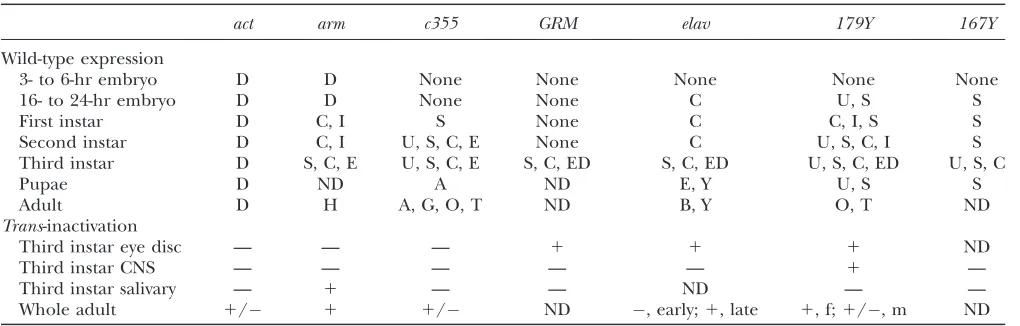
denoted as GMR. The expression pattern of each line is described in Table 1. Lines were selected to show a variety of different expression patterns both quantitatively and qualitatively.
The cross generating flies and larvae in which to measure expression andtrans-inactivation of lines with the driver on the X chromosome (c355,GMR,elav,179Y, and167Y) is shown in Figure 1A. To examine expression and trans-inactivation of TABLE 1
Expression of UAS–GFP at 59E controlled by various driver lines in the absence (wild-type expression) or presence (trans-inactivation) ofbwD
act arm c355 GRM elav 179Y 167Y
Wild-type expression
3- to 6-hr embryo D D None None None None None
16- to 24-hr embryo D D None None C U, S S
First instar D C, I S None C C, I, S S
Second instar D C, I U, S, C, E None C U, S, C, I S
Third instar D S, C, E U, S, C, E S, C, ED S, C, ED U, S, C, ED U, S, C
Pupae D ND A ND E, Y U, S S
Adult D H A, G, O, T ND B, Y O, T ND
Trans-inactivation
Third instar eye disc — — — 1 1 1 ND
Third instar CNS — — — — — 1 —
Third instar salivary — 1 — — ND — —
UAS–GFP driven byact, we first recombinedP{A5CGAL}onto the P{UAS–EGFP}chrwbsf36 chromosome and then we
per-formed the cross shown in Figure 1B. The cross used to examine expression andtrans-inactivation of UAS–GFP driven byarmcame from the cross shown in Figure 1C.
P-element replacement: The cross performed to replace P{hsp-w-hsp26-pt-T}chrwwithP{UAS-EGFP}was similar to those described by Csink et al. (2002). For the replacement we screened for loss ofhsp-w(red eye color) and mobilization of wmc1
(orange eye color) from the X chromosome to an autosome. Of 1892 chromosomes screened, 30 (1.59%) contained an excision ofP{hsp-w-hsp26-pt-T}and transposition of P{UAS–EGFP} to an autosome. Of these, 15 (0.79%) contained a wmc1
gene that segregated with the second chromosome. One of these was a precise replacement into thechrwlocus, as determined by PCR using primers specific for
P{hsp-w-hsp26-pt-T},P{UAS-EGFP}, and the flanking genomic sequence. The mini-white gene in P{UAS-EGFP} is almost completely silenced when over thebwDchromosome.
Microscopic examination and measurement of GFP expression:Eye imaginal discs, salivary glands, and the central nervous system were examined for GFP expression andtrans -inactivation. Wandering third-instar male larvae were used and 3–13 tissues of each genotype were examined. Tissues were from at least three different larvae. Occasionally one of a pair of discs or glands was unusable due to damage during dissection; hence odd numbers of these tissues were some-times used (Table 2). Two bwD and two bw1
larvae were dissected in tandem in PBS for 5 min. Tissues were placed in fix mix (made immediately before use: 100 ml 37% para-formaldehyde, 900ml PBS, 1ml of 1 mg/ml DAPI) for 10 min. Tissues were further dissected during this 10 min, rinsed once Figure1.—Crosses to obtain both larvae and adult flies to test fortrans silencing of P{UAS–EGFP}chrwbsf36
with PBS, and then placed in permeabilization mix (made immediately before use: 665ml PBS, 2ml Triton-X, 0.67ml of 1 mg/ml DAPI) for 3 min. Tissues were rinsed twice with PBS. Tissues were attached to a polylysine-coated printed-well slide in a drop of PBS. All tissues from the four larvae were placed on the same slide, withbwDandbw1tissues juxtaposed, and covered by a 18318-mm coverslip. Tissues were examined immediately after the slide was made. Images were taken using a 43objective so that multiple tissues could be visualized in one image. Microscopy used a Deltavision system (Applied Precision) built around an Olympus IX70 microscope. The images were gathered with a cooled CCD camera (Micromax 350; Photometrics, Tucson, AZ). Quantification utilized Soft-Worx software (Applied Precision) and was performed by measuring the total GFP fluorescence in the tissue and standardized by dividing by total DAPI staining in the tissue. This was performed forbwDandbw1
tissues from each of the lines, as well as a negative control for each cross (see Figure 1) lackingUAS–EFGP. Background fluorescence was removed by subtracting the lowest value obtained from the negative control line from each of the driver lines. These corrected values were averaged and are shown with their 95% confidence intervals in Figures 3–5. All statistical analysis and graphing were done using the Statview program (Abacus Concepts, Berkeley, CA). In all statistical analysis significance was tested by a two-tailed, unpaired Student’st-test.P-values,0.05 are marked as significant in Table 2.
Fluorometric measurement of GFP expression in adults: Flies were aged for 0–24 hr, 3–5 days, 8–12 days, 18–22 days, or 30–35 days (denoted day 1, 5, 12, 22, or 35 in Figure 6 and Table 3) before freezing at80°. For each assay, 200ml GFP assay buffer½50 mmNaH2PO4, 10 mmTris-HCl (pH 8.0), 200 mm NaCl, pH 8.0were added to a 1.5-ml microfuge tube containing five frozen adult flies. The sample was manually
homogenized and an additional 100ml GFP assay buffer was added while rinsing the pestle. After homogenization, the sample was centrifuged for 10 sec in a microcentrifuge and the supernatant immediately measured for GFP fluorescence. Measurements were taken of the sample in a capillary tube. The assay was performed with six different samples (of five flies each) for each genotype and sex. Measurements were made using a Photon Technology International (Santa Clara, CA) QuantaMaster spectrofluorometer with the following settings: excitation 480, emission 513, excitation and emission monochromator slits of 2.5 mm, 2-sec readings were taken over 6 sec, and the average value was used as one reading. For each driver, fluorescence was measured from the four differ-ent genotypes as shown in Figure 1. The average value from the siblings without the GFP reporter was subtracted from each individual sample of the animals that carried the reporter to correct for background fluorescence. These corrected values were averaged and are shown with their 95% confidence intervals in Figure 6. All statistical analysis and graphing was done using the Statview program (Abacus Concepts). In all statistical analysis significance was tested by a two-tailed, un-paired Student’st-test.P-values,0.05 are marked as signifi-cant in Table 3.
TABLE 2
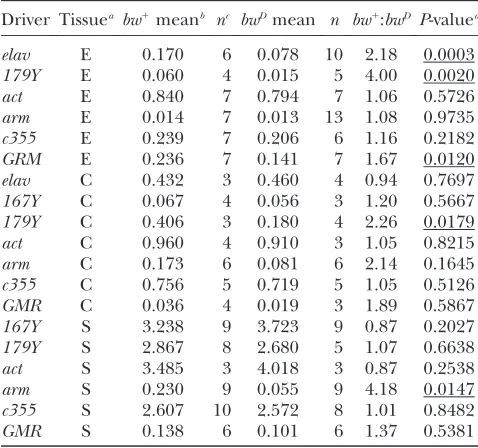
Trans-inactivation of UAS–GFP bybwDin larval tissue
Driver Tissuea bw1meanb nc bwDmean n bw1:
bwD P-valued
elav E 0.170 6 0.078 10 2.18 0.0003 179Y E 0.060 4 0.015 5 4.00 0.0020 act E 0.840 7 0.794 7 1.06 0.5726 arm E 0.014 7 0.013 13 1.08 0.9735 c355 E 0.239 7 0.206 6 1.16 0.2182 GRM E 0.236 7 0.141 7 1.67 0.0120 elav C 0.432 3 0.460 4 0.94 0.7697 167Y C 0.067 4 0.056 3 1.20 0.5667 179Y C 0.406 3 0.180 4 2.26 0.0179 act C 0.960 4 0.910 3 1.05 0.8215 arm C 0.173 6 0.081 6 2.14 0.1645 c355 C 0.756 5 0.719 5 1.05 0.5126 GMR C 0.036 4 0.019 3 1.89 0.5867 167Y S 3.238 9 3.723 9 0.87 0.2027 179Y S 2.867 8 2.680 5 1.07 0.6638 act S 3.485 3 4.018 3 0.87 0.2538 arm S 0.230 9 0.055 9 4.18 0.0147 c355 S 2.607 10 2.572 8 1.01 0.8482 GMR S 0.138 6 0.101 6 1.37 0.5381
a
C, central nervous system; E, eye disc (entire); S, salivary gland.
bMean GFP fluorescence/DAPI fluorescence in each tissue. cThe number of tissues examined.
dUnderlined numbers are,0.05 and are considered
signif-icant.
TABLE 3
Trans-inactivation of UAS–GFP bybwDin whole adults
Driver Day bw1meanb nc bwDmean n bw1:
bwD P-valued
179Y(f)a 1 5,400 6 3,824 6 1.41 0.0416
5 5,360 6 2,301 6 2.33 ,0.0001 12 3,569 6 1,732 6 2.06 0.0460 22 3,461 6 1,232 6 2.81 0.0064 35 2,115 6 984 6 2.15 0.0018 179Y 1 22,984 6 18,339 6 1.25 0.0002 5 10,393 6 7,586 6 1.37 0.1070 12 5,213 6 3,272 6 1.59 0.0002 22 7,252 6 5,802 6 1.25 0.0519 35 7,576 6 4,359 6 1.74 0.0004 Act 1 36,950 6 29,376 6 1.26 0.0057 5 15,469 6 11,438 6 1.35 0.0025 12 9,268 6 6,686 6 1.39 ,0.0001 22 14,648 6 12,196 6 1.20 0.0764 35 14,879 6 8,732 6 1.70 0.0002 arm 1 7,693 6 1,250 6 6.16 ,0.0001 5 6,286 6 699 6 8.99 0.0003 12 5,576 6 382 6 14.61 ,0.0001 22 8,869 6 1,388 6 6.39 ,0.0001 elav 1 5,884 6 4,822 6 1.22 0.1160 5 5,765 6 2,507 6 2.30 0.0106 12 5,732 6 2,625 6 2.18 0.0046 22 6,291 6 3,025 6 2.08 0.0031 35 4,704 6 1,818 5 2.59 ,0.0001 c355 1 8,462 6 7,522 6 1.13 0.1916 5 11,586 6 9,670 6 1.20 0.0563 12 14,903 6 14,901 6 1.00 0.9985 22 20,356 6 16,690 6 1.22 0.1213 35 19,942 6 13,300 6 1.50 ,0.0001
a
All data are from males except the179Y (f), which are from females.
bMean GFP fluorescence.
cThe number of samples (of five flies each).
dUnderlined numbers are,0.05 and are considered
RESULTS
To address the importance of developmental timing of expression in gene silencing we placed a GFP reporter gene containing a variably inducible promoter near the
bwgene. We used a reporter controlled by the yeast UAS sequence so that available collections of GAL4-producing driver lines could be used (Brandand Perrimon1993; Duffy2002). The advantage of this system is that the one reporter in 59E is driven by a number of GAL4-expressing lines in various developmental and tissue-specific patterns and at varying intensities (Figure 2). Tests fortrans-inactivation bybwDare done without chang-ing the location of the reporter construct, yet allow for quantitative and qualitative changes of gene expression. A similar scheme has been used to measure the effect of varying gene expression on silencing by heterochroma-tin incis(Ahmadand Henikoff2001).
To examine trans-inactivation by bwD we needed to generate a fly line that hadP{UAS–EGFP}located very close to the bwD insertion site, but on the wild-type homolog (Figure 2). To accomplish this we performed a
P-element replacement of P{hsp-w-hsp26-pt-T}chrwab28 withP{UAS–EGFP}. The site of this transposon insertion is5 Kbp from where the heterochromatic insertion is found on thebwD
chromosome.P{UAS-EGFP}also con-tains a mini-white reporter gene that gives the eye an orange color. As with other transgenes we have studied containing the mini-white reporter gene in this same location (Csink et al. 2002; Sage et al. 2005), the ex-pression from this reporter is very strongly repressed when heterozygous with abwDchromosome.
We selected seven driver lines to use in this study on the basis of two criteria: pattern of expression as reported in FlyBase and the previous examination of silencing by heterochromatin in cis(Ahmad and Henikoff 2001). To confirm their pattern of expression, we reexamined the expression of these drivers lines throughout de-velopment using ourP{UAS–GFP}59Ereporter hetero-zygous to a wild-type chromosome. The embryos, larvae, pupae, adults, and some dissected tissues were
exam-ined under a fluorescent dissecting scope and/or a standard compound fluorescent microscope. Our find-ings are summarized in Table 1 and generally confirmed the previous descriptions of these various driver lines in FlyBase (Crosbyet al.2007).
Lines were initially selected to test a number of specific hypotheses concerning trans-inactivation. For instance, lines c355 and 167Y were chosen to test the possibility that lack of expression in the embryo pro-moted silencing.armandactwere used to test both the importance of very early transcription and the strength of the expression. LinesGMR,elav, and179Ywere used to test for the role of differentiation in trans -inactivation.
Trans-inactivation in differentiated and
undifferenti-ated cells of the eye imaginal disc: The eye imaginal
discs of third-instar larvae are bisected by the morpho-genetic furrow with cells posterior to the furrow un-dergoing differentiation and cells anterior being undifferentiated. Previous results from our lab have shown that there are profound changes in both nuclear organization and chromatin dynamics that accompany this differentiation event in the eye imaginal disc (Thakar and Csink 2005; Thakar et al. 2006). To determine if these changes were correlated with changes in specific aspects of gene expression, we examined the eye discs of wandering third-instar larvae for trans -inactivation of UAS–GFP. Our selection of driver lines allowed us to compare trans-inactivation in differenti-ated and undifferentidifferenti-ated cells. Three of the lines (act,
arm, and c355) expressed throughout the disc, while three others (elav,179Y, andGMR) expressed GFP only in the differentiated cells posterior to the morphoge-netic furrow. Thetrans-inactivation of the lines expressing in the eye discs is shown in Figure 3A and quantification is shown in Figure 3B and Table 2.
The lines that showtrans-inactivation are only those where expression is not activated until after differenti-ation. In none of the lines with GAL4-driven GFP ex-pression in undifferentiated cells do we see silencing bybwD
heterochromatin in trans, including the weakly expressingarmand moderately expressingc355drivers. While this resistance to silencing appears uninfluenced by the strength of expression of the transgene in the undifferentiated cells, careful examination of the later-expressing lines (three rightmost bar graph sets in Figure 3B) reveals that the level of silencing (decrease in the bwDbars in Figure 3B) is slightly weaker in the more strongly expressed lines. It should also be noted that expression during embryogenesis does not seem to be necessary to confer resistance to silencing. Linec355
does not show expression in eye discs until the second instar, but is still nottrans-inactivated.
Tissue-specific differences in trans-inactivation: In
our study, the amount and timing of GAL4 expression in some of the driver lines are different in different tissues. To determine if silencing would vary depending on the
Figure2.—Scheme to use the GAL4–UAS binary system to test for the differential silencing of the GFP reporter bybwD
heterochromatin under various expression regimes. This dia-gram shows theP element with the GAL4 driver on the X chromosome and the reporter transgene at 59E. Euchromatic chromosome arms are indicated by open boxes, heterochro-matin (including the heterochromatic block inbwDat the
tissue examined we examinedtrans-inactivation in two additional third-instar larval tissues: the central nervous system (CNS) (Figure 4) and the salivary glands (Figure 5). The only line to display significanttrans-inactivation in the CNS was line179Y. The only line to displaytrans -inactivation in the salivary glands was linearm. Therefore, a single driver is differentially susceptible to trans -inactivation in different tissues (Table 2). For instance,
armis silenced in salivary glands, but not in the eye disc. Theelavexpression is silenced in differentiated eye disc cells, but not in the CNS. This tissue specificity may result from differences in the state of the nucleus as we are comparing diploid, polytene, and differentiated cells and is further discussed below.
Silencing in adults:We examined whole adult flies for
trans-inactivation of UAS–GFP activated by five of the driver lines. Adult flies contain more differentiated tissue than larvae, so one may expect a bit moretrans -inactivation. Additionally, we were interested in finding out if the level of silencing changed in a general di-rection as the adults aged. Therefore, we examined flies at five different times after eclosion. Figure 6 shows the levels of expression in thebw1
male flies in the top graph and the level oftrans-inactivation in the bottom graph.
In general, there is a modest level of silencing in all lines at least at some age. This silencing seems mostly unaf-fected by the age of the adult and there is no obvious correlation between overall expression and silencing. However, there does seem to be a bit less silencing in the newly emerged flies (1 day, 0–24 hr after eclosion) using the179Y(females),elav, andarmdrivers and in no lines is the strongest trans-inactivation seen in this earliest sample (Table 3).
Strongtrans-inactivation is seen for GFP driven by the
elavpromoter in all but the youngest adults. The elav
regulatory region would drive GAL4 expression mostly in differentiating or differentiated neurons, not in their neuroblast precursors (Robinowand White1991). Addi-tionally, very strong silencing is found for the ubiqui-tous, but weakly expressedarmdriver. Silencing is not seen forelavin the larval CNS and is seen only forarmin the larval salivary gland. These two lines highlight the fact that we often see different levels oftrans-inactivation in different tissues and stages of development.
Fluorescence was measured separately in adult males and females. With one exception the trend was the same in both sexes (data not shown). The one line that had a difference was179Y, where there was substantial
silenc-Figure3.—(A) GFP expression andtrans -inac-tivation in the third-larval-instar eye disc. Green is GFP, blue is DAPI staining. The gains have been adjusted in these photographs in the more weakly expressing lines so that the GFP expression is readily visible in the composite. (B) Bar graph of data comparing expression of UAS–GFP con-trolled by various driver lines and in the presence or the absence ofbwDin the third-larval-instar eye
ing in females, but less in males (Figure 6 and Table 3). This line drives expression in the ovary and the testis (Table 1), so it is probable that this difference arises from a different degree of silencing in the gonads. Alternatively it could be due to the large number of eggs within the female, which have a different developmental state from the rest of the adult fly.
DISCUSSION
Previous studies have examined the influence of terminal differentiation and developmental expression on silencing by heterochromatin incis. The work of Lu
et al. (1996) and Weiler and Wakimoto (1998) has shown that silencing occurs early in development and that there is a relaxation of silencing with terminal differentiation. While these studies agree, a more recent study emphasized the importance of the strength of the expression of the target gene in counteracting its si-lencing (Ahmadand Henikoff2001). The researchers demonstrated differences in silencing on the basis of the level of expression of the transgene; when drivers are expressed at similar developmental times a stronger driver is less likely to be silenced than a weaker driver. In this study, when the transgene was turned on earlier in development it was less likely to be silenced than when it was turned on later in development. In contrast to the
results of Luet al.(1996) and Weilerand Wakimoto (1998), the majority of lines examined by Ahmadand Henikoff (2001) did not show complete silencing in predifferentiated cells and a relaxation of silencing concurrent with differentiation. Only when the trans-gene had low levels of expression did they see complete silencing and then relaxation with differentiation. In fact, strong early-acting drivers displayed anti-silencing events spontaneously in postmitotic cells that had begun differentiation and in mitotic cells.
The commonality between these studies is the dem-onstration that the expression pattern of a gene affects its ability to be silenced. While these studies addressed
cis-acting PEV, we wanted to address the role of ex-pression pattern in trans-inactivation. Previous results from our lab have demonstrated that different trans-genes have different abilities to be trans-inactivated. Additionally, we have shown that enhancer trap trans-genes located near the brown locus are unable to be
trans-inactivated. This implies that the expression pat-tern of the enhancers near thebrownlocus renders them resistant to trans-inactivation (Csink et al. 2002; Sage
et al.2005).
In this study, we determined that transgenes not expressed until differentiation are more likely to betrans -inactivated than those expressed earlier. This result con-curs with thecis-acting PEV results. In the study of Ahmad and Henikoff(2001), when the transgene was turned on
Figure4.—(A)Trans-inactivation in the third-instar larval CNS of GFP expression driven by the 179Y-GAL4 driver line. Green is GFP, blue is DAPI staining. (B) Bar graph of data comparing ex-pression of UAS–GFP controlled by various driver lines and in the presence or the absence ofbwDin
the larval CNS. Error bars show the 95% confi-dence interval. The asterisk indicates a significant difference in GFP fluorescence betweenbwDand bw1
samples (P, 0.05 based on a Student’st -test). Thenof each sample and the exactP-values for these data are in Table 2. Below each driver name is a summary of the wild-type expression of that driver in earlier developmental stages.
earlier in development it was less likely to be silenced than when it was turned on later in development. As we see a similar trend incisandtranssilencing, this may be a fundamental feature of silencing and not particular tocis
ortrans mechanisms. Additionally, we determined that the level oftrans-inactivation varies depending on the stage of development in which it is examined (Table 1). This result further supports the hypothesis that when a gene is expressed in development affects the ability of this gene to be silenced.
We examined the overall amount oftrans-inactivation in adults to determine if there was a general relaxation
of silencing with differentiation. Such relaxation would predict that lines whose expression was inhibited bybwD in an earlier developmental stage (larvae or undiffer-entiated cells in the eye disc) would become active later in development (adult or differentiated cells in the eye disc). Indeed, it would predict little silencing in adult tissue, as the bulk of the adult is terminally differenti-ated. This is not what we find. Indeed, we find the exact opposite in the eye imaginal discs, with silencing seen only in differentiated tissue and no silencing in un-differentiated tissue. We also find that the179Y-driven expression is silenced in eye imaginal discs and CNS in larvae and is still mostlytrans-inactivated in older adults. Additionally, the highest level of silencing in this study is seen for the GFP expression driven by arm in adults, even though it is not seen at all in some larval tissues. We also find that GFP expression driven by theelav,arm, and
179Y(females) regulatory regions (Figure 6) shows an overall increase in silencing in the older flies compared to the day-1 flies. This may indicate that heterochroma-tin formation is stable during aging and that the ability of genes to escape from silencing decreases as an organ-ism matures. Alternatively, it is possible that in newly eclosed adults there is perdurance of GFP from the un-differentiated state that is degraded as the fly ages.
It is not surprising that there are changes in silencing with development, as there are large-scale changes in
heterochromatin during development (Arney and
Fisher 2004). In Drosophila, heterochromatin is first visible (Mahowaldand Hardy 1985; Vlassovaet al. 1991), and heterochromatin protein 1 (HP1) first begins to be concentrated in heterochromatin ( James
et al. 1989), in syncytial blastoderm. Heterochromatin stays in a condensed state and replicates late in the cell cycle, beginning with the 14th cell cycle (Foeet al.1993; Hiraokaet al.1993). Additionally, recent results from our group have found thatbwD
associations are stabilized and promoted during differentiation. This is correlated with a general decrease in the movement of euchro-matic loci within the nuclei of the differentiated cells of the eye imaginal disc (Thakaret al.2006).
The experiments we present in this article find very different levels oftrans-inactivation in different tissues (Table 1). Among other things, this could be due to the different organization of the nucleus in these different tissues. The CNS, eye discs, and salivary glands were examined in a third-instar larva, which allowed us to examinetrans-inactivation in diploid tissue, tissue pre-and postdifferentiation, pre-and polytene tissues, respec-tively. The differences seen pre- and postdifferentiation relate to time of developmental expression and are dis-cussed above. An unanticipated result was to findtrans -inactivation in salivary glands. This was unexpected as salivary glands contain polytene chromosomes, which mostly lack the heterochromatic association between
bwD
and pericentric heterochromatin that promotes
bwD
trans-inactivation (Talbertet al.1994; Csink and
Figure5.—(A)Trans-inactivation in the third-instar larval salivary gland of GFP expression driven by thearmdriver line. Green is GFP, blue is DAPI staining. (B) Bar graph of data comparing expression of UAS–GFP controlled by various driver lines and in the presence or the absence of bwD in
the larval salivary gland. Error bars show the 95% confidence interval. The asterisk indicates a significant difference in GFP fluorescence betweenbwDandbw1samples (
Henikoff1996). In this special circumstance, however, inactivation by bwD
may not require heterochromatic association for the transgene to be located near a large concentration of heterochromatin. Silencing could be due to the juxtaposition of the transgene and hetero-chromatin found in thebwD
allele. In polytene tissues the DNA strands are copied thousands of times; how-ever, the pericentric heterochromatin does not have a correspondingly high copy number. Interestingly, bwD heterochromatin does appear to have this high copy number. In these polytene tissuesbwDrepresents a large fraction of heterochromatin and strongly concentrates HP1 (Plateroet al.1998). This results in a large con-centration of heterochromatic proteins, which could silence the euchromatic transgene located nearby. In this special circumstance,bwD
may be acting as a hetero-chromatic compartment to silence the transgene. There-fore, although the transgene is intransto thebwD
allele, in this circumstance heterochromatic association may
not be required and may be more similar tocis-PEV. Cor-respondingly, the only driver silenced in the polytene tissues was a very weak driver line,arm.
In contrast to the results oncissilencing (Ahmadand Henikoff 2001), we were unable to find a consistent correlation between ability to be trans-inactivated and level of expression. On the one hand, there are certain aspects of our study that fit this trend. For instance, in the three lines where GPF is driven and silenced only in the differentiated cells of the eye disc (GMR,elav, and
179Y) we find that the degree of silencing is inversely related to the level of wild-type expression. Additionally,
arm, the most strongly silenced line in the adult is also one of the normally weakly expressing lines. However, there are clear data in this study that are inconsistent with the level of expression being of primary importance to susceptibility totrans-inactivation. Neitherarm-driven expression in eye discs, nor 167Y-driven expression in CNS, nor GMRexpression in the salivary glands is
si-Figure 6.—Trans-inactivation in whole adult flies of GFP expression driven by the five different GAL4 driver lines at five different time points after eclosion. (A) Box plots showing the total expression in flies containing the various GAL4 driver lines and the UAS–GFP reporter at 59E over a wild-type chromosome (top) or a bwD chromosome
(bot-tom). Except for 179Y all data are from males. Error bars show the 95% confidence interval. (B) Box plots showing the ratio of GFP fluo-rescence ofbw1flies divided by that frombwDflies. The dotted line
high-lights the ratio of one, which indi-cates no trans-inactivation. Each bw1
, bwD pair was tested for
lenced, despite their very weak expression in those tis-sues. Second,179Yis nicely silenced in the CNS despite having more expression than167Yand a similar level to
elav, neither of which aretrans-inactivated. We believe that our data do not support a primary role for level of expression in susceptibility totrans-inactivation. How-ever, it is possible that level of expression plays a role in silencing once the locus comes close to the heterochro-matic compartment and this could account for the inconsistencies. That is, if the locus is unassociated with centric heterochromatin and being expressed, the level of expression is irrelevant because silencing cannot occur when the UAS–GFP is not close enough to the heterochromatic compartment. However, once it re-sides in this compartment the level of silencing may be subject to similar influences that modifycis heterochro-matic silencing, such as the overall concentration of the GAL4 transcription factor (Ahmadand Henikoff2001). The above results indicate that there may be funda-mental differences between cis and trans silencing. Other results that may also be due to such differences involve the behavior of two lines used both in this study and in the work by Ahmadand Henikoff(2001). Those authors found variegated silencing incisofarm-andact -driven expression both before and after the morphoge-netic furrow, while we find no silencing bybwDin those same two lines in the eye disc either before or after the morphogenetic furrow. These contrasting results may be due to differences in how silencing is brought about and maintained in the different types of PEV (Figure 7). In the circumstance ofcissilencing the silenced gene is always located near heterochromatin, while in trans
-inactivation the heterochromatic association required should change during development. Close association of the gene inciswith a large block of heterochromatin early in development would allow the effect of hetero-chromatic proteins to modify the early organization of the regulatory region and may limit the influence of early-acting transcription factors.
Our data indicate that early transcription interferes with trans-inactivation, although it should be pointed out that it is not certain if this interference is stable or if a gene that is associated with the centric heterochro-matin will eventually be silenced. Such a possibility is seen for UAS–GFP expression driven by thearmdriver. This expression is not silenced in some of the larval tissue examined, but is very strongly silenced in the adult. One way to interpret this is that while early-expressed genes are initially resistant to silencing, they can eventually be silenced. We do not believe that early transcription prevents or disrupts association of a locus with the heterochromatic compartment. Earlier studies of ours examined the results of upregulating a trans -inactivated heat-shock promoter and found no tran-sient or permanent change in the large-scale nuclear location of the region containing the upregulated gene. However, it should be pointed out that the study did not have the resolution to detect a subtle disengagement of the locus from the surface of the heterochromatic compartment (Csink et al. 2002). We speculate that when expression is activated before heterochromatic association, the formation of active transcription com-plexes is not influenced by heterochromatin. It appears that subsequent association of the locus with centric
heterochromatin has little immediate consequence for transcription. However, it is possible that silencing occurs after a period of association. The abundance of the appropriate transcription factor may influence the length of this period of resistance. A higher local concentration of transcription factor may allow longer maintenance of expression, or perhaps total resistance, despite close association of the locus with the centric heterochromatin. On the other hand, a gene that attempts to begin transcription later in development, when it finds itself in a heterochromatic environment, may have more difficulty recruiting the necessary factors to initiate transcription. Perhaps such initiation factors are few or absent within the heterochromatic compart-ment. Another possibility is that an untranscribed gene located near the heterochromatic compartment takes on the inhibitory chromatin structure typical of hetero-chromatin, making the initiation and maintenance of transcription difficult. Studies are presently underway investigating these possibilities.
Combined, our results demonstrate that the pattern of expression of a gene affects its ability to be trans -inactivated and emphasize the importance of the in-teraction of nuclear organization, chromatin structure, and temporal and quantitative variation in transcription factor abundance in determining the final expression state of a locus.
We thank the Bloomington Stock Center for fly lines, Lauren Ernst for instructing us on use of the fluorometer, and Wei Tang for technical assistance. This work was supported by an American Cancer Society grant (RSG-00-073-04-DDC) to Amy Csink.
LITERATURE CITED
Ahmad, K., and S. Henikoff, 2001 Modulation of a transcription
factor counteracts heterochromatic gene silencing inDrosophila.
Cell104:839–847.
Arney, K. L., and A. G. Fisher, 2004 Epigenetic aspects of
differen-tiation. J. Cell Sci.117:4355–4363.
Brand, A. H., and N. Perrimon, 1993 Targeted gene expression as a
means of altering cell fates and generating dominant pheno-types. Development118:401–415.
Crosby, M. A., J. L. Goodman, V. B. Strelets, P. Zhangand W. M.
Gelbart, 2007 FlyBase: genomes by the dozen. Nucleic Acids
Res.35:D486–D491.
Csink, A. K., and S. Henikoff, 1996 Genetic modification of
hetero-chromatic association and nuclear organization in Drosophila.
Nature381:529–531.
Csink, A. K., A. Bounoutas, M. L. Griffith, J. F. Sabland B. T. Sage,
2002 Differential gene silencing bytrans-heterochromatin in
Drosophila melanogaster.Genetics160:257–269.
Duffy, J., 2002 GAL4 system inDrosophila: a fly geneticist’s Swiss
army knife. Genesis34:1–15.
Foe, V. E., G. M. Odelland B. A. Edgar, 1993 Mitosis and
morphogen-esis in theDrosophilaembryo: point and counterpoint, pp. 149– 300 inThe Development of Drosophila melanogaster, edited by M. Bate
and A. M. Arian. Cold Spring Harbor Laboratory Press, Plainview,
NY.
Harmon, B., and J. Sedat, 2005 Cell-by-cell dissection of gene
ex-pression and chromosomal interactions reveals consequences of nuclear reorganization. PLoS Biol.3:e67.
Hiraoka, Y., A. F. Dernburg, S. J. Parmelee, M. C. Rykowski, D. A.
Agardet al., 1993 The onset of homologous chromosome
pair-ing durpair-ing Drosophila melanogaster embryogenesis. J. Cell Biol.
120:591–600.
James, T. C., J. C. Eissenberg, C. Craig, V. Dietrich, A. Hobson
et al., 1989 Distribution patterns of HP1, a heterochromatin-associated nonhistone chromosomal protein ofDrosophila.Eur. J. Cell Biol.50:170–180.
Lu, B. Y., C. P. Bishopand J. C. Eissenberg, 1996 Developmental
timing and tissue specificity of heterochromatin-mediated silenc-ing. EMBO J.15:1323–1332.
Mahowald, A. P., and P. A. Hardy, 1985 Genetics of Drosophila
embryogenesis. Annu. Rev. Genet.19:149–177.
Martin-Morris, L. E., A. K. Csink, D. R. Dorer, P. B. Talbertand
S. Henikoff, 1997 Heterochromatictrans-inactivation of
Dro-sophilawhitetransgenes. Genetics147:671–677.
Platero, J., A. Csink, A. Quintanilla and S. Henikoff,
1998 Changes in chromosomal localization of heterochroma-tin binding proteins during the cell cycle inDrosophila.J. Cell Biol.140:1297–1306.
Robinow, S., and K. White, 1991 Characterization and spatial
dis-tribution of the ELAV protein duringDrosophila melanogaster de-velopment. J. Neurobiol.22:443–461.
Sage, B. T., and A. K. Csink, 2003 Heterochromatic self-association,
a determinant of nuclear organization, does not require se-quence homology in Drosophila. Genetics165:1183–1193. Sage, B. T., J. L. Jones, A. L. Holmes, M. D. Wuand A. K. Csink,
2005 Sequence elements in cis influence heterochromatic si-lencing in trans. Mol. Cell. Biol.25:377–388.
Su, R. C., K. E. Brown, S. Saaber, A. G. Fisher, M. Merkenschlager
et al., 2004 Dynamic assembly of silent chromatin during thy-mocyte maturation. Nat. Genet.36:502–506.
Talbert, P. B., and S. Henikoff, 2006 Spreading of silent
chroma-tin: inaction at a distance. Nat. Rev. Genet.7:793–803. Talbert, P. B., C. D. LeCieland S. Henikoff, 1994 Modification of
the Drosophila heterochromatic mutationbrownDominantby linkage
alterations. Genetics136:559–571.
Thakar, R., and A. K. Csink, 2005 Changing chromatin dynamics
and nuclear organization during differentiation inDrosophila lar-val tissue. J. Cell Sci.118:951–960.
Thakar, R., G. Gordonand A. K. Csink, 2006 Dynamics and
an-choring of heterochromatic loci during development. J. Cell Sci.119:4165–4175.
Vlassova, I. E., S. Graphodatsky, E. S. Belyaevaand I. F. Zhimulev,
1991 Constitutive heterochromatin in early embryogenesis of
Drosophila melanogaster.Mol. Gen. Genet.229:316–318.
Weiler, K. S., and B. T. Wakimoto, 1998 Chromosome
rearrange-ments induce both variegated and reduced, uniform expression of heterochromatic genes in a development-specific manner. Genetics149:1451–1464.