DOI: 10.1534/genetics.105.048439
Comparison of Quantitative Trait Loci for Adaptive Traits Between Oak and
Chestnut Based on an Expressed Sequence Tag Consensus Map
Manuela Casasoli,*
,1Jeremy Derory,*
,1Caroline Morera-Dutrey,* Oliver Brendel,
†Ilga Porth,
‡Jean-Marc Guehl,
†Fiorella Villani
§and Antoine Kremer*
,2*INRA, UMR Biodiversite´ Ge`nes et Ecosyste`mes, 33612 Cestas Cedex, France,†INRA-UHP, UMR Ecologie et Ecophysiologie Forestie`res, Centre de Nancy 54280 Champenoux, France,§CNR, Istituto di Biologia Agroambientale e Forestale, 05010 Porano (TR), Italy
and‡ARC Seibersdorf Research, Biotechnology Unit, A-2444 Seibersdorf, Austria Manuscript received July 18, 2005
Accepted for publication September 21, 2005
ABSTRACT
A comparative genetic and QTL mapping was performed betweenQuercus roburL. andCastanea sativa Mill., two major forest tree species belonging to the Fagaceae family. Oak EST-derived markers (STSs) were used to align the 12 linkage groups of the two species. Fifty-one and 45 STSs were mapped in oak and chestnut, respectively. These STSs, added to SSR markers previously mapped in both species, provided a total number of 55 orthologous molecular markers for comparative mapping within the Fagaceae family. Homeologous genomic regions identified between oak and chestnut allowed us to compare QTL positions for three important adaptive traits. Colocation of the QTL controlling the timing of bud burst was significant between the two species. However, conservation of QTL for height growth was not supported by statistical tests. No QTL for carbon isotope discrimination was conserved between the two species. Putative candidate genes for bud burst can be identified on the basis of colocations between EST-derived markers and QTL.
T
HE genetic basis and evolution of adaptive traits that evolve in response to selection are still largely un-known. Because of the prominent neo-Darwinian view that pointed out the major role of mutations with small effects (infinitesimal model) (Fisher1930), the study of the genetic basis of adaptation has received little atten-tion until recently (Orrand Coyne1992). At the same time, Bartonand Turelli(1989) reviewed theories and experimental results on evolutionary quantitative genet-ics. Most of the quantitative traits can evolve in response to selection because the additive variance represents a significant part of their phenotypic variance. Neverthe-less, the number of loci involved, the magnitude of their effects, the type of gene action (additivity, dominance, epistasis, and pleiotropy), and the existence of genotype-by-environment interaction effect remain unknown for many traits of adaptive significance. In particular, the number of their underlying loci and the magnitude of the allelic effects are key factors of the evolution of adaptive traits. Orr and Coyne (1992) showed that Fisher’s model was incomplete and that mutations with large effects were sometimes involved in adaptation. Indeed, on the basis of Orr’s (1998) recent theoretical work, adaptation seems to involve many loci of small and moderate effect but also a few loci of large effect, givingrise to anL-shaped distribution of factors fixed during adaptive evolution. Moreover, from an evolutionary point of view, in a complex organism, adaptation would occur mainly with mutations of intermediate effects that permit it to achieve an appropriate tradeoff between an acceptable probability of fixation and an acceptable probability to be favorable (Orr2000).
Quantitative trait locus (QTL) studies were expected to provide new insights into fundamental questions regarding the genetic basis of quantitative traits and adaptation (Mitchell-Olds1995). Despite some biases in QTL analysis, such as the underestimation of the number of loci involved and the overestimation of their effects, important clues on quantitative genetic variation were obtained in animal and plant QTL studies. An L-shaped distribution of QTL effects was often observed and cloning of some QTL clearly showed that individual genes with large effects could be responsible for a pro-portion of quantitative variation, according to Orr’s model. At the same time, several interacting polymor-phisms in coding and noncoding regions of a single gene, as well as epistatic interactions among alleles at dif-ferent loci, seemed to be of great importance in deter-mining quantitative variation. Moreover, mutation and balancing selection were shown to play a major role in the maintenance of quantitative trait variation (Barton and Keightley2002). Especially in the case of adapta-tion, QTL studies have been applied to elucidate some of the basic questions: number, effect, and stability of loci involved (Wu1998; Hurme et al. 2000; Jermstad
1These authors contributed equally to this work.
2Corresponding author:INRA, UMR BIOGECO Equipe de Ge´ne´tique, 69 Rte. d’Arcachon, 33612 Cestas Cedex, France.
E-mail: [email protected]
et al. 2003; Verhoevenet al. 2004). Furthermore, com-parative QTL mapping for adaptive traits among popula-tions and species can lead to the identification of genomic regions conserved over a long evolutionary period and therefore potentially harboring genes of great impor-tance for the adaptive process. At the same time, non-conserved QTL could be responsible for local adaptation or interspecific differentiation.
We compared the genetic architecture of several im-portant adaptive traits in two widely distributed forest tree species in Europe (oaks and chestnut). A long-term project aimed at identifying genomic regions and genes responsible for different adaptive traits in forest trees has been initiated in European white oaks (Quercus robur L. andQ. petraeaL.) and European chestnut (Castanea
sativaMill.). Both Quercus and Castanea genera belong
to the Fagaceae family and are phylogenetically closely related, and the two genera diverged60 million years ago (Manosand Steele1997; Manoset al. 2001). Both genera are of great ecological and economical impor-tance in Europe and offer an interesting example of nat-ural (both Quercus and Castanea), cultivated (Castanea), and naturally hybridizing species (Q. roburandQ. petraea). QTL for three important adaptive traits,i.e., the timing of bud burst, carbon isotope discrimination, and height growth, were detected inQ. roburandC. sativa(Casasoli
et al. 2004; Scotti-Saintagneet al. 2004; O. Brendel,
unpublished results) and their location on the genetic map is compared in this article.
To compare QTL positions between Quercus and Castanea, linkage groups were aligned to identify ortho-logous genomic regions. In previous work, seven linkage groups were aligned between these two species using orthologous microsatellite markers and two others were tentatively matched on the basis of a single common marker (Barrenecheet al. 2004). Recent availability of expressed sequence tag (EST) sequence information in oak species (Porthet al. 2005a,b; J. Derory, P. Leger, V. Garcia, J. Schaeffer, M. T. Hauser, F. Salin, C. Luschnig, C. Plomion, J. Glo¨ ssl and A. Kremer, unpublished results) gave us the opportunity to exploit this resource for comparative mapping. Indeed, EST-derived markers are ideal anchor points for this pur-pose. They are coding sequences and, consequently, usually easily transferable between species. A high number of ESTs are often available and they can represent expressional and/or functional candidate genes. Moreover, ESTs from J. Derory, P. Leger, V. Garcia, J. Schaeffer, M. T. Hauser, F. Salin, C. Luschnig, C. Plomion, J. Glo¨ ssl and A. Kremer (unpublished results) were developed within the frame-work of a transcriptomic analysis of bud burst in Q.
petraea. Therefore, colocations between these ESTs and
QTL controlling timing of bud burst could provide putative candidate genes for this trait. The long-term objective of this project is to provide molecular tools for monitoring adaptive variation in natural populations of
forest trees as a starting point to understand the genetic mechanisms of adaptive differentiation within and between populations and species.
The aims of this work were to: (1) align the 12 linkage groups ofQ. roburandC. sativagenetic maps using EST-derived markers in addition to the previous existing orthologous markers and (2) compare the number, ef-fect, and position of QTL controlling three different adaptive traits between the two species. Finally we in-tended to use the comparison of QTL mapping in the two genera to identify positional candidate genes for the phenotypic traits analyzed.
MATERIALS AND METHODS
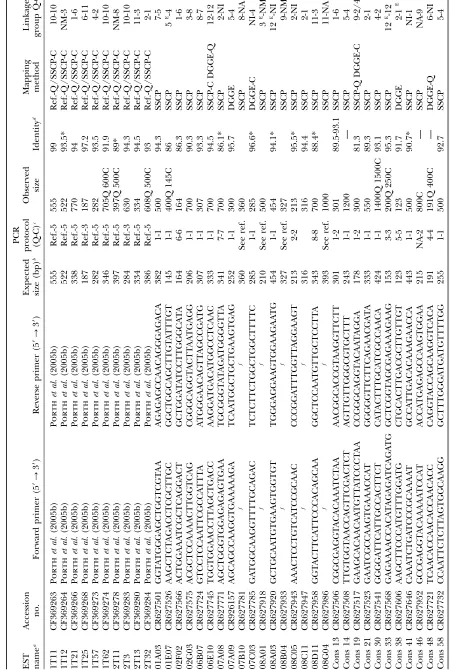
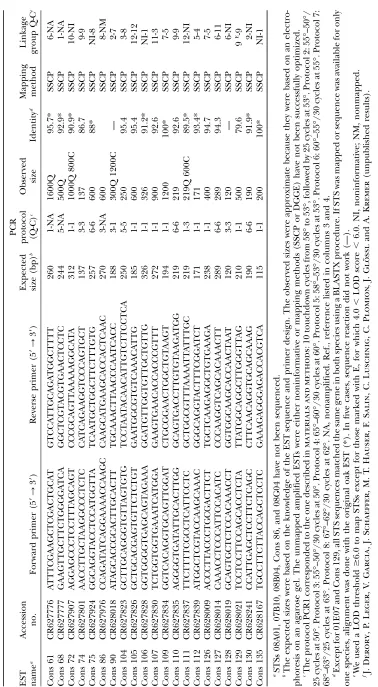
EST resources:A total of 92 ESTs, developed in oak either by Porthet al. (2005a) or by J. Derory, P. Leger, V. Garcia, J. Schaeffer, M. T. Hauser, F. Salin, C. Luschnig, C. Plomion, J. Glo¨ ssland A. Kremer(unpublished results), were used in this work. Ten ESTs from Porthet al., already mapped in oak (Porthet al. 2005b), were amplified and mapped in chestnut. In addition to these already developed sequence-tagged sites (STSs), 82 EST sequences from the database at http://cbi. labri.fr/outils/SAM/COMPLETE/index.php, project ‘‘Quercus petraea bud ESTs’’ ( J. Derory, P. Leger, V. Garcia, J. Schaeffer, M. T. Hauser, F. Salin, C. Luschnig, C. Plomion, J. Glo¨ ssland A. Kremer, unpublished results), were used to develop molecular markers for mapping both in oak and in chestnut.
Amplification of EST-derived markers (STSs): ESTs from Porthet al. (2005a,b) were amplified in chestnut using primer sequences developed by these authors. About 100 EST se-quences from Deroryet al.(2005), corresponding mainly to proteins with known functions, were used to recover homol-ogous sequences by using the BLAST procedure (http:// www.ncbi.nlm.nih.gov/blast/) (Altschulet al. 1990). These homologous sequences were aligned with the corresponding oak EST (CLUSTALW, http://www.ebi.ac.uk/clustalw/) to identify the most conserved regions. Primers were designed using the Primer3 software (http://www-genome.wi.mit.edu/ cgi-bin/primer/primer3_www.cgi), following three main cri-teria: (1) primer sequences were selected in a conserved region of the DNA fragment; (2) the expected size of the amplified fragment was fixed between 100 and 450 bp; and (3) the melting temperature was fixed between 55° and 60°. Following these criteria, 82 primer pairs were designed. Both amplified and mapped ESTs, primer sequences, and expected fragment sizes are reported in Table 1. For five of these ESTs (07B10, 08A01, 08B04, 08C11, and 08G04) primers pairs had been already designed in oak by J. Derory, P. Leger, V. Garcia, J. Schaeffer, M. T. Hauser, F. Salin, C. Luschnig, C. Plomion, J. Glo¨ ssland A. Kremer(unpublished results) and used in this work. Molecular markers derived from amplifica-tion of genomic DNA using primers designed on an EST are referred to from now on as STSs.
finally 25 or 30 cycles of 45 sec at 94°, 45 sec at the annealing temperature, 1 min at 72°, and a final extension of 10 min at 72°. PCR conditions were optimized to obtain a single amplified band. Annealing temperature and number of cycles for each STS are reported in Table 1. Quality and size of the amplified products were checked on a 1.5% agarose gel.
STS polymorphism detection, mapping, and sequencing:
The 10 ESTs developed by Porthet al.(2005a,b), had been previously mapped in oak using SNP genotyping techniques (Syva¨ nen 2001). Denaturing gradient gel electrophoresis (DGGE) (Myerset al. 1987) and single-strand conformation polymorphism (SSCP) (Oritaet al. 1989) methods were used to detect polymorphisms in the STS markers developed in this study. Experimental procedures were performed according to Temesgenet al. (2001) and Plomionet al. (1999) for DGGE and SSCP, respectively. The parents of the oak and chestnut mapping populations and six F1individuals of each progeny
were first screened using the SSCP technique. If an informa-tive polymorphism was detected, then this technique was used to map the STS; otherwise DGGE was tested to reveal poly-morphism. If no informative polymorphism was detected using DGGE, then the STS marker has not been mapped.
Mapping populations and data corresponded to those used in the originalQ. robur(Barrenecheet al. 1998) andC. sativa (Casasoliet al. 2001) genetic linkage maps. A subsample of 57 individuals was genotyped with informative STS markers. MapMaker V.2 (Lander et al. 1987) and JoinMap V.3 (Van Oijenand Voorrips2001) software were used for linkage anal-ysis using a LOD threshold of 6.0 as a grouping criterion and the Kosambi(1944) function to estimate genetic distances.
STS markers were sequenced in oak and chestnut. Ampli-fied fragments were directly sequenced using the Amersham (Arlington Heights, IL) DYEnamic ET terminator sequencing kit and revealed with the MegaBACE automated capillary sequencer (Molecular Dynamics, Sunnyvale, CA). Sequences were then aligned with the original EST and between the two species using the ALIGNn software (http://www.infobiogen. fr/services/analyseq/cgi-bin/alignn_in.pl).
Construction of Q. robur and C. sativa consensus linkage maps: Two consensus genetic maps were constructed inQ. roburandC. sativato merge marker and linkage information from different mapping experiments in a single map for each species. Some of the markers that were contained in the two parental QTL framework maps (Casasoliet al. 2004; Scotti -Saintagneet al. 2004), all SSR markers mapped in both species (Barrenecheet al. 2004), and STSs mapped in this study were merged in these new consensus maps. Since the two original oak and chestnut linkage maps (Barreneche et al. 1998; Casasoliet al., 2001) were used to select a subsample of evenly distributed markers for QTL analysis and to map SSR and STS markers, a single consensus genetic map could be constructed for each species from original data. In both species, we used the following strategy to construct the consensus map:
1. The MapMaker software was used to establish a framework map for each parent using the ‘‘ripple’’ option (LOD.2.0) to optimize the marker order. In most of the cases, the optimized marker order corresponded to that obtained in the QTL map. This map was constructed using a higher number of F1individuals; therefore the statistical support
for marker order is also higher.
2. The JoinMap software was then used to join female and male maps by means of 3:1, 1:2:1, and 1:1:1:1 segregating markers. As the information content of 1:1/3:1 and 1:1/1:2:1 marker couples was quite low (Ritteret al. 1990) and marker density was higher than that in the framework map, we used the ‘‘fixed-order’’ option to optimize the marker order in the consensus map. If, after adding 3:1 and 1:2:1 segregating
markers, the marker order in the consensus map corre-sponded to that obtained using MapMaker, then the fixed-order option was not used. On the other hand, if some incongruities occurred, then the order obtained with Map-Maker was fixed prior to adding all the markers.
Merging QTL information on the consensus map and com-parative QTL mapping: The BioMercator software (Arcade et al. 2004) was used for integrating QTL and marker informa-tion in the consensus map of the two species separately. By using a homothetic projection process, this software permitted us to merge marker and QTL information from independent experiments. In our case, the consensus and QTL maps shared several markers. Therefore, QTL position and confidence intervals were projected from the QTL to the consensus map by means of the common loci.
To compare QTL positions betweenQ. roburandC. sativa, common intervals were identified using orthologous markers on the two consensus maps. Orthologous markers used were either SSRs described in a previous article (Barrenecheet al. 2004) or STSs developed within the frame of this study. The orthology of the SSRs was verified by sequencing and aligning their flanking regions (Barrenecheet al.2004). In addition to SSRs and STSs, one isozyme locus and one 5SrDNA locus were also used as orthologous markers. A common interval was defined as the region on a linkage group bearing the same or-thologous markers at its extremities. A common interval was comparable between the two species if it was at least 5 cM long in both species. Below this genetic distance, marker order was unreliable for markers genotyped on 57 individuals. When more than one orthologous marker were mapped at the end of one common interval, then the marker genotyped using a higher number of individuals or being more informative was chosen as the limit of the interval. For instance, the marker EMCs11 genotyped on 96 F1 individuals was chosen in
comparison to EST Cons126 genotyped on 57 F1individuals
on the group C5, or EST 06E10 segregating 1:1 was chosen in comparison to EST Cons105 segregating 1:3, in the linkage groups Q12–C12 (Figure 1). After having identified common intervals between oak and chestnut consensus maps, unique QTL were defined for each species separately. In each species, more QTL for the same trait were often mapped in the same genomic region (for instance, QTL for the same trait detected in the two parental maps or during two different years). These QTL were considered as a unique QTL if its most probable position (i.e., the highest LOD score position given by the com-posite interval mapping and the bootstrap) (Casasoliet al. 2004; Scotti-Saintagneet al. 2004) was included in the same interval identified by orthologous markers. If the most prob-able position of the QTL was located between two different intervals, then the QTL was localized in the interval with other QTL for the same trait or containing the larger length of the confidence interval. This is a practical definition of unique QTL at the intraspecific level to perform comparative QTL mapping between the two species. Finally, unique QTL were con-sidered as conserved between the two species if they mapped in the same common interval. The probability that QTL co-locations between the two species occurred by chance was calculated according to Linet al. (1995) with slight modifica-tions as described in Feltus et al. (2003). In short, the probabilitypthat the QTL colocations between the two species occurred by chance is given by
p¼ 1 m
n1 sm
n s
wherenis the total number of common intervals compared (34 in our case), l is the number of QTL in the species exhibiting the largest number of QTL,sis the number of QTL in the second species, andmis the number of QTL colocalized between the two species.
RESULTS
STS amplification: STS markers from Porth et al. (2005a) were previously amplified in oak; thus they were optimized in chestnut and all succeeded in amplifying (10/10). As far as STS markers from J. Derory, P. Leger, V. Garcia, J. Schaeffer, M. T. Hauser, F. Salin, C. Luschnig, C. Plomion, J. Glo¨ ssl and A. Kremer (unpublished results) are concerned, 73% (60/82) and 70% (57/82) amplified a single and strong band in oak and chestnut, respectively. Only four STSs amplified in oak and one amplified in chestnut did not succeed in amplifying in the other species or exhibited a multiband pattern. Primer pairs resulting in multiband patterns for both species were discarded from further analyses. Only successfully amplified and mapped STSs were reported in Table 1,i.e., overall, 49 sequences. Expected size of the amplified fragments, based on the EST sequence, varied from 115 to 454 bp. A size ranging from 120 to 1600 bp was obtained for these STS markers (Table 1). Eighteen (37%) out of the 49 STSs developed in this work gave a fragment of the expected size in both species, whereas 24 (49%) STS markers gave products longer than pre-dicted and, therefore, it is expected that they contain intronic sequences. Only seven STSs (14%) amplified a fragment of different size in oak and chestnut.
STS polymorphism detection and mapping:For map-ping STS markers developed in this work, SSCP and DGGE techniques were used to detect informative poly-morphisms in oak and chestnut full-sib families. The 10 ESTs from Porthet al.(2005b) were all informative and consequently mapped in chestnut. Among the 61 STSs from J. Derory, P. Leger, V. Garcia, J. Schaeffer, M. T. Hauser, F. Salin, C. Luschnig, C. Plomion, J. Glo¨ ssl and A. Kremer (unpublished results) properly ampli-fied in, at least, one of the two species, 70% (43/61) and 61% (37/61) were informative in oak and chestnut full-sib families, respectively. The SSCP technique revealed most of the polymorphisms and was used mainly to map these markers. In six cases, DGGE revealed polymor-phisms that could not be detected by SSCP. Twenty-one STS markers were not mapped for one of the two species because no polymorphisms were detected or SSCP and/ or DGGE run conditions could not be optimized (Table 1). Fifty-one and 45 STS markers were mapped in oak and chestnut, respectively (Figure 1). Six STS markers were mapped with a LOD threshold fixed between 4.0 and 6.0 (Table 1). Nevertheless, their linkage with more than one marker on the same linkage group supported their map location. In all other cases, LOD.6.0, con-firming that 57 individuals were enough for mapping
new markers on the oak and chestnut linkage maps. The two oak parental framework maps covered 852.6 cM (female) and 876.0 cM (male). The two chestnut parental maps covered 863.4 cM (female) and 866.6 cM (male). These framework maps were used as starting points to construct the two oak and chestnut consensus maps as previously described.
The two consensus maps are available on-line at http:// www.pierroton.inra.fr/biogeco/genetique/recherches/ Oak-map/index.html. Figure 1 shows linkage consensus groups of both species. For clarity reasons, only a sub-sample of markers was represented in Figure 1 to easily identify common genetic intervals between the two species.
Comparative STS mapping: With a total number of 55 orthologous markers mapped in both species (18 SSRs, 1 isozyme, 1 5SrDNA, and 35 STSs), the 12 linkage groups could be aligned. Thirty-seven STS markers could be mapped in bothQ. roburandC. sativa. In most of the cases, the sequence analysis of the amplified frag-ments confirmed that the amplification product corre-sponded to the EST sequence and homology between oak and chestnut was verified (Table 1). In five cases, the low quality of sequences did not permit us to draw any conclusions. These results confirmed the orthology between STS markers mapped in oak and chestnut. Homeologous linkage groups contained from 2 to 7 common anchor markers. Marker order was conserved in most of the cases. Five inversions, corresponding to true local inversions or caused by mapping errors (e.g., Q1/C6 and Q2/C1), were observed between tightly linked markers (Figure 1). Among them, in four cases, markers involved were separated by a distance,5 cM and the STS Cons38 in the group C1 was a marker linked with a LOD value of 5.0; therefore the statistical support for its position was low.
F
igure
1.—
Continued
different size in chestnut (Barrenecheet al. 2004). In the interspecific oak cross, this marker was mapped in a different linkage group than in the intraspecific oak cross (A. Kremer, personal communication). It is there-fore possible that fragments of different size correspond to paralogous loci as already shown in similar cases (Barrenecheet al. 2004).
In two cases (EST Cons19 and EST Cons90, Table 1 and Figure 1), STS markers did not locate in homeo-logous linkage groups between oak and chestnut. Se-quence data confirmed that EST Cons19 corresponded to the gene for the ribosomal protein L13. The marker EST Cons90 was developed from an EST corresponding to a metallothionein-like protein type 3 (MT-3) and two fragments of different size were amplified in the two species. In the two cases, we were dealing with gene families and several independent loci corresponding to different gene family members of these proteins were mapped in plant species (Barakatet al. 2001; Guoet al. 2003).
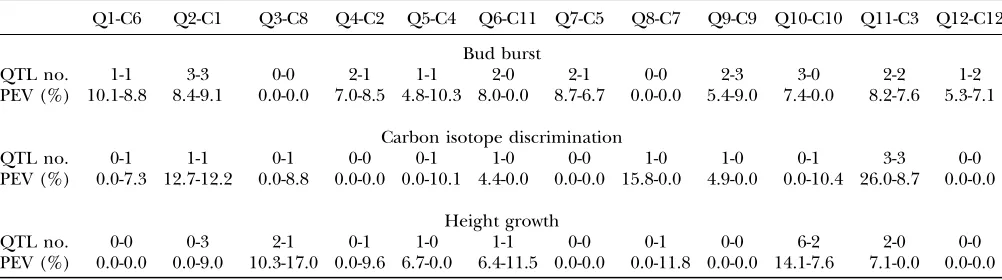
Merging ofQ. roburandC. sativaQTL studies on the consensus map and comparison of QTL position:QTL data were obtained from Casasoliet al. (2004), Scotti -Saintagneet al. (2004), and O. Brendel (unpublished results). QTL results for timing of bud burst, carbon isotope discrimination, and height growth were calcu-lated at the 5% genomewise significance level within each species (Table 2). For each pair of homeologous linkage groups, the total number of QTL detected and the mean phenotypic explained variance (PEV) values were reported for each species. For a given trait in a given species, QTL were detected separately within each experiment (3 different years in Castanea, three differ-ent sites in Quercus). The total number of QTL con-tributing to a trait was then reduced to the number of unique QTL. Unique QTL, as explained inmaterials
and methods, are either QTL expressed in different years but located within the same interval defined by orthologous markers or QTL expressed in only 1 year.
In total, there were 19 and 14 individual QTL for the timing of bud burst in oak and chestnut, respectively. Concerning carbon isotope discrimination, 7 and 8 QTL in oak and chestnut, respectively, were detected over a 3-year period. Finally, height growth was sured in oak only during 1 year using four different mea-surements; thus the number of detected QTL per trait and year can be compared. A mean value of 3 QTL per trait was detected in oak. In chestnut, the mean value per trait and year was 1.5.
For the timing of bud burst, the average PEV values varied from 4.8 to 10.1% in oak and from 6.7 to 10.3% in chestnut. PEV values for carbon isotope discrimination varied from 4.4 to 26.0% and from 7.3 to 12.2% in oak and chestnut, respectively. Finally, concerning height growth, average PEV values varied from 6.4 to 14.1% in oak and from 7.6 to 17.0% in chestnut. PEV values are comparable between two different QTL experiences if the numbers of individuals used for their estimation are similar (Beavis1995). Despite the higher number of F1individuals in the oak progeny in comparison to the chestnut one (278vs.186), the mean values of individ-uals used for QTL mapping were 165 and 147 in oak and chestnut, respectively. Therefore, PEV values were generally comparable. In both species, more QTL with either low or moderate rather than high effect were detected (Casasoliet al. 2004; Scotti-Saintagneet al. 2004; O. Brendel, unpublished results).
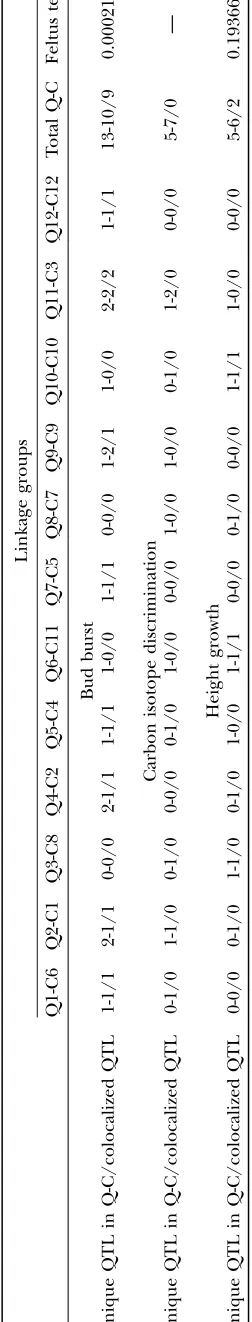
A total number of 34 common intervals were identi-fied between the oak and chestnut genetic linkage maps by means of the orthologous markers. Following the previously described criteria to declare unique QTL, 13 and 10 unique QTL were identified for timing of bud
TABLE 2
Number and mean PEV values of QTL detected inQ. roburandC. sativa, respectively, are reported for each homeologous linkage group pair
Q1-C6 Q2-C1 Q3-C8 Q4-C2 Q5-C4 Q6-C11 Q7-C5 Q8-C7 Q9-C9 Q10-C10 Q11-C3 Q12-C12
Bud burst
QTL no. 1-1 3-3 0-0 2-1 1-1 2-0 2-1 0-0 2-3 3-0 2-2 1-2
PEV (%) 10.1-8.8 8.4-9.1 0.0-0.0 7.0-8.5 4.8-10.3 8.0-0.0 8.7-6.7 0.0-0.0 5.4-9.0 7.4-0.0 8.2-7.6 5.3-7.1
Carbon isotope discrimination
QTL no. 0-1 1-1 0-1 0-0 0-1 1-0 0-0 1-0 1-0 0-1 3-3 0-0
PEV (%) 0.0-7.3 12.7-12.2 0.0-8.8 0.0-0.0 0.0-10.1 4.4-0.0 0.0-0.0 15.8-0.0 4.9-0.0 0.0-10.4 26.0-8.7 0.0-0.0
Height growth
QTL no. 0-0 0-3 2-1 0-1 1-0 1-1 0-0 0-1 0-0 6-2 2-0 0-0
PEV (%) 0.0-0.0 0.0-9.0 10.3-17.0 0.0-9.6 6.7-0.0 6.4-11.5 0.0-0.0 0.0-11.8 0.0-0.0 14.1-7.6 7.1-0.0 0.0-0.0
burst, 5 and 7 unique QTL were identified for carbon isotope discrimination, and, finally, 5 and 6 unique QTL for height growth were identified in chestnut and oak, respectively (Table 3). Among these unique QTL, 9 controlling timing of bud burst and 2 controlling height growth were colocated between the two species (Table 3 and Figure 1). No QTL involved in carbon isotope discrimination was colocated in the oak and chestnut map. Following Lin et al. (1995), the probability to obtain these colocations by chance isP¼0.0002 in the case of timing of bud burst andP¼0.1937 in the case of height growth.
DISCUSSION
EST-derived markers—a powerful tool for compar-ative mapping studies: The availability of gene frag-ment sequences, such as ESTs, has recently increased due to the broad development of sequencing program and gene expression studies. Transcriptome analyses in plants gave rise to an enormous potential for studying plant physiology and development (Alba et al. 2004) and made available gene sequences through EST data-bases. In the case of nonmodel species, such as most of the forest trees, this is of particular value for genetic and molecular studies. Usefulness of EST sequences was pointed out in conifer species. Given their high se-quence conservation between species, ESTs were shown to be of great interest for comparative mapping studies in pine species (Brownet al. 2001). In addition, some ESTs colocating with QTL for wood quality were con-sidered as putative candidate genes for this trait (Brown
et al. 2003; Chagne´ et al. 2003). Our results confirmed
both the efficiency of EST-derived markers for compar-ative mapping studies and their high potential to iden-tify candidate genes.
STS amplification results clearly showed that a high proportion (70%) of markers developed from ESTs were amplified in oak and easily cross-amplified in chest-nut. The location of the primers in the most conserved regions of the EST sequences and the amplification of coding regions were most likely the reasons for this high amplification efficiency. Roughly, 50% of the STSs amplified larger fragments than expected on the basis of the EST sequence. This result could be explained by the occurrence of intronic sequences. The presence of introns increases the chance to detect informative polymorphisms for mapping, but it could also represent a drawback. Because of the lower PCR efficiency, larger fragments were often difficult to amplify. Therefore, considering the possible presence of introns in ampli-fied fragments, it seemed judicious to design primer pairs for amplifying fragments of a quite small size (100– 400 bp).
Several approaches were available to detect mutations in amplified DNA fragments (Ahmadian2001). Among
T
ABLE
3
Number
o
f
unique
and
colocated
QTL
detected
in
Q.
robur
and
C.
sativa
,
respectively
Linkage
groups
Q1-C6
Q2-C1
Q3-C8
Q4-C2
Q5-C4
Q6-C11
Q7-C5
Q8-C7
Q9-C9
Q10-C10
Q11-C3
Q12-C12
T
otal
Q-C
Feltus
test
Bud
burst
Unique
QTL
in
Q-C/colocalized
QTL
1-1/1
2-1/1
0-0/0
2-1/1
1-1/1
1-0/0
1-1/1
0-0/0
1-2/1
1-0/0
2-2/2
1-1/1
13-10/9
0.000211
Carbon
isotope
discrimination
Unique
QTL
in
Q-C/colocalized
QTL
0-1/0
1-1/0
0-1/0
0-0/0
0-1/0
1-0/0
0-0/0
1-0/0
1-0/0
0-1/0
1-2/0
0-0/0
5-7/0
—
Height
growth
Unique
QTL
in
Q-C/colocalized
QTL
0-0/0
0-1/0
1-1/0
0-1/0
1-0/0
1-1/1
0-0/0
0-1/0
0-0/0
1-1/1
1-0/0
0-0/0
5-6/2
0.193668
In
each
entry
the
numbers
represent
the
number
of
unique
QTL
in
Quercus-the
number
of
unique
QTL
in
Castanea/the
number
of
colocated
the different techniques, SSCP and DGGE were pre-ferred in this work, for several reasons. They did not need any previous sequence characterization of the amplified fragment, the cost was significantly lower than that of SNP genotyping approaches, and they required only equipment readily available in molecular biology laboratories. Moreover, several polymorphisms could sometimes be revealed simultaneously, giving us the possibility to obtain codominant and full informa-tive molecular markers. In our case, SSCP and DGGE techniques represented very efficient approaches for mapping EST-derived markers. We decided to screen amplified STS fragments, first using SSCP. It has been shown that 90% of the mutations present in a given DNA fragment can be detected using this technique (Nataraj et al. 1999). Using SSCP and DGGE, in-formative polymorphisms for mapping have been de-tected in 70% (43/61) and 66% (47/71) of the total number of ESTs in oak and chestnut, respectively. These results show very clearly that ESTs are an important source of molecular markers for comparative mapping studies.
Alignment of the 12 Q. robur and C. sativa linkage groups:Mapping of 55 orthologous molecular markers into theQ. robur andC. sativagenetic maps permitted us to align the 12 linkage groups of both species. Mac-rosynteny and macrocolinearity were well conserved between the two species (Figure 1). No major macro-rearrangements were observed and inversions between tightly linked markers were probably due to mapping errors or real inversions. Comparative mapping studies in plant species showed that microrearrangements occurred more frequently than macrorearrangements during plant genome evolution (Bennetzen 2000). Density of common orthologous anchor markers be-tween the oak and chestnut genomes is still very low. Thus, rearrangements between these two genomes still remain undetected. It is interesting to point out that new duplications and microrearrangements be-tween rice and maize were only recently identified using sequence data (Patersonet al. 2004; Salseet al. 2004) and these authors adopted a more critical view of the well-known ‘‘single genetic system’’ model in the Poa-ceae family (Bennetzenand Freeling1993; Galeand Devos 1998). Thus, our results concerning oak and chestnut genomes are still very preliminary.
Anyway, despite the lack of exhaustive data, much evidence suggests that genome organization and struc-ture are quite conserved within the Fagaceae family. Physical (0.94 pg/C and 0.81 pg/C in oak and chestnut, respectively) and genetic (1200 and 1050 cM in oak and chestnut, respectively) genome sizes are conserved betweenQ. roburandC. sativa. The two species share the same haploid number of chromosomes (2n¼2x¼24) and our findings suggest that the 12 linkage groups are homeologous, showing both conserved macrosynteny and macrocolinearity. Moreover, gene structure seems
to be conserved as demonstrated by amplification of similar STS fragment sizes even in the presence of in-tronic sequences. These preliminary results suggest a stable genome that probably, taking into account the physical genome size, contains a low proportion of re-peated sequences. Orthologous markers developed in this study and previously by Barrenecheet al. (2004) provide molecular tools of utmost importance to in-vestigate genome organization and evolution within the Fagaceae family.
Comparative QTL mapping for adaptive traits in Quercus and Castanea:Comparative QTL mapping has been often used to discover evolutionary conserved ge-nomic regions controlling quantitative traits (Paterson
et al. 1995). However, heterogeneous sampling
strate-gies can hamper the comparative analysis of QTL, as well as the small population sizes, which are used in most of the QTL detection experiments, can introduce im-portant biases in QTL results (Bartonand Keightley 2002). In our comparative QTL analysis, for instance, some important drawbacks have to be considered: first, QTL studies in oak (Scotti-Saintagneet al. 2004; O. Brendel, unpublished results) and chestnut (Casasoliet al. 2004) were based on only one full-sib family in each species; hence only a subsample of QTL existing in natural populations and controlling the three adaptive traits under study was considered here. Second, because of the relatively low population size, QTL of low effect remained mostly undetected and PEV values were overestimated (Beavis 1995). Moreover, confidence intervals of QTL positions were quite large, leading to an imprecise location of QTL on the linkage group. Despite these limitations, and because similar sampling strategies were used in both species, we were able to draw important conclusions from the comparative analysis that was discussed here. A first interesting observation concerned the overall conserva-tion of genetic architecture of adaptive traits between oak and chestnut in terms of QTL number and contribution to the phenotypic variance. In both species, similar numbers of QTL were detected for the three investigated adaptive traits, with a higher number of QTL for the timing of bud burst and a lower number for carbon isotope discrimina-tion and height growth.
genetic control, often showing high heritability values
(Howe et al. 2003). On the contrary, height growth is
under low to moderate genetic control and, in the case of juvenile height growth, genetic control changes from one developmental state to another (Wu et al. 2002). Taking into account that QTL detection power depends on the trait heritability, QTL for timing of bud burst would be more efficiently detected than QTL for height growth, as heritability of bud burst is rather high inQ.
robur(Scotti-Saintagneet al.2004).
Conservation of genomic regions controlling bud burst: Similarities and differences among the three studied adaptive traits show clearly when we compare the position of the detected QTL betweenQ. roburandC.
sativa. A highly statistically significant number of
colo-cations for QTL controlling the timing of bud burst was observed between oak and chestnut, whereas QTL co-locations for height growth seemed to occur by chance. No colocation was observed for carbon isotope discrim-ination. It is interesting to point out that homeologous linkage groups Q11 and C3 contained a QTL for carbon isotope discrimination detected several times, explain-ing a high phenotypic variance for this trait in both species, but the position was not conserved.
The conservation of QTL for timing of bud burst between oak and chestnut deserves particular attention, especially when taking into account the difference with the two other adaptive traits analyzed. As shown by Scotti-Saintagneet al.(2004) year–year genetic corre-lations for bud burst are significant. Therefore, QTL for this last trait were more stable across independent experiments in both oak and chestnut than QTL for growth or carbon isotope discrimination (Casasoliet al. 2004; Scotti-Saintagneet al. 2004; O. Brendel, un-published results). This could partially explain the higher conservation of QTL for bud burst between these two species. Timing of bud burst is probably a less complex trait than carbon isotope discrimination or growth, as less physiological processes contribute to the phenotypic expression of the trait. Timing of bud burst in forest trees is mostly influenced by temperature
(Howeet al. 2003). Contrastingly, different and
numer-ous environmental factors could affect both carbon iso-tope discrimination (Brugnoliand Farquhar 2000) and growth (Kirschbaum2000), and therefore a high number of physiological processes are involved in their phenotypic expression. This implies that QTL detected for these traits can vary among experiments depending on the environmental factor predominantly acting on the physiological component involved. QTL detection under controlled experimental conditions could help to verify this hypothesis.
Another possible explanation, for the difference in QTL conservation among the three adaptive traits ana-lyzed, could be in the mechanisms responsible for phe-notypic plasticity. Using a QTL approach, Wu (1998) concluded that phenotypic plasticity of growth in
Po-pulus depends mostly on gene regulation. Genes and molecular mechanisms responsible for phenotypic plas-ticity are poorly known. Two hypotheses have been proposed: on the one hand, identical alleles expressing different effects depending on the environment might determine varying phenotypes of the same genotype (‘‘allelic sensitivity’’); on the other hand, regulating genes might turn on or off other genes depending on the environment (‘‘gene regulation’’) (Viaet al. 1995). If phenotypic plasticity of carbon isotope discrimination and growth is governed mostly by gene regulation, and phenotypic plasticity of timing of bud burst is dominated by allelic sensitivity, then the result of our QTL compar-ative mapping could be explained in terms of these mechanisms: the same loci would be involved mostly in the case of bud burst, whereas different loci would be involved mostly in carbon isotope discrimination and height growth. Taking into account the difference in trait complexity and in the number of environmental factors acting on these traits, this explanation could be likely. Nevertheless, no experimental data can support this hypothesis.
Our results also raised the issue of the maintenance of polymorphism at the same loci in Quercus and Casta-nea. In both species, many loci controlling bud burst were heterozygotes in the parental individuals of the controlled cross used for QTL detection. Although timing of bud burst is under strong natural selection in forest species, a high level of within-population varia-tion is maintained (Howeet al. 2003) in these species. Our results suggested that these selection pressures were acting on the same genomic regions through mecha-nisms able to maintain diversity over long evolutionary times (balancing, disruptive, or frequency-dependent selection). At least in oaks, it has been shown that co-evolution of defoliating insects and oaks may be re-sponsible for wide within-population variation of bud burst (Tikkanenand Tiitto2003). Maintenance of a high level of heterozygote loci would fit well with the hypothesis of a phenotypic plasticity mainly based on allelic sensitivity. In this case, the high level of within-population variation would be an evolutionary strategy to keep a high level of phenotypic plasticity. Conser-vation of QTL position does not imply that genes responsible for the QTL are the same. In the Poaceae family, Doustet al. (2004) showed thattb1 gene, playing a major role in the genetic control of branching in maize, was only poorly involved in foxtail millet, despite conservation of QTL and gene positions. Other genes located in the same chromosomal region could be better candidates in the case of foxtail millet. Thus, despite the striking conservation of QTL controlling timing of bud burst inQ. roburandC. sativa, this work did not allow us to make any conclusions about correspondence of loci controlling this trait between the two species.
candidate genes. Examples of ESTs to be considered are cons58 (coding for auxin-repressed protein) and 08C11 (coding for a metal nicotianamine transporter, YSL1), which are located in conserved QTL of bud burst. How-ever, given the large confidence interval of QTL posi-tion, additional arguments will be needed to refine the final choice of candidate genes.
We thank E. Bertocchi, A. Casasoli, M. Casasoli, M. Cherubini, G. De Simoni, A. Prudenzi, and G. Roussel for assistance in the field work. We acknowledge M. Lauteri and M. C. Monteverdi for phenotypic measurements in chestnut and T. Barreneche, C. Plomion, D. Pot, and C. Scotti-Saintagne for suggestions on QTL analysis. This work was supported by the European Union research projects ‘‘CASCADE’’ (EVK2-CT-1999-00006) and ‘‘OAKFLOW’’ (QLK5-2000-00960). We thank the Institut National de la Recherche Agronomique for funding a Ph.D. fellowship to J.D.
LITERATURE CITED
Ahmadian, A., 2001 Approaches for Analysis of Mutations and Genetic Variations.Department of Biotechnology, Royal Institute of Tech-nology, KTH, Stockholm.
Alba, R., Z. Fei, P. Payton, Y. Liu, S. L. Mooreet al., 2004 ESTs,
cDNA microarrays, and gene expression profiling: tools for
dis-secting plant physiology and development. Plant J. 39: 697–
714.
Altschul, S. F., W. Gish, W. Miller, E. W. Myersand D. J. Lipman,
1990 Basic local alignment search tool. J. Mol. Biol.215:403–
410.
Arcade, A., A. Labourdette, M. Falque, B. Mangin, F. Chardon et al.,2004 BioMercator: integrating genetic maps and QTL
towards discovery of candidate genes. Bioinformatics20:2324–
2326.
Barakat, A., K. Szick-Miranda, I. F. Chang, R. Guyot, G. Blanc et al., 2001 The organization of cytoplasmic ribosomal protein
genes in the Arabidopsis genome. Plant Physiol.127:398–415.
Barreneche, T., C. Bodenes, C. Lexer, J. F. Trontin, S. Fluchet al.,
1998 A genetic linkage map ofQuercus robur L. (peduculate
oak) based on RAPD, SCAR, microsatellite, minisatellite, isozyme
and 5SrDNA markers. Theor. Appl. Genet.97:1090–1103.
Barreneche, T., M. Casasoli, K. Russell, A. Akkak, H. Meddour et al., 2004 Comparative mapping betweenQuercusandCastanea
using simple-sequence repeats (SSRs). Theor. Appl. Genet.108:
558–566.
Barton, N. H., and P. D. Keightley, 2002 Understanding
quanti-tative genetic variation. Nat. Rev.3:11–21.
Barton, N. H., and M. Turelli, 1989 Evolutionary quantitative
genetics: How little do we know? Annu. Rev. Genet.23:337–
370.
Beavis, W. D., 1995 The power and deceit of QTL experiments:
lessons from comparative QTL studies, pp. 304–312 inProceedings
of the 49th Annual Corn and Sorghum Industry Research Conference. ASTA, Washington, DC.
Bennetzen, J. L., 2000 Comparative sequence analysis of plant nu-clear genomes: microcolinearity and its many exceptions. Plant
Cell12:1021–1029.
Bennetzen, J. L., and M. Freeling, 1993 Grasses as a single genetic system: genome composition, colinearity and compatibility.
Trends Genet.9:259–261.
Brown, G. R., E. E. Kadel, III, D. L. Bassoni, K. L. Kiehne, B. Temesgen
et al., 2001 Anchored reference loci in loblolly pine (Pinus taedaL.)
for integrating pine genomics. Genetics159:799–809.
Brown, G. R., D. L. Bassoni, G. P. Gill, J. R. Fontana, N. C. Wheeler
et al., 2003 Identification of quantitative trait loci influencing
wood property traits in loblolly pine (Pinus taedaL.). III. QTL
verification and candidate gene mapping. Genetics164:1537–
1546.
Brugnoli, E., and G. D. Farquhar, 2000 Photosynthetic
fraction-ation of carbon isotopes, pp. 399–434 inPhotosynthesis: Physiology
and Metabolism. Advances in Photosynthesis, edited by R. C. Leegood,
T. D. Sharkeyand S.vonCaemmerer. Kluwer Academic
Publish-ers, Dordrecht, The Netherlands.
Casasoli, M., C. Mattioni, M. Cherubiniand F. Villani, 2001 A
genetic linkage map of European chestnut (Castanea sativaMill.)
based on RAPD, ISSR and isozyme markers. Theor. Appl. Genet.
102:1190–1199.
Casasoli, M., D. Pot, C. Plomion, M. C. Monteverdi, T. Barreneche et al., 2004 Identification of QTLs affecting adaptive traits in Castanea sativaMill. Plant Cell Environ.27:1088–1101. Chagne´, D., G. R. Brown, C. Lalanne, D. Madur, D. Potet al.,
2003 Comparative genome and QTL mapping between
mari-time and loblolly pines. Mol. Breed.12:185–195.
Don, R. H., P. T. Cox, B. J. Wainwright, K. Bakerand J. S. Mattick,
1991 Touchdown PCR to circumvent spurious priming during
gene amplification. Nucleic Acids Res.19: 4008.
Doust, A. N., K. M. Devos, M. D. Gadberry, M. D. Galeand E. A.
Kellogg, 2004 Genetic control of branching in foxtail millet.
Proc. Natl. Acad. Sci. USA15:9045–9050.
Feltus, F. A., G. E. Hartand A. H. Paterson, 2003 QTL correspon-dence in diverse sorghum populations: statistically significant overlap of tiller height and testa factor QTLs. International Plant and Animal Genome Conference, January 11–15, 2003, Town & Country Convention Center, San Diego (http://www.intl-pag. org/pag/11/abstracts/P5d_P458_XI.html).
Fisher, R. A., 1930 The Genetical Theory of Natural Selection.Oxford University Press, Oxford.
Gale, M. D., and K. M. Devos, 1998 Comparative genetics in the
grasses. Proc. Natl. Acad. Sci. USA95:1971–1974.
Guo, W.-J., W. Bundithyaand P. B. Goldsbrough, 2003
Charac-terization of the Arabidopsis metallothionein gene family: tissue-specific expression and induction during senescence and in
response to copper. New Phytol.159:369–381.
Howe, G. T., S. N. Aitken, D. B. Neale, K. D. Jermstad, N. C.
Wheeleret al., 2003 From genotype to phenotype: unraveling the complexities of cold adaptation in forest trees. Can. J. Bot.
81:1247–1266.
Hurme, P., M. J. Sillanpa¨ a¨, E. Arjas, T. Repoand O. Savolainen,
2000 Genetic basis of climatic adaptation in Scot pine by
Bayes-ian quantitative trait locus analysis. Genetics156:1309–1322.
Jermstad, K. D., D. L. Bassoni, K. S. Jech, G. A. Ritchie, N. C. Wheeleret al., 2003 Mapping of quantitative trait loci control-ling adaptive traits in coastal Douglas fir. III. Quantitative trait
loci-by-environment interactions. Genetics165:1489–1506.
Kirschbaum, M. U. F., 2000 Forest growth and species distribution
in a changing climate. Tree Physiol.20:309–322.
Kosambi, D. D., 1944 The estimation of map distance from
recom-bination values. Ann. Eugen.12:172–175.
Lander, E. S., P. Green, J. Abrahamson, A. Barlow, M. J. Dalyet al.,
1987 MAPMAKER: an interactive computer package for
con-structing primary genetic linkage maps of experimental and
nat-ural populations. Genomics1:174–181.
Lin, Y. R., K. F. Schertzand A. H. Paterson, 1995 Comparative
analysis of QTLs affecting plant height and maturity across the Poaceae, in reference to an interspecific sorghum population.
Genetics141:391–411.
Manos, P. S., and K. P. Steele, 1997 Phylogenetic analyses of
‘‘higher’’ Hamamelidiae based on plastid sequence data. Am.
J. Bot.84:1407–1419.
Manos, P. S., Z.-K. Zhouand C. H. Cannon, 2001 Systematics of
Fagaceae: phylogenetic tests of reproductive trait evolution.
Int. J. Plant Sci.162:1361–1379.
Mitchell-Olds, T., 1995 The molecular basis of quantitative
ge-netic variation in natural populations. Trends Ecol. Evol. 10:
324–328.
Myers, R. M., T. Maniatisand L. S. Lerman, 1987 Detection and
localization of single base changes by denaturing gradient
gel-electrophoresis. Methods Enzymol.155:501–527.
Nataraj, A. J., I. Olivos-Glander, N. Kusukawaand W. E. Highsmith,
Jr., 1999 Single-strand conformation polymorphism and
hetero-duplex analysis for gel-based mutation detection. Electrophoresis
20:1177–1185.
Orita, M., H. Iwahana, H. Kanazawa, K. Hayashiand T. Sekiya,
1989 Detection of polymorphisms of human DNA by gel
elec-trophoresis as single-strand conformation polymorphisms. Proc.
Orr, A. H., 1998 The population genetics of adaptation: the
distri-bution of factors fixed during adaptive evolution. Evolution52:
935–949.
Orr, A. H., 2000 Adaptation and the cost of complexity. Evolution
54:13–20.
Orr, A. H., and J. A. Coyne, 1992 The genetics of adaptation: a
re-assessment. Am. Nat.140:725–742.
Paterson, A. H., Y.-R. Lin, Z. Li, K. F. Schertz, J. F. Doebleyet al.,
1995 Convergent domestication of cereal crops by
indepen-dent mutations at corresponding genetic loci. Science 269:
1714–1718.
Paterson, A. H., J. E. Bowersand B. A. Chapman, 2004 Ancient polyploidization predating divergence of the cereals, and its con-sequences for comparative genomics. Proc. Natl. Acad. Sci. USA
101:9903–9908.
Plomion, C., P. Hurme, J.-M. Frigerio, M. Ridolphi, D. Potet al.,
1999 Developing SSCP markers in two Pinus species. Mol.
Breed.5:21–31.
Porth, I., M. Koch, M. Berenyi, A. Burgand K. Burg, 2005a
Iden-tification of adaptation specific differences in the mRNA expres-sion of sessile and pedunculate oak based on osmotic stress
induced genes. Tree Physiol.25:1317–1329.
Porth, I., C. Scotti-Saintagne, T. Barreneche, A. Kremerand K.
Burg, 2005b Linkage mapping of osmotic stress induced genes
in oaks. Tree Genet. Genomes1:31–40.
Ritter, E., C. Gebhardtand F. Salamini, 1990 Estimation of re-combination frequencies and construction of RFLP linkage maps in plants from crosses between heterozygous parents. Genetics
125:645–654.
Salse, J., B. Piegu, R. Cookeand M. Delseny, 2004 New in silico
insight into the synteny between rice (Oryza sativaL.) and maize
(Zea maysL.) highlights reshuffling and identifies new
duplica-tions in the rice genome. Plant J.38:396–409.
Scotti-Saintagne, C., C. Bode´ ne` s, T. Barreneche, E. Bertocchi, C. Plomionet al., 2004 Detection of quantitative trait loci
con-trolling bud burst and height growth inQuercus roburL. Theor.
Appl. Genet.109:1648–1659.
Syva¨ nen, A.-C., 2001 Accessing genetic variation: genotyping single
nucleotide polymorphisms. Nat. Rev. Genet.2:930–942.
Temesgen, B., G. R. Brown, D. E. Harry, C. S. Kinlaw, M. M. Sewell et al., 2001 Genetic mapping of expressed sequence tag
poly-morphism (ESTP) markers in loblolly pine (Pinus taeda L.).
Theor. Appl. Genet.102:664–675.
Tikkanen, O.-P., and R. J. Tiitto, 2003 Phenological variation as
protection against defoliating insects: the case ofQuercus robur
andOperophtera brumata.Oecologia136:244–251.
VanOijen, J. W., and R. E. Voorrips, 2001 Joinmap 3.0, Software for the
Calculation of Genetic Linkage Maps.Plant Research International, Wageningen, The Netherlands (http://www.joinmap.nl). Verhoeven, K. J. F., T. K. Vanhala, A. Biere, E. Nevoand J. M. M.
vanDamme, 2004 The genetic basis of adaptive population
dif-ferentiation: a quantitative trait locus analysis of fitness traits in two wild barley populations from contrasting habitats. Evolution
58:270–283.
Via, S., R. Gomulkiewicz, G. De Jong, S. M. Scheiner, C. D.
Schlichtinget al., 1995 Adaptive phenotypic plasticity:
consen-sus and controversy. Trends Ecol. Evol.10:212–217.
Voorrips, R. E., 2002 MapChart: software for the graphical
presen-tation of linkage maps and QTLs. J. Hered.93:77–78.
Weng, C., T. L. Kubisiak, C. D. Nelsonand M. Stine, 2002
Map-ping quantitative trait loci controlling early growth in a (logleaf
pine x slash pine)3slash pine BC1family. Theor. Appl. Genet.
104:852–859.
Wu, R. L., 1998 The detection of plasticity genes in heterogeneous
environments. Evolution52:967–977.
Wu, R., C. X. Ma, J. Zhuand G. Casella, 2002 Mapping epigenetic
quantitative trait loci (QTL) altering a developmental trajectory.
Genome45:28–33.