Population Genetics of Polymorphism and Divergence for Diploid Selection
Models With Arbitrary Dominance
Scott Williamson,
1Adi Fledel-Alon and Carlos D. Bustamante
Department of Biological Statistics and Computational Biology, Cornell University, Ithaca, New York 14853
Manuscript received November 19, 2003 Accepted for publication May 15, 2004
ABSTRACT
We develop a Poisson random-field model of polymorphism and divergence that allows arbitrary domi-nance relations in a diploid context. This model provides a maximum-likelihood framework for estimating both selection and dominance parameters of new mutations using information on the frequency spectrum of sequence polymorphisms. This is the first DNA sequence-based estimator of the dominance parameter. Our model also leads to a likelihood-ratio test for distinguishing nongenic from genic selection; simulations indicate that this test is quite powerful when a large number of segregating sites are available. We also use simulations to explore the bias in selection parameter estimates caused by unacknowledged dominance relations. When inference is based on the frequency spectrum of polymorphisms, genic selection estimates of the selection parameter can be very strongly biased even for minor deviations from the genic selection model. Surprisingly, however, when inference is based on polymorphism and divergence (McDonald-Kreitman) data, genic selection estimates of the selection parameter are nearly unbiased, even for com-pletely dominant or recessive mutations. Further, we find that weak overdominant selection can increase, rather than decrease, the substitution rate relative to levels of polymorphism. This nonintuitive result has major implications for the interpretation of several popular tests of neutrality.
C
HARACTERIZING the various forces that shape Hartl(1992) made some fairly restrictive assumptions regarding population processes. They assumed equal patterns of genetic polymorphism within andbe-mutational fitness effects, random mating, genic selec-tween species is the central goal of population genetics
tion (i.e., no dominance), independence among sites
(Lewontin1974). To that end, statistical inference
us-(i.e., free recombination), and a stationary population ing Poisson random field (PRF) models (Sawyerand
size. Recently, an effort has been made to relax these
Hartl1992;Hartlet al.1994;Bustamanteet al.2001)
assumptions one by one.Bustamanteet al.(2003) re-provides powerful likelihood and Bayesian methods for
laxed the assumption of equal mutational effects by quantifying some of these forces, such as mutation and
assuming that the fitness effects of different classes of directional selection. Because PRF models assume high
new mutations are drawn from some underlying distri-levels of recombination between sites, they are
particu-bution. Using this method, it is possible to estimate the larly well suited to the analysis of polymorphism and
distribution of mutational effects using DNA sequence divergence at multiple loci distributed across a genome.
data; the exact form of this distribution is critical to a For example, using a set of sequences from 12 genes in
general understanding of microevolution.Wakeley(2003) Arabidopsis and 34 genes in Drosophila,Bustamanteet
relaxed the assumption of random mating by applying
al.(2002) demonstrated that amino acid substitutions
an island model of population structure (Wright1931). in Drosophila tended to be more advantageous than
He found that, depending on the sampling regime amino acid substitutions in Arabidopsis, which they
at-among demes, population structure can strongly bias tributed to the very high rate of selfing in Arabidopsis.
estimates of mutation rates and divergence times ob-PRF models also provide extremely efficient methods
tained using the basic PRF model if sampling among for the simulation of polymorphism and divergence data
demes is not accounted for. Surprisingly, however, he under the assumption of free recombination, and it has
found that the estimate of the scaled selection parame-been used in this respect to estimate the power of several
ter is largely unaffected by island-model population statistical tests of neutrality (Akashi1999).
structure. In developing the original PRF model, Sawyerand
In this article, we relax the assumption of genic selec-tion. We generalize the original PRF model to account for arbitrary diploid selection models. Our generalized 1Corresponding author:Department of Biological Statistics and
Com-model yields maximum-likelihood estimators (MLEs)
putational Biology, 434 Warren Hall, Cornell University, Ithaca, NY
14853. E-mail: [email protected] for the scaled selection coefficient, ␥, and the
nance parameter, h. This is the first DNA
sequenced-f(q;␥,h)⫽e
4␥hq⫹2␥(1⫺2h)q2
q(1⫺q)
冮
1qe
⫺4␥h⫺2␥(1⫺2h)2
d
冮
10
e⫺4␥h⫺2␥(1⫺2h)2
d, (1)
based estimator of the dominance parameter, and simu-lations reveal that it performs very well when large
num-bers of segregating sites are available. We also use our whereqis the frequency of the derived nucleotide, and generalized PRF model to investigate the impact of dom- ␥ ⫽2Ns. Note that this expression is equivalent to Grif-inance on polymorphism and divergence data. Two sur- fiths’ (2003) expression (32) for the distribution of prising results emerge from this analysis. First, we find allele frequencies under stationarity, which was derived that dominance relations generally have very little im- in a different manner. This can be demonstrated by pact on ratios of polymorphism to divergence. There- substituting (x) ⫽ 4␥(h ⫹ (1 ⫺ 2h)x)x(1 ⫺ x) and fore, statistical inferences based on these ratios (Sawyer 2(x)⫽x(1⫺x) into expressions (12), (13), (14), and
andHartl1992) are robust to a violation of the assump- (32) inGriffiths(2003).
tion of genic selection. Second, we find that weak and Expanding to multiple sites, if each site is indepen-moderate overdominant selection can sometimes de- dent, then the mutant allele frequency at each site is a crease the ratio of polymorphism to divergence relative random draw from the above distribution, with the rela-to a neutral standard. This result is contrary rela-to intuition. tive density of the distribution proportional to the muta-One might expect that balancing selection (overdomi- tion rate (Sawyerand Hartl1992). To estimate the nance is a special case of balancing selection) would parameters of the above distribution, consider polymor-always increase, rather than decrease, the ratio of poly- phism data in the form of a site frequency spectrum. If morphism to divergence because balancing selection outgroup sequence data are available so that ancestral actively maintains polymorphism. and derived nucleotides can be distinguished, then the A wealth of theory exists relating how different types site frequency spectrum is a vector,x, where each entry, of dominance relations affect patterns of polymorphism xi, is a count of the number of sites at which the derived and divergence (e.g., Cherry 2003, 2004; Griffiths nucleotide is representeditimes in a sample of sizen, 2003;Roze andRousset2003; Whitlock2003). No- fori ⫽1, 2, . . . , n⫺ 1. For a given allele frequency, ticeably absent, however, are any methods of statistical q, at a given site, the probability of choosingi derived inference for distinguishing nongenic from genic selec- nucleotides in a sample of n individuals is given by a tion, so the role of dominance has been relatively under- binomial distribution with meannq. Thus, the expecta-studied by empirical population geneticists. The domi- tion of each of thexiisF(n, i;␥,h), where
nance parameter has important implications for a number
of evolutionary phenomena, such as inbreeding depres- F(n,i;␥,h)⫽
冮
1
0
冢
ni
冣
qi(1⫺
q)n⫺i
f(q;␥,h)dq, (2) sion (LynchandWalsh1998, Chap. 10), the
mainte-nance of genetic variation by mutation-selection-drift ⫽4N, andis the per-generation mutation rate in balance (CharlesworthandHughes2000), and ge- the entire region sampled. Further, if a Poisson number netic load (Crow1993). The methods we present here of mutations enter the population each generation, open up the possibility of using large DNA sequence then each of thexiwill be Poisson distributed (Ewens and single-nucleotide polymorphism (SNP) data sets 1974;SawyerandHartl1992). With the full probabil-to investigate how dominance affects variation at the ity distribution of each entry of the site frequency spec-molecular level. trum, the model parameters,h, and␥can be estimated
using maximum-likelihood methods.
Kimura (1964) also derived the fixation rate under
THEORY the dominance model. Measuring time in 2N
genera-tions, the instantaneous fixation rate at stationarity is For a given site, consider the case of irreversible
muta-tion from an ancestral nucleotideA1to a derived
nucleo-u(␥,h)⫽
冤
冮
10e
⫺4␥h⫺2␥(1⫺2h)2
d
冥
⫺1
. (3)
tideA2, occurring at rate. When this mutation process
is applied across many sites, it corresponds to the infi- Note thatu(␥,h) is equal to the stationary distribution nite-sites mutation model (Kimura1968, 1971;Watt- (1), evaluated at q ⫽ 1. PRF theory predicts that the
erson1975). Let 1, 1⫹2sh, and 1⫹2sbe the relative number of fixations over an arbitrary length of time,,
fitnesses of the genotypesA1A1,A1A2, andA2A2, respec- will be Poisson distributed with mean tively. With random mating, this model is formally
equiv-alent to models of frequency-dependent selection where
D(,,␥,h)⫽
2u(␥,h). (4) fitness is linearly related to allele frequency (e.g.,
Cherry 2004). Under the usual assumptions of the
For example, if two species divergedtdivgenerations ago, Wright-Fisher model (random mating, constant
popula-and both species have the same population sizeN, then tion size, nonoverlapping generations),Wright(1938)
the expected number of fixed differences observed in derived the quasi-stationary distribution of allele
fre-a sfre-ample from the two species is quency for the above diploid selection scheme.Kimura
Figure1.—The stationary dis-tribution of allele frequencies (top row) and the expected site-frequency spectrum (bottom row) for various values of the domi-nance parameter,h, and the selec-tion parameter,␥. The left-hand column depicts the case of nega-tive selection (␥ ⫽ ⫺10), and the right-hand column depicts the case of positive selection (␥ ⫽10). The expected site-frequency spec-tra were generated with n⫽ 15 and the scaled mutation parame-ter was set at ⫽20.
wheren1andn2are the sample sizes in the two popula- Maximum-likelihood estimation conditioning on the number of segregating sites:Because S ⫽兺n⫺1
i⫽1xi, and tions.
The effects of various types of nonadditive allelic in- because each of thexiare Poisson distributed, the joint teractions on the stationary distribution of allele fre- probability of the xi conditional on S is given by the quency are shown in Figure 1. Also shown are the ex- multinomial distribution withn⫺1 frequency classes, pected site frequency spectra for different combinations and the probability of each class is
of the selection (␥) and dominance (h) parameters.
Note thath ⫽ 0.5 corresponds to genic selection. For F(n,i;␥,h)
兺
n⫺1j⫽1F(n,j;␥,h)
. (6)
negative selection (␥ ⬍0), the density of the stationary distribution, and hence the expected number of
segre-The denominator of the expression (5) is the expecta-gating sites in the site frequency spectrum, is negatively
tion of S. Also note that the mutation parameter will related to h. This result is straightforward: the more
cancel. The log-likelihood of a given site frequency spec-recessive the deleterious nucleotide is, the more likely
trum is then it is to drift to observable frequencies. For positive
selec-tion (␥ ⬎0), the effect of dominance on the stationary
ᐉ(␥,h|x)⫽ln(n!)⫺
兺
n⫺1i⫽1
ln(xi!)⫹
兺
n⫺1i⫽1 xiln
冤
F(n,i;␥,h)
兺
n⫺1j⫽1F(n,j;␥,h)
冥
. distribution is more subtle. For high allele frequencies,
the density of the stationary distribution is positively (7)
related toh. This is due to the fact that, once a dominant,
Maximum-likelihood estimates of ␥ and h can be ob-advantageous mutation has attained high frequency
tained by finding the maximum of (7) using standard (e.g.,q⫽0.9), the sojourn time to fixation will be
rela-optimization techniques. We investigate the sampling tively long because the ancestral homozygote genotype
properties of these MLEs using both asymptotic-likeli-will be rare. More surprisingly, at very low frequencies
the dominance parameter does not strongly affect the hood theory and stochastic simulations.
density of the stationary distribution. One might expect Asymptotic-likelihood theory predicts that, for large to observe a relative excess of recessive, advantageous sample sizes (in our case the number of segregating mutations at low frequencies because additive and domi- sites), the joint sampling distribution of our MLEs will nant mutations attain high frequency much faster. How- be multinormally distributed (Kendall and Stuart
ever, this force is apparently counterbalanced by the 1973), with means given by the underlying true values greater probability of stochastic loss of the recessive of ␥ and h and a variance-covariance matrix given by mutations. In the case of heterozygote advantage (h⬎ the inverse of the Fisher information matrixI:
1 for␥ ⬎0, orh⬍0 for␥ ⬍0), there is sometimes an interior mode in the stationary distribution. This mode is centered on the deterministic prediction for the stable
equilibrium allele frequency (Fisher1922, 1930;Hal- I⫽ ⫺E
2ᐉ
␥2
2ᐉ
␥h
2ᐉ
␥h
2ᐉ
h2
. (8)
Thus the direct way to predict the sampling variance
and covariance is to calculate the second derivatives of
2F
i
h2 ⫽
冮
10
冢
ni
冣
qi(1⫺q)n⫺1 2
h2f(q;␥,h)dq. (13c)
the log-likelihood function and evaluate their
expecta-tions. Let Fi be shorthand for F(n, i; ␥, h). The first The expressions for the second derivatives offare also derivatives of the log-likelihood function in␥andhare given in the appendix. To arrive at the entries of the Fisher information matrix, we evaluate the expectations
ᐉ
␥⫽
兺
n⫺1
i⫽1 xi
冢
1
Fi
Fi
␥ ⫺
1
兺
n⫺1j⫽1Fj
兺
n⫺1j⫽1
Fj
␥
冣
(9a) of second derivatives ofnot depend onx ᐉ, noting that theTterms doi,
ᐉ
h⫽
兺
n⫺1
i⫽1 xi
冢
1
Fi
Fi
h ⫺
1
兺
n⫺1j⫽1Fj
兺
n⫺1j⫽1
Fj
h
冣
; (9b) I11⫽ ⫺E冤
2ᐉ
␥2
冥
⫽ ⫺兺
n⫺1
i⫽1
E[xi]T␥␥(n,i;␥,h) (14a)
exchanging the order of integration and the derivative,
I12⫽ I21⫽ ⫺E
冤
2ᐉ
␥h
冥
⫽ ⫺兺
n⫺1
i⫽1
E[xi]T␥h(n,i;␥,h) (14b) we have
Fi
␥ ⫽
冮
10
冢
ni
冣
qi(1 ⫺q)n⫺1
␥f(q;␥,h)dq (10a) I22⫽ ⫺E
冤
2ᐉh2
冥
⫽ ⫺兺
n⫺1
i⫽1
E[xi]Thh(n,i;␥,h), (14c)
whereE[xi]⫽SFi/兺jn⫽⫺11Fj. The inverse ofIis
Fi
h ⫽
冮
10
冢
ni
冣
qi(1 ⫺q)n⫺1
h f(q;␥,h)dq, (10b)
V⫽ 1
I11I22⫺I2 12
冢
I22 ⫺I12
⫺I12 I11
冣
. (15)where the first derivatives offare given in theappendix. The second derivatives of the log-likelihood function
are Therefore, the sampling variances and covariances of
the MLEs for the selection parameter,␥, and the domi-nance parameter,h, are
2ᐉ
␥2⫽
兺
n⫺1
i⫽1
xiT␥␥(n,i;␥,h) (11a)
Var(␥ˆ)⫽V11⫽ ⫺
冤冢
兺 n⫺1i⫽1
E[xi]Thh(n,i;␥,h)
冣
/
冤
兺 n⫺1i⫽1
E(xi)T␥␥(n,i;␥,h)
2ᐉ
␥h⫽
兺
n⫺1
i⫽1
xiT␥h(n,i;␥,h) (11b)
⫻ n兺⫺1
i⫽1
E[xi]Thh(n,i;␥,h)
2ᐉ
h2⫽
兺
n⫺1
i⫽1
xiThh(n,i;␥,h), (11c)
⫺
冢
n兺⫺1i⫽1
E[xi]T␥h(n,i;␥,h)
冣
2冥冥
where (16a)
T␥␥(n,i;␥,h)⫽
冢
1Fi
2F
i
␥2⫺ 1
Fi
冢
Fi
␥
冣
2
冣
Cov(␥ˆ,hˆ)⫽V12⫽
冢
兺 n⫺1i⫽1
E[xi]T␥h(n,i;␥,h)
冣
/
冤
兺 n⫺1i⫽1
E[xi]T␥␥(n,i;␥,h)
⫺
冢
1兺n⫺1
j⫽1Fj
兺
n⫺1j⫽1
2F
j
␥2⫺ 1 (兺n⫺1
j⫽1Fj)2
冢
兺
n⫺1j⫽1
Fj
␥
冣
2
冣
⫻ n兺⫺1i⫽1
E[xi]Thh(n,i;␥,h) (12a)
⫺
冢
n兺⫺1i⫽1
E[xi]T␥h(n,i;␥,h)
冣
2冥
T␥h(n,i;␥,h)⫽
冢
1
Fi
2
Fi
␥h⫺
1
Fi
Fi
␥ Fi
h
冣
(16b)
⫺
冢
兺n1⫺1j⫽1Fj
兺
n⫺1j⫽1
2F
j
␥h⫺
1 (兺n⫺1
j⫽1Fj)2
冢
兺
n⫺1j⫽1
Fj
␥
冣冢
兺
n⫺1
j⫽1
Fj
h
冣冣
Var(hˆ)⫽V22⫽ ⫺
冤冢
兺 n⫺1i⫽1
E[xi]T␥␥(n,i;␥,h)
冣
/
冤
兺 n⫺1i⫽1
E[xi]T␥␥(n,i;␥,h) (12b)
⫻ n⫺兺1
i⫽1
E[xi]Thh(n,i;␥,h)
Thh(n,i;␥,h)⫽
冢
1
Fi
2F
i
h2⫺ 1
Fi
冢
Fi
h
冣
2
冣
⫺
冢
n兺⫺1i⫽1
E[xi]T␥h(n,i;␥,h)
冣
2冥冥
.⫺
冢
1兺n⫺1
j⫽1Fj
兺
n⫺1j⫽1
2F
j
h2⫺ 1 (兺n⫺1
j⫽1Fj)2
冢
兺
n⫺1j⫽1
Fj
h
冣
2
冣
(16c)(12c) When investigating the sampling properties of the MLEs, we utilize assumed underlying “true” values of␥ and
andh in evaluatingE[xi] and the variousT- -terms. In practice, one may approximate the sampling variances
2F
i
␥2⫽
冮
10
冢
ni
冣
qi(1⫺q)n⫺1 2
␥2f(q;␥,h)dq (13a) and covariance of the parameter estimates by
substitut-ing the MLEs into expressions (16).
Sampling properties of␥ˆ andhˆ:The asymptotic joint
2F
i
␥h ⫽
冮
10
冢
ni
冣
qi(1⫺ q)n⫺1 2
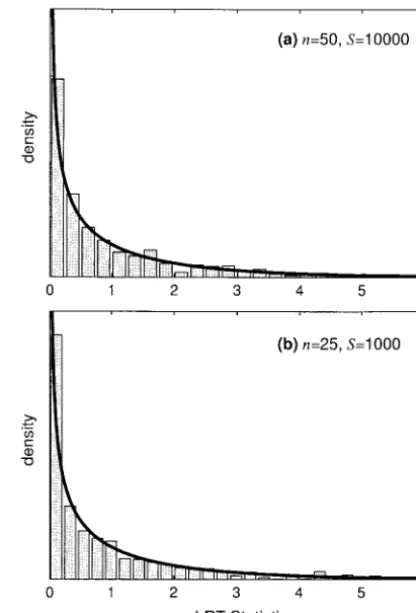
Figure 2.—The asymp-totic and simulated joint sampling distributions for maximum-likelihood esti-mates of the selection (␥ˆ) and dominance (hˆ) parame-ters. The white lines indi-cate the underlying true val-ues. Each plot ranges ⫾3 asymptotic standard devia-tions from the true values in each axis (␥ˆ andhˆ), and tick marks are drawn at ⫾2 as-ymptotic standard devia-tions from the means. The plots were generated with
S⫽10,000 andn⫽25. Sim-ulations for partially domi-nant, strongly deleterious mutations (␥ ⫽ ⫺20, h ⫽
0.8) are not shown due to the computational difficulty of optimizing the likelihood function in this region of the parameter space.
for a reasonable sample size (n⫽ 25), a large number confidence interval on hˆ is 0.8⫾ 4.11, and the 95% confidence interval on␥ˆ is⫺10⫾98.71. In this situa-of segregating sites (S⫽10,000), and several underlying
true values of ␥ and h. Also shown are the simulated tion, one will have virtually no power to make inferences or to reject null hypotheses such as␥ ⫽0 (neutrality) joint sampling distributions (see below for details of
the simulations). In general, the estimation procedure orh⫽0.5 (genic selection). Fortunately, though, quan-titative genetic analyses (e.g.,SimmonsandCrow1977; seems to perform exceptionally well when data are
gath-ered from a large number of segregating sites: The Crow and Simmons 1983; Willis 1999; Kelly2003) suggest that strongly deleterious mutations tend to be entries of the variance-covariance matrix are small, and
simulated MLEs cluster tightly around true values. Also, recessive. Also, biochemical models (KacserandBurns
1981) suggest that mutations of large effect will tend to the agreement between the asymptotic prediction for
the joint sampling distribution of our MLEs and the be recessive. To summarize, the one situation where our estimator performs poorly is thought to occur rarely simulated distribution is generally quite good. These
results indicate that it is possible to estimate dominance in natural populations.
Thus far we have reported results for a large number parameters from DNA polymorphism data alone. The
main exception to this result is the case of strongly of segregating sites, with the presumption that the method would be applied at the genomic level to large deleterious (␥ ⬍ ⫺5) and at least partially dominant
(h ⬎ 0.5) mutations. In this region of the parameter SNP data sets, and we have found that the estimation procedure works surprisingly well in this situation for space, the sampling variances and covariance of␥ˆ and
hˆ become extremely large. For instance, for ␥ ⫽ ⫺20 most parameter combinations. For smaller data sets (S⬍
(6). Using this simulated data, the likelihood function (7) was evaluated using the extended midpoint numeri-cal integration algorithm (Presset al. 1988, Chap. 4) and then maximized using the Fletcher-Reeves-Polak-Ribiere optimization routine (Presset al.1988, Chap. 10). The likelihoods from the two different models were then compared using the LRT statistic. This procedure was repeated 1000 times for each parameter combina-tion, using the 190-node Computational Biology Service Unit cluster at the Cornell Theory Center (www.tc.cor nell.edu).
Statistical power,i.e., the proportion of tests that reject the null hypothesis, is shown in Figure 4 as a function of the dominance parameterh. Results are not reported for dominant, strongly deleterious mutations (␥ ⫽ 20 and h ⬎ 0.5) because the large sampling variances of the MLEs in this region of the parameter space made it difficult to optimize the likelihood function. In general, given enough segregating sites, the LRT is extremely powerful in detecting deviations from the genic selec-tion model, even for very weak selecselec-tion (|␥|⬍5) and incomplete dominance (0 ⬍ h ⬍ 1, h ⬆ 0.5). This indicates that the “signature” of nongenic selection is evident from patterns of DNA sequence polymorphism, and it is indeed possible to identify nongenic selection and estimate dominance parameters. Figure 4 also shows that, above n ⫽ 25, the sample size makes very
Figure3.—The asymptotic standard deviation of the
maxi-little difference in one’s ability to detect departures mum-likelihood estimates for the selection (␥ˆ) and
domi-from genic selection. However, an increase in the ob-nance (hˆ) parameters as a function of the observed number
of segregating sites. Solid lines represent underlying true val- served number of segregating sites can make a substan-ues of␥ ⫽ ⫺10 andh⫽0.2, and dotted lines represent the tial difference in statistical power. Despite the positive case of␥ ⫽10 andh⫽0.8.n⫽25 for all curves. relationship between power and the number of
segre-gating sites, we do observe appreciable power even for a small number of segregating sites in some situations. For example, if advantageous mutations are completely and dominance parameters is greatly diminished.
Not-ing that E[xi] ⬀ S, we see that the sampling variance dominant or completely recessive, statistical power is high even forS⫽100.
and covariance terms in expressions (15) are inversely
proportional toS. This hyperbolic dependence onSis In estimating statistical power, we have made the as-ymptotic assumption that our LRT statistic is chi-square reflected in Figure 3, which shows the standard
devia-tion of the MLEs as a funcdevia-tion ofS. distributed. To assess the validity of this assumption, we conducted several simulations under the null hypothesis Power to detect nonadditive allelic interactions:The
two-parameter model with selection and dominance can of genic selection. If the asymptotic assumption is ap-propriate, then the 95% quantile of our simulated LRT be compared to the one-parameter basic PRF model
(SawyerandHartl1992) by employing a likelihood- statistics should closely approximate the 95% (P⫽0.05)
critical value of the chi-square distribution with 1 d.f. ratio test (LRT). Here, genic selection (h⫽ 0.5) is the
null hypothesis and the LRT statistic, 2(ᐉ(␥ˆ,hˆ|x)⫺ᐉ(␥ˆo, The 95% quantiles of our simulated LRTs are shown
in Table 1 for several combinations of the selection
1⁄
2|x)), is expected to be chi-square distributed with 1
d.f. under the asymptotic assumption (␥ˆodenotes the parameter, sample size, and number of segregating sites.
In general, the simulated critical values are very close maximum-likelihood estimate of the selection
parame-ter under the assumption of genic selection). We con- to the chi-square critical value. Also, the simulated distri-bution of the LRT statistic closely conforms to the chi-ducted stochastic simulations to determine the statistical
power (probability of rejecting genic selection) this test square distribution with 1 d.f. Some example distribu-tions are shown in Figure 5.
has in detecting deviations from strictly genic selection.
The simulation procedure is straightforward. First, to Bias in estimating selection parameters:To assess the bias caused by estimating selection in the presence of simulate data, we conducted S pseudo-random draws
Figure 4.—Statistical power (fraction of tests that reject the null hypothesis) of the likelihood-ratio test to reject genic selection, shown as a function of the domi-nance parameter,h. Power was eval-uated by simulating 1000 indepen-dent data sets for each parameter combination and then applying the likelihood-ratio test for each data set.
mated the selection parameter assuming the one-param- apply the genic-selection model to data in the form of a site-frequency spectrum. A simple chi-square good-eter genic-selection model. The relative bias due to
un-acknowledged dominance relations is shown in Figure ness-of-fit test is appropriate for this purpose. Under genic selection, the following statistic should be chi-6. Dominance can have a major impact on the
genic-selection estimate of the genic-selection parameter, especially square distributed with n⫺3 d.f., for the case of strong positive selection. If new mutations
2(ᐉg(x)⫺ ᐉ(␥ˆo,1⁄2|x)), (17)
are advantageous but recessive, then the genic-selection
model substantially underestimates the selection pa- where rameter, to the point that one sometimes incorrectly
identifies negative, rather than positive, selection. If new
ᐉg(x)⫽ln(n!) ⫺
兺
n⫺1
i⫽1
ln(xi!)⫹
兺
n⫺1i⫽1 xiln
冤
xi
S
冥
. (18)mutations are advantageous and dominant, then the genic-selection model yields large to extreme
overesti-In our simulations, this goodness-of-fit test leads us mates of the selection parameter, even for slightly
domi-to convincingly reject the genic-selection model in cases nant mutations (0.5 ⬍ h ⬍ 0.7). Our genic-selection
where the genic-selection estimate of the selection pa-estimates of the selection parameter were sometimes
rameter is strongly biased. For example, for␥ ⫽20 and pushed to the upper limit (␥ ⫽100) of the range of
h⫽0.7, the average MLE of␥under the genic-selection possible selection parameters that we allowed in our
model is␥ˆo⫽66.9. In this case, the average
goodness-simulations. In general, the genic-selection model for
of-fit statistic over 1000 simulations has a P-value the site-frequency spectrum does not reliably
character-⬍10⫺100.
ize nongenic, positive selection. For the case of negative
McDonald-Kreitman polymorphism and divergence data: selection, the bias introduced by dominance relations
The McDonald-Kreitman test of neutrality (McDonald
is less extreme, but still substantial. In general, if new
andKreitman 1991) contrasts the ratios of
polymor-mutations are deleterious and at least partially recessive,
phism to divergence across different classes of muta-then one tends to overestimate the selection parameter.
tions. If one of the classes (e.g., synonymous sites) is The opposite pattern is observed if new mutations are
thought to evolve neutrally fora priorireasons, this class deleterious and partially dominant; i.e., one tends to
can be used as a “neutral standard,” and the ratio of underestimate the selection parameter.
polymorphism to divergence from the potentially se-Given the sometimes extreme bias in the
genic-selec-lected class (e.g., nonsynonymous sites) can be com-tion estimate of the seleccom-tion parameter, we require
TABLE 1
Simulated critical values for the likelihood-ratio test (LRT) of genic selection for different values of the selection parameter,
sample size, and observed number of segregating sites
95% critical Fraction rejected
␥ n S value assuming2
(1)
⫺4 25 100 3.54 0.04
1,000 4.23 0.061
10,000 4.06 0.056
50 100 3.81 0.049
1,000 4.04 0.054
10,000 3.78 0.048
4 25 100 3.64 0.045
1,000 3.89 0.052
10,000 3.86 0.051
50 100 3.78 0.048
1,000 3.83 0.050
10,000 4.15 0.065
20 25 100 3.86 0.051
1,000 3.94 0.053
10,000 3.42 0.033
50 100 3.52 0.039
1,000 3.91 0.051
10,000 3.65 0.044
Asymptotic likelihood theory predicts that the 95% critical value is 3.84. Also shown is the null rejection rate atP⫽0.05 under the asymptotic assumption that the LRT statistic is
chi-square distributed. Figure 5.—The simulated null distribution of the
likeli-hood-ratio test statistic for nongenic selection. The null hy-pothesis is no dominance (h ⫽ 0.5). The solid line is the asymptotic prediction for the null distribution. Null distribu-tions are shown for (a) weak negative selection with␥ ⫽ ⫺4 Because the McDonald-Kreitman test is based on an
and (b) weak positive selection with␥ ⫽4. observed standard for neutral evolution in the particular
population in question, it is fairly robust to demographic deviations from the equilibrium neutral model, such as
population subdivision or fluctuating population size parameters. These estimates, derived using the method
(McDonaldandKreitman1991;Akashi1999;Niel- of moments, are equivalent to the maximum-likelihood
sen2001). Therefore, results of a McDonald-Kreitman estimates (SawyerandHartl1992). Note that it is not test are often easier to interpret than those of many possible to estimate additional parameters, such as the other neutrality tests, such asTajima’s (1989)D-test and dominance parameter, from these types of data because,
FuandLi’s (1993) series of tests, which are sensitive to under genic selection, there are four equations and four demographic, as well as selective, forces (e.g.,Golding unknown parameters: the nonsynonymous and
synony-1997). mous nonlethal mutation rates, the divergence time,
The original McDonald-Kreitman test (McDonald and the selection parameter. Therefore, without prior
andKreitman1991) was devised as a 2⫻2 contingency knowledge of some of the parameters,
McDonald-Kreit-table analysis. As an alternative, Sawyer and Hartl man data contain no additional information regarding (1992) developed a maximum-likelihood framework for dominance.
analyzing polymorphism and divergence, which allows Even though it is not possible to estimate dominance the estimation of selection, mutation, and divergence parameters from McDonald-Kreitman data, we can still time parameters, as well as hypothesis testing. LetSn,Ss, investigate how dominance relations affect parameter
Figure 6.—Genic selection esti-mates of the selection parameter, ␥, obtained by simulating site-frequency spectra with varying degrees of domi-nance relations. Dashed lines indicate the true value of␥in the simulation; deviations from this line indicate bias. Error bars indicate 95% confidence limits on the maximum-likelihood esti-mate, and points marked with a star indicate that the mean maximum-like-lihood estimate was⬎100, the maxi-mum value allowed by our simulations. Simulations were performed withn⫽
25, conditional on the observed num-ber of segregating sites atS⫽10,000.
fixed values for the mutation rate and divergence time parameter. For instance, in the case of positive selection, (the divergence time is usually estimated from synony- an increase in the dominance parameter causes both an mous sites, and the mutation rate does not need to increase in the level of polymorphism and an increase in be estimated to estimate the selection parameter), we the fixation rate (Figure 8). If these effects roughly simulated nonsynonymous polymorphism and diver- cancel out in a ratio of polymorphism to divergence, gence data for several values of the selection and domi- then Sawyer and Hartl’s method would be insensitive nance parameters and then estimated the selection pa- to nongenic selection. The ratio of the expected num-rameter under genic selection. For each iteration, the ber of polymorphisms to the expected number of fixed number of nonsynonymous segregating sites was drawn differences is shown in Figure 9 for several different from a Poisson distribution with mean values of dominance parameter,h. Dominance relations have very little impact on the ratio of polymorphism to
冮
1 0(1⫺ qn⫺(1⫺ q)n)f(q;␥,h)dq (19)
divergence, which explains why we observe so little bias in the genic-selection estimate. Wakeley (2003) re-and the number of nonsynonymous fixed differences
cently demonstrated that, when applied to McDonald-was drawn from a Poisson distribution with mean
Kreitman data, Sawyer and Hartl’s method is robust to
D(,,␥,h)⫹ F(n,n;␥,h). (20) the assumption of random mating by applying an island model of population structure. Using simulations,
Wein-Given these simulated data, we estimated the selection
reichandRand(2000) demonstrated that
McDonald-parameter,␥, under genic selection by numerically
solv-Kreitman ratios—and, consequently, Sawyer and Hartl’s ing Equation 22 inSawyerandHartl(1992).
estimate of the selection parameter—are not sensitive to The bias inSawyerandHartl’s (1992) estimate of
dominance relations for a limited range of the dominance the selection parameter is shown in Figure 7 as a
func-parameter (0ⱕhⱕ1 in our notation, 0ⱕhⱕ2 in their tion of the degree of dominance. Surprisingly,
domi-notation). Our results indicate that this is also true of nance relations, including the case of weak
overdomi-weakly overdominant and underdominant mutations. nance, have very little impact on estimates of␥obtained
The effect of heterozygote advantage (h⬎1 for␥ ⬎ assuming genic selection. This is due to the fact that
0, or h ⬍ 0 for ␥ ⬍ 0) on McDonald-Kreitman data dominance has a similar effect on both polymorphism
deserves special attention. Heterozygote advantage is a and divergence. Conditional on the scaled divergence
special case of balancing selection, and its effect on time,, which is generally estimated from synonymous
polymorphism and divergence approximates the effect sites, Sawyer and Hartl’s estimate of the selection
param-of several other types param-of balancing selection (Wright
eter depends solely on the ratio of nonsynonymous
poly-and Dobzhansky1948; Denniston and Crow 1990;
morphism to divergence. Therefore, if dominance has
TakahataandNei1990). One might expect that
bal-a similbal-ar effect on polymorphism bal-and divergence, then
Figure8.—The substitution rate,u(␥,h), as a function of the strength of selection,␥ ⫽2Ns, for different values of the dominance parameter,h. Because the neutral substitution rate is 1, this plot also predicts the ratio of nonsynonymous to synonymous fixed differences,i.e., thedN/dSratio.
tage is fairly weak (h⫽1.3,␥ ⬎0 in Figure 9). As the strength of heterozygote advantage increases (i.e.,␥and
hincrease) and allele frequencies are more tightly main-tained at intermediate frequencies, this trend reverses because the level of polymorphism increases faster than the fixation rate (h ⫽2,␥ ⬎6 in Figure 9). However, we submit that McDonald-Kreitman tables provide infor-mation regarding balancing selection that is ambiguous at best—if heterozygote advantage is weak or moderate, then significant results could be interpreted as positive directional selection rather than balancing selection.
DISCUSSION
Dominance plays a very important role in a number of evolutionary phenomena at the heart of population genetics. For instance, a central controversy in evolu-tionary genetics has been the dispute over whether a balance between deleterious mutations and purifying selection can account for the bulk of genetic variation in fitness-related traits (e.g.,Lewontin1974). Alternative
Figure7.—Genic selection estimates of the selection
pa-explanations suggest that selection actively maintains rameter,␥, obtained by simulating polymorphism and
diver-genetic variation via frequency-dependent selection, gence data with varying degrees of dominance relations.
Dashed lines indicate the true value of␥ in the simulation. variation in selection intensity over time and space, het-Note that, for␥ ⫽ ⫺5, the estimate␥ˆ is biased even in the erozygote advantage, or other higher-order processes. case of genic selection because we conditioned on observing
Theoretical models of deleterious mutation/purifying at least one segregating site and one fixed difference in the
selection balance depend primarily on the deleterious sample. For each simulation, the divergence time,, was fixed
mutation rate and the product of the selection and at ⫽10,n⫽25, and ⫽50. Error bars indicate the 95%
confidence limits of␥ˆ. dominance parameters (e.g.,CharlesworthandHughes 2000). Therefore, assessing the validity of the deleteri-ous mutation hypothesis will require characterizing nonsynonymous polymorphism to divergence because both selection and dominance at the level of the entire balancing selection actively maintains polymorphisms. genome.
advan-In this article we have made the somewhat artificial assumption that all new mutations have the same fitness effect. An obvious extension to this method is to allow variable fitness and dominance effects by assuming that the effects of each new mutation are drawn from some bivariate distribution and then integrating over all possi-ble fitness and dominance effects to arrive at predictions for the stationary distribution of allele frequency. This approach is computationally challenging because it
re-Figure9.—The log-transformed ratio of the expected num- quires numerically evaluating complicated
four-dimen-ber of polymorphisms to the expected numfour-dimen-ber of fixed
differ-sional integrals during each evaluation of the likelihood ences as a function of the selection parameter,␥, for several
function. We have also assumed high levels of recombi-different values of the dominance parameter,h. The ratio is
nation between sites. This assumption may be appro-plotted relative to the ratio under neutrality (E[Sn]/E[Dn]⫽
1 at␥ ⫽0). priate for SNPs distributed across a genome, but it does
not apply to small regions with limited or no recombina-tion such as single protein-coding genes or animal mito-their frequency profile. For instance, we have shown
chondrial genomes. It may be possible to address this that nongenic selection can strongly bias estimates of
problem using a composite-likelihood approach (
Hud-the selection parameter that are based on Hud-the
site-fre-son2001). quency spectrum. To address whether the apparent
sig-We thank J. F. Crow, J. K. Kelly, and R. Nielsen for very helpful
nal of weak purifying selection is actually due to more
discussions and suggestions. Two anonymous reviewers greatly
im-deleterious, but recessive, mutations, it will be necessary proved the manuscript. This research was conducted using the re-to quantify both selection and dominance parameters. sources of the Cornell Theory Center, which receives funding from
The analyses presented here are a first step toward that Cornell University, New York State, federal agencies, foundations, and corporate partners. C.D.B. is supported by a U.S. Department of
goal.
Agriculture-HATCH grant (NYC-151411) and National Science
Foun-At the level of the phenotype, two independent lines
dation grant 0319553.
of evidence suggest that dominance plays an important role in shaping polymorphism and divergence in fitness-related traits. The first line of evidence is the simple
LITERATURE CITED observation of inbreeding depression,i.e., the reduction
in offspring fitness due to inbreeding. The two leading Akashi, H., 1999 Inferring the fitness effects of DNA mutations from polymorphism and divergence data: statistical power to
explanations of inbreeding depression are: (1) Fitness
detect directional selection under stationarity and free
recombi-is reduced because inbreeding “unmasks” deleterious nation. Genetics151:221–238.
Bustamante, C. D., J. Wakeley, S. A. SawyerandD. L. Hartl, 2001
recessives, and (2) fitness is reduced because fewer
over-Directional selection and the site-frequency spectrum. Genetics
dominant loci occur in the heterozygous state (see
159:1779–1788.
LynchandWalsh 1998, Chap. 10 for an overview of Bustamante, C. D., R. Nielsen, S. A. Sawyer, K. M. Olsen, M. D.
Puruggananet al., 2002 The cost of inbreeding: fixation of
the two hypotheses). Both explanations are based on
deleterious genes inArabidopsis.Nature416:531–534.
dominance relations among segregating, nonneutral
al-Bustamante, C. D., R. NielsenandD. L. Hartl, 2003 Maximum
leles at many loci. The second line of evidence comes likelihood and Bayesian methods for estimating the distribution
of selective effects among classes of mutations using DNA
poly-from speciation genetics: Growing consensus supports
morphism data. Theor. Popul. Biol.63:91–103.
the dominance theory (Muller1942;TurelliandOrr
Charlesworth, B., andK. A. Hughes, 2000 The maintenance of
1995) of Haldane’s rule (Haldane1922; Orr 1997). genetic variation in life-history traits, pp. 369–392 inEvolutionary Genetics: From Molecules to Morphology, edited by R. S.Singhand
Haldane’s rule is an observation from studies of
postzy-C. B.Krimbas. Cambridge University Press, Cambridge, UK.
gotic isolation between species with chromosomal sex
Cherry, J. L., 2003 Selection in a subdivided population with
domi-determination. It states that, in hybrid crosses between nance or local frequency dependence. Genetics163:1511–1518. Cherry, J. L., 2004 Selection, subdivision and extinction and
recolo-species, if only one sex is inviable or infertile, it will be
nization. Genetics166:1105–1114.
the heterogametic sex. Recent analyses (Turelli and
Crow, J. F., 1993 Mutation, mean fitness, and genetic load, pp. 3–42
Begun1997;PresgravesandOrr1998) strongly sup- inOxford Surveys in Evolutionary Biology, Vol. 9, edited by D. J.
Futuymaand J.Antonovics. Oxford University Press, Oxford.
port the hypothesis that Haldane’s rule is due to
domi-Crow, J. F., andM. J. Simmons, 1983 The mutation load in Drosoph-nance relations in sex-chromosome-linked “speciation
ila, pp. 1–35 inThe Genetics and Biology of Drosophila, Vol. 3c, edited
genes,” i.e., genes at which fixed differences between by M.Ashburner, H. L.Carsonand J. N.Thompson. Academic
Press, New York.
lineages contribute to postzygotic isolation. Given the
Denniston, C., andJ. F. Crow, 1990 Alternative fitness models with
importance of dominance in shaping both
polymor-the same allele frequency dynamics. Genetics125:201–205.
phism and divergence at the phenotypic level, and given Ewens, W. J., 1974 A note on the sampling theory for infinite alleles
and infinite sites models. Theor. Popul. Biol.6:143–148.
Fisher, R. A., 1922 On the dominance ratio. Proc. R. Soc. Edinb. Orr, H. A., 1997 Haldane’s rule. Annu. Rev. Ecol. Syst.28:195–218.
50:205–220. Presgraves, D. C., andH. A. Orr, 1998 Haldane’s rule in species
Fisher, R. A., 1930 The Genetical Theory of Natural Selection. Clarendon lacking a hemizygous X. Science282:952–954.
Press, Oxford. Press, W. H., B. P.Flannery, S. A.Teukolskyand W. T.Vatterling,
Fu, Y.-X., andW.-H. Li, 1993 Statistical tests of neutrality of muta- 1988 Numerical Recipes in C. Cambridge University Press,
Cam-tions. Genetics133:693–709. bridge, UK.
Golding, G. B., 1997 The effect of purifying selection on genealo- Roze, D., andF. Rousset, 2003 Selection and drift in subdivided gies, pp. 271–285 inProgress in Population Genetics and Human populations: a straightforward method for deriving diffusion ap-Evolution(IMA Volumes in Mathematics and Its Applications, proximations and applications involving dominance, selfing and Vol. 87), edited by P.Donnellyand S.Tavare. Springer, New local extinctions. Genetics165:2153–2166.
York. Sawyer, S. A., andD. L. Hartl, 1992 Population genetics of
poly-Griffiths, R. C., 2003 The frequency spectrum of a mutation, and morphism and divergence. Genetics132:1161–1176.
its age, in a general diffusion model. Theor. Popul. Biol. 64: Simmons, M. J., andJ. F. Crow, 1977 Mutations affecting fitness in
241–251. Drosophilapopulations. Annu. Rev. Genet.11:49–78.
Haldane, J. B. S., 1922 Sex ratio and unisexual sterility in animal Tajima, F., 1989 Statistical method for testing the neutral mutation hybrids. J. Genet.12:101–109. hypothesis by DNA polymorphism. Genetics123:585–595.
Haldane, J. B. S., 1926 A mathematical theory of natural and artifi- Takahata, N., andM. Nei, 1990 Allelic genealogy under overdomi-cial selection. Part III. Proc. Camb. Philos. Soc.23:363–372. nant and frequency-dependent selection and polymorphism of
Hartl, D. L., E. N. MoriyamaandS. A. Sawyer, 1994 Selection major histocompatibility complex loci. Genetics124:967–978. intensity for codon bias. Genetics138:227–234. Turelli, M., andD. J. Begun, 1997 Haldane’s rule and
X-chromo-Hudson, R. R., 2001 Two-locus sampling distributions and their some size inDrosophila.Genetics147:1799–1815. application. Genetics159:1805–1817.
Turelli, M., andH. A. Orr, 1995 The dominance theory of
Hal-Kacser, H., andJ. A. Burns, 1981 The molecular basis of domi- dane’s rule. Genetics140:389–402. nance. Genetics97:639–666.
Wakeley, J., 2003 Polymorphism and divergence for island-model
Kelly, J. K., 2003 Deleterious mutations and the genetic variance
species. Genetics163:411–420. of male fitness components inMimulus guttatus.Genetics164:
Watterson, G. A., 1975 On the number of segregating sites in 1071–1085.
genetical models without recombination. Theor. Popul. Biol.7:
Kendall, M. G., andA. Stuart, 1973 The Advanced Theory of Statistics,
256–276. Vol. 2: Inference and Relationship. Charles Griffin & Co., London.
Weinreich, D. M.,andD. M. Rand,2000 Contrasting patterns of
Kimura, M., 1964 Diffusion models in population genetics. J. Appl.
nonneutral evolution in proteins encoded in nuclear and mito-Prob.1:177–232.
chondrial genomes. Genetics156:385–399.
Kimura, M., 1968 Evolutionary rate at the molecular level. Nature
Whitlock, M. C., 2003 Fixation probability and time in subdivided
217:624–626.
populations. Genetics164:767–779.
Kimura, M., 1971 Theoretical foundation of population genetics at
Willis, J. H., 1999 Inbreeding load, average dominance, and the the molecular level. Theor. Popul. Biol.2:174–208.
mutation rate for mildly deleterious alleles inMimulus guttatus. Lewontin, R. C., 1974 The Genetic Basis of Evolutionary Change.
Co-Genetics153:1885–1898. lumbia University Press, New York.
Wright, S., 1931 Evolution in Mendelian populations. Genetics16:
Lynch, M., andB. Walsh, 1998 Genetics and Analysis of Quantitative
97–159. Traits. Sinauer Associates, Sunderland, MA.
McDonald, J. H., andM. Kreitman, 1991 Adaptive protein evolu- Wright, S., 1938 The distribution of gene frequencies under irre-tion at theAdhlocus inDrosophila.Nature351:652–654. versible mutation. Proc. Natl. Acad. Sci. USA24:253–259.
Muller, H. J., 1942 Isolating mechanisms, evolution, and tempera- Wright, S., andT. Dobzhansky, 1948 Genetics of natural popula-ture. Biol. Symp.6:71–125. tions. XII. Experimental reproduction of some of the changes
Nielsen, R., 2001 Statistical tests of selective neutrality in the age caused by natural selection in certain populations ofDrosophila of genomics. Heredity86:641–647. pseudoobscura.Genetics31:125–156.
Ohta, T., 1992 The nearly neutral theory of molecular evolution.
Annu. Rev. Ecol. Syst.23:263–286. Communicating editor: J. B.Walsh
APPENDIX
To evaluate the first and second derivatives of the stationary distribution,f, we apply the product rule from calculus several times and exchange the order of integration and derivation when necessary. The first derivatives in␥and
h are then
␥{f(q;␥,h)}⫽
u␥(q;␥,h)
q(1⫺ q)
冮
1qv(;␥,h)d
冮
1 0v(;␥,h)d⫹
u(q;␥,h)
q(1⫺q)
冢
冮
1qv␥(;␥,h)d
冮
1 0v(;␥,h)d ⫺
冮
10v␥(;␥,h)d
冮
1qv(;␥,h)d
关
冮
10
v(;␥,h)d
兴
2冣
(A1a)
h{f(q;␥,h)}⫽
uh(q;␥,h)
q(1⫺q)
冮
1qv(;␥,h)d
冮
1 0v(;␥,h)d⫹
u(q;␥,h)
q(1⫺ q)
冢
冮
1qvh(;␥,h)d
冮
1 0v(;␥,h)d ⫺
冮
10vh(;␥,h)d
冮
1qv(;␥,h)d
关
冮
10
v(;␥,h)d
兴
2冣
, (A1b)where
u(q;␥,h)⫽ e4␥hq⫹2␥(1⫺2h)q2
(A2a)
v(q;␥,h)⫽ e⫺4␥hq⫺2␥(1⫺2h)q2
. (A2b)
(A3a)
(A3b)