DOI: 10.1534/genetics.106.065557
Background Selection in Single Genes May Explain Patterns of Codon Bias
Laurence Loewe
1and Brian Charlesworth
Institute of Evolutionary Biology, School of Biological Sciences, University of Edinburgh, Edinburgh EH9 3JT, United Kingdom
Manuscript received September 1, 2006 Accepted for publication December 23, 2006
ABSTRACT
Background selection involves the reduction in effective population size caused by the removal of recurrent deleterious mutations from a population. Previous work has examined this process for large genomic regions. Here we focus on the level of a single gene or small group of genes and investigate how the effects of background selection caused by nonsynonymous mutations are influenced by the lengths of coding sequences, the number and length of introns, intergenic distances, neighboring genes, mutation rate, and recombination rate. We generate our predictions from estimates of the distribution of the fitness effects of nonsynonymous mutations, obtained from DNA sequence diversity data in Drosophila. Results for genes in regions with typical frequencies of crossing over in Drosophila melanogaster suggest that background selection may influence the effective population sizes of different regions of the same gene, consistent with observed differences in codon usage bias along genes. It may also help to cause the observed effects of gene length and introns on codon usage. Gene conversion plays a crucial role in determining the sizes of these effects. The model overpredicts the effects of background selection with large groups of nonrecombining genes, because it ignores Hill–Robertson interference among the mutations involved.
I
T has been known for a long time that selection at one site in the genome influences the evolutionary fate of variants at linked sites (Fisher 1930; Muller1932; Hill and Robertson 1966; Felsenstein 1974; Birky and Walsh 1988; Gordo and Charlesworth 2001). Such effects are expected to be particularly strong in re-gions of the genome with low levels of crossing over, but normal gene densities. Consistent with this, there are as-sociations between low recombination rates and reduced levels of silent nucleotide site diversity in Drosophila (Begunand Aquadro1992; Presgraves2005; Bierne and Eyre-Walker 2006). This has stimulated interest in understanding the forces that influence patterns of diversity along chromosomes, with particular attention having been paid to two extreme alternatives: selective sweeps (MaynardSmithand Haigh1974; Begunand Aquadro 1992; Betancourt and Presgraves 2002; Kim 2004; Presgraves 2005; Stephan et al. 2006) and background selection (Charlesworthet al. 1993, 1995; Hudsonand Kaplan1995; Charlesworth1996; Nordborg et al. 1996). These factors can usefully be thought of as causing a reduction in effective population size,Ne, leading to reduced genetic diversity (Kimura 1983).In addition, a higher level of nonsynonymous diver-gence in a gene between Drosophila species is
corre-lated with a lower frequency of optimal codons (fop) (Betancourt and Presgraves 2002; Marais et al. 2004; Bierneand Eyre-Walker2006). To explain this in terms of selective sweeps, Kim(2004) modeled the effect of the spread of selectively favorable amino acid mutations on Nefor the gene in which they occur. In addition, interference among weakly selected sites may also reduce the efficacy of selection at such sites, as measured byNes, wheresdenotes the relevant selection coefficient (Li1987; Come´ ronet al. 1999; McVeanand Charlesworth 2000; Tachida 2000; Come´ ron and Kreitman2002). Such interference has been proposed as an explanation of patterns in the inferred intensity of selection on codon bias within genes of Drosophila. As discovered from whole-genome analyses, less frequent use of optimal codons (i.e., lower codon usage bias) is found in the middle of genes that lack introns, in long genes, and in regions of low recombination (Come´ ron
et al. 1999; Come´ ron and Kreitman 2000, 2002; Qin
et al. 2004).
Background selection causes a similar reduction in Ne, by the removal of weakly selected or neutral vari-ants at sites that are closely linked to sites under pu-rifying selection. When deleterious mutations at the latter sites have Nes. 1, they can be treated as effec-tively close to equilibrium under mutation–selection balance and contribute to background selection effects (Charlesworth et al. 1993, 1995; Nordborg et al. 1996). Recent results suggest that most amino acid mu-tations in Drosophila are sufficiently deleterious to fall into this category (Loewe and Charlesworth 2006;
1Corresponding author: Institute of Evolutionary Biology, School of
Biological Sciences, Ashworth Laboratories, University of Edinburgh, King’s Bldgs., W. Mains Rd., Edinburgh EH9 3JT, United Kingdom. E-mail: [email protected]
Loewe et al. 2006); these are so abundant that they may exert significant effects on sites within the same or neighboring genes.
The basis for this can be understood as follows. Published data on autosomal DNA sequence polymor-phisms in regions with normal recombination rates in African populations of Drosophila melanogaster yield a mean nonsynonymous nucleotide site diversity of0.3% (B. Vicoso, personal communication). With a mean of 1333 nonsynonymous sites per gene (Misra et al. 2002), this implies an average of 13333 0.003/2 2 amino acid variants per gene. Even if as few as 50% of these have Nes . 1, then each gene would carry an average of close to one effectively deleterious muta-tion. In the absence of recombination, Equation 4 of Charlesworthet al. (1993) shows thatNeis then re-duced to 37% of its maximal value. This suggests that there may be enough deleterious amino acid variants in Drosophila genes to cause significant background se-lection on closely linked sites, even in the presence of recombination. This reflects the weak selection coef-ficients for most amino acid mutations inferred from polymorphism studies (Loewe and Charlesworth 2006; Loeweet al. 2006). Earlier models of background selection assumed stronger selection that leads to less frequent, but more deleterious, variants, on the basis of estimates of the fitness effects of mutations from mutation-accumulation lines (Hudson and Kaplan 1995; Charlesworth1996).
We use theoretical predictions of the effects of back-ground selection on neutral diversity, which allow arbi-trary levels of recombination to be modeled (Hudson and Kaplan1995; Nordborget al. 1996). The theory has been extended to include the effects of background selection on fixation probabilities of weakly selected mu-tations linked to sites under strong selection (Stephan
et al. 1999; unpublished results of M. Nordborg, per-sonal communication). This enables the prediction of codon usage bias, from standard results on mutation– selection–drift equilibrium (Li 1987; Bulmer 1991; McVeanand Charlesworth1999). We can thus com-bine a set of mutation rates and fitness effects with an arbitrary recombinational landscape, for the purpose of predicting the effects of background selection for each point in the landscape.
In the past, such efforts have focused mainly on whole chromosomes to examine whether background selec-tion can explain the relaselec-tion between local recombi-nation rate and nucleotide diversity for Drosophila (Hudson and Kaplan 1995; Charlesworth 1996) and for humans (Payseur and Nachman 2002a,b; Reedet al. 2005). It was tacitly assumed that background selection at the level of a single gene is negligible. Since gene conversion acts only over short distances, it was also ignored in these studies. While the question of the pattern of chromosomewide variability is important, this article has a quite different goal. We explore whether
background selection can cause the patterns of codon bias mentioned above, by predicting the reduction ofNe due to background selection in single genes or in small groups of genes. We investigate the effects of various parameters, including rates of recombination caused by both crossing over and gene conversion, mutation rates, selection coefficients, and gene structure (introns, in-tergenic distances, and numbers of neighboring genes). All the parameters are chosen as being realistic for D. melanogaster. The results show that background selection may play a significant role in shaping the observed patterns of codon usage bias.
METHODS
Basic model: A detailed description of the model is given by Nordborget al. (1996). The main feature of the version developed here is a gene withlbp of coding sequence, where nonsynonymous mutations (occurring only in the first two sites of a triplet of bases, i.e., a codon) have a deleterious heterozygous selection co-efficient,s, assigned from previous estimates of the dis-tribution ofs(Loeweand Charlesworth2006; Loewe
et al. 2006). Selection on the third site in each codon is assumed to be negligibly weak compared with selection on the first two sites; variability and adaptation for syn-onymous mutations at such a site are then controlled by the variable B ¼Ne/N0, where N0 and Ne are the effective population sizes in the absence and presence of background selection, respectively. Ignoring the pres-sure of selection on nonsynonymous mutations at two-and threefold degenerate third positions means that we slightly underestimate the effects of background selection, since we assume that 66.7% of all 576 pos-sible point mutations in all codons are nonsynonymous, whereas the genetic code predicts that 68.6% of all possible point mutations are nonsynonymous, ignoring stop codons.
The strongly selected sites are assumed to be in mutation–selection equilibrium, so that qi, the fre-quency of the deleterious allele at sitei, is given by
qi ui
si
; ð1Þ
where ui is the mutation rate per generation at sitei from wild type to mutant (Haldane1927).
B for the weakly selected (synonymous) site under consideration (the ‘‘focal site’’) is then equal to
B¼Ne
N0
exp X
i
ui
sið11ð1siÞri=siÞ2
( )
; ð2Þ
predict the reduction in neutral variability caused by background selection (Nordborget al. 1996).
A study of the effect of background selection due to a single site subject to mutation and selection (Stephan
et al. 1999) showed that the fixation probabilities of mu-tations at a weakly selected linked site can be predicted by substituting the value ofNefrom Equation 2 into the standard formula for fixation probability for a single locus (Kimura1962). Simulations have confirmed that this result also applies to a large number of strongly selected, linked sites, each subject to mutation and se-lection (M. Nordborg, personal communication). The level of adaptation at weakly selected, synonymous sites, measured by the frequency of preferred codons at statis-tical equilibrium under mutation, drift, and selection, is determined by these fixation probabilities (Li1987; Bulmer1991; McVeanand Charlesworth1999).
There are, however, conditions on the validity of Equation 2 that need to be considered. First, use of Equation 1 requiresNesi.1. This does not necessarily mean that the population is at equilibrium, but implies that the mean allele frequency over the distribution gen-erated by selection, mutation, and drift is well approx-imated by Equation 1, assuming semidominant effects of mutations on fitness (McVeanand Charlesworth 1999). Thus the mean frequency over a group of var-iants subject to selection is given by Equation 1, so that the formula works well in practice (Nordborg et al. 1996). Second, if selection against deleterious muta-tions is very weak, there is a significant probability of fixation of a mutation at a weakly selected site in sit-uations when the mutation is linked to a deleterious variant that is drifting to high frequencies or fixation; such cases are ignored in Equation 2. Use of Equations 5 and 6 in the Appendix to Charlesworthet al. (1993) for the case of no recombination shows that this effect will be small if the fixation probability of a deleterious mutation can be neglected relative to the neutral value, as is the case if Nesi . 1 (Kimura 1983, pp. 43–46). Third, if there is tight linkage among a group of del-eterious mutations, Hill–Robertson effects among them undermine the effectiveness of selection, and Equation 2 overestimates the reduction in Ne(Charlesworth
et al. 1993; Nordborg et al. 1996). For these reasons, we removed from consideration any sites for which Nesi#1 and restricted ourselves mostly to small groups of genes with nonzero levels of gene conversion. To produce our results, we computedBeither for all synon-ymous sites in the focal gene or for 200 evenly distrib-uted synonymous sites in the gene (to save computing time). To condense this into a single value of B for each gene, we computed the arithmetic mean over all synonymous sites for use in some of our plots.
Modeling gene structure and gene conversion: To incorporate gene structure into Equation 2 requires only specification of the recombination rates,ri, if we assume a constant mutation rate and selection
coeffi-cient across the gene. Our basic approach was to mea-sure the molecular distancedibetween the synonymous focal site and the selected site iwhile walking over all sites between them. Whenever nonselected sites were encountered,diwas increased accordingly, without in-creasing the sum in Equation 2. Three types of se-quences affectdiin this way: synonymous sites, introns, and intergenic regions. Although our computer code is flexible, we assumed that all neighboring genes had the same structure (2000 bp in exons; four introns of 100 bp), independent of that of the focal gene. For a given number of introns, thelbp of the exon sequence were divided into a corresponding number of equally long exons.
To convertdiintori, we used Equation 1 of Frisseet al. (2001), which assumes a mixture of reciprocal crossing over and gene conversion with an exponential distribu-tion of tract lengths. This gives the net recombinadistribu-tion rate between the focal site and siteias
ri¼dirc12rgð1expðdi=dgÞÞ; ð3Þ
where rc is the probability of a reciprocal crossover between two bases,dgis the mean tract length of a gene conversion event, and rg is the probability of gene conversion at a particular site (the product of dgand the probability of initiating a gene conversion at a given site). This formula is more exact than that of Andolfattoand Nordborg(1998) and is equivalent to those of Wiufand Hein(2000) and Langleyet al. (2000). It neglects the reduction in ri from double crossovers over large chromosomal distances, which are not the focus of our study.
Modeling the distribution of deleterious mutational effects (DDME) on fitness: We assumed that the dis-tribution of heterozygous selection coefficients against deleterious mutations follows a lognormal distribution (Aitchisonand Brown1957; Crow1988), since this distribution has proved useful for estimating mutational effects in Drosophila (Loewe and Charlesworth 2006). It is characterized by ‘‘shape’’ and ‘‘location’’ pa-rameters,sgandmg, which correspond to the exponen-tials of the standard deviation and mean of the natural logarithm of the variate, respectively (Limpert et al. 2001). Unfortunately it is not possible to estimate the DDME inD. melanogasterby this method without mak-ing several assumptions. We therefore used estimates from D. miranda and D. pseudoobscura (Loewe and Charlesworth2006) to choose plausible DDMEs, on the basis of the requirement that these be compatible with the diversity data for both species and also predict a realistic number of dominant, effectively lethal, mu-tations (Loeweand Charlesworth2006).
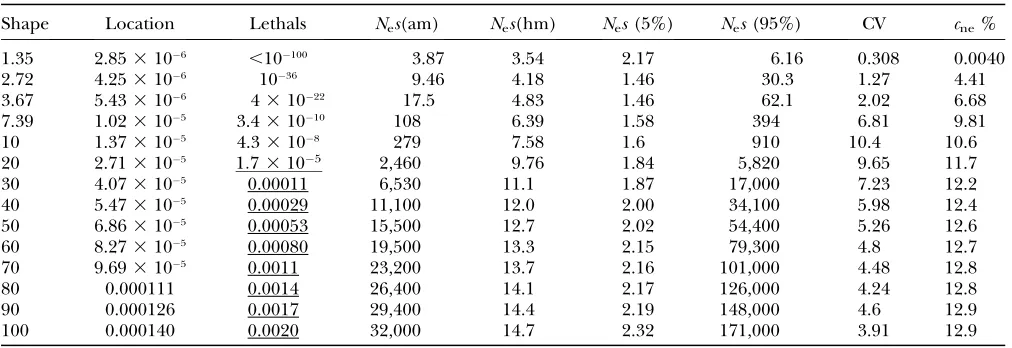
autosomal genes in high-recombination regions of Afri-can populations of D. melanogaster. Means with 90% confidence intervals (from a metaanalysis of published data) were kindly provided by Beatriz Vicoso: pA ¼ 0.295% (0.166–0.560%) andpS¼2.07% (1.67–2.59%), on the basis of 17 loci weighted by the inverses of their expected sampling variances (Bartolome´ et al. 2005). The location parameter for an assumed shape parame-ter was obtained by equating observed and expected values ofpA/pS, in a similar way to the procedure of Loeweand Charlesworth(2006). Key parameters of the resulting DDMEs are given in Table 1.
We included the DDME in our computations of back-ground selection by constructing an array that con-tained all deleterious sites to be considered for one computation ofB. Then mutational effects were ran-domly drawn for each site, using the parameters of an estimated lognormal DDME, and stored while B was computed for all neutral sites considered in the focal gene. To average over the large amount of noise, we repeated the procedure 100 times and finally used the arithmetic mean ofBfor each site from these repeats. This is equivalent to averaging sequence data over 100 different genes, similar to the approach of Come´ ron
et al. (1999; Come´ ronand Kreitman2000, 2002). Since most DDMEs included a significant probability mass in the effectively neutral area (Nes # 1.0), a significant number of nonsynonymous sites are nearly neutral and are thus omitted from the calculations. This makes our DDME-based estimates of B slightly over-estimate the true value.
Plausible parameter combinations forD. melanogaster:
We chose our parameters to reflect the properties of autosomal genes inD. melanogaster. Nucleotide site mu-tation rate estimates (u ¼5.8 3 109/bp/generation, with 95% confidence interval 2.1 3 109–1.31 3 108) have been obtained from a mutation-detection screen of mutation-accumulation experiments (Haag -Liautardet al. 2007). To cover a range of mutation rates across the genome, we used mutation rates of 23109, 43109, and 83109, respectively, in the calculations described in results. If we combine these with the mean synonymous diversity at autosomal loci in high-recombination regions from African populations (see above),Ne1.33106, with a range from 0.653106to 2.63106, corresponding to the upper and lower limits for the mutation rates that we use. Our results agree with other estimates that suggest a recent Ne of 106 (Moriyama and Powell 1996; McVean and Vieira 2001). Estimates of the parameters of the DDME as-sumed a ‘‘standard’’ mutation rate of 43109. Previous work suggests that the estimates of the shape of the DDME and the product ofNeand location parameter are not very sensitive to the mutation rate (Loeweet al. 2006).
We assumed crossing-over rates of recombining genes that ranged from rc ¼ 1 3 109 to 3 3 108, with a mean of13108/bp/generation (Betancourtand Presgraves2002; Hey and Kliman 2002), averaging over therc-values for females and males (which do not cross over). Unless otherwise stated, all computations as-sumed a gene conversion frequency per site (corrected
TABLE 1
Estimates of the DDME forD. melanogaster
Shape Location Lethals Nes(am) Nes(hm) Nes(5%) Nes(95%) CV cne%
1.35 2.853106 ,10100 3.87 3.54 2.17 6.16 0.308 0.0040
2.72 4.253106 1036 9.46 4.18 1.46 30.3 1.27 4.41
3.67 5.433106 431022 17.5 4.83 1.46 62.1 2.02 6.68
7.39 1.023105 3.431010 108 6.39 1.58 394 6.81 9.81
10 1.373105 4.33108 279 7.58 1.6 910 10.4 10.6
20 2.713105 1:73105 2,460 9.76 1.84 5,820 9.65 11.7
30 4.073105 0.00011 6,530 11.1 1.87 17,000 7.23 12.2
40 5.473105 0.00029 11,100 12.0 2.00 34,100 5.98 12.4
50 6.863105 0.00053 15,500 12.7 2.02 54,400 5.26 12.6
60 8.273105 0.00080 19,500 13.3 2.15 79,300 4.8 12.7
70 9.693105 0.0011 23,200 13.7 2.16 101,000 4.48 12.8
80 0.000111 0.0014 26,400 14.1 2.17 126,000 4.24 12.8
90 0.000126 0.0017 29,400 14.4 2.19 148,000 4.6 12.9
100 0.000140 0.0020 32,000 14.7 2.32 171,000 3.91 12.9
All estimates are consistent with diversity data fromD. melanogaster. The values underlined, for the predicted frequencies of ef-fectively lethal, dominant mutations, are consistent with genetic data (105–0.004/zygote/generation; see Loeweand C
harles-worth2006). Columns denote the shape,sg, and location,mg, of the assumed lognormal DDME; the number of dominant,
effectively lethal mutations per genome per generation predicted by the DDME; the arithmetic (am) and harmonic (hm) mean selection coefficient multiplied byNe(averaged over the truncated DDME, including all nonneutral, nonlethal mutations); the lower (5%) and upper (95%) 5% percentiles of the truncated DDME; the coefficient of variation of the truncated DDME; and
for the lack of events in males) ofrg¼0.253105, on the basis of the mean of estimates from the rosy locus (Hilliker and Chovnick 1981), and a mean tract length of 352 bp (Hillikeret al. 1994).
Gene structures were estimated from the third re-lease of theD. melanogastergenome (Misraet al. 2002; FlyBase 2006). The average length of the sum of all exons in a gene is 2078 bp (27.8 Mb total sequence in exons/13,379 protein-coding genes; Misraet al. 2002), with extremes ranging from 63 to 15,603 bp (Adams
et al. 2000). The typical gene has 3.6 introns (48,257 introns/13,379 protein-coding genes; Misra et al. 2002). Most introns have a length between 59 and 63 bp (Mountet al. 1992), but extremes range from 40 bp to.70 kb (Adamset al. 2000). Intergenic distances are 6.2 kb on average [subtracting 4 introns of 100 bp from (116.8 Mbp total euchromatin 27.8 Mb all exons)/13,379 protein coding genes] (Misra et al. 2002). However, gene densities vary from 1/50 kbp to 30/50 kbp (Adamset al. 2000), so that the intergenic distance could be as little as 500 bp in dense gene clus-ters. We chose our ‘‘standard setup’’ to resemble these findings, by assuming that a typical gene has 2000 bp of exons, 4 introns of 100 bp, and a distance of 6 kb between genes. The possible effects of neighboring genes are ignored, except where specifically mentioned. We assume that two-thirds of sites are nonsynonymous, i.e., 1333 per gene. Mutations to stop codons were ig-nored. Deviations from this standard setting are men-tioned explicitly.
The DDME estimates are shown in Table 1. In com-putations that assumed constant selection coefficients, we used the harmonic mean heterozygous selection coefficient,sh, estimated from a DDME with a width of
sg¼50. This givesNesh12.7 andcne12.6%, where cneis the fraction of effectively neutral nonsynonymous mutations (for whichNes#1).shcan be shown to be the dominant term in a Taylor series expansion of Equation 2 for low recombination rates, when there is a distribu-tion ofs-values, which provides a justification for using shin Equation 2 as an approximation. This requires a correction for the presence of effectively neutral muta-tions among the nonsynonymous mutamuta-tions. We there-fore multiplied the overall mutation rate by a factor of 1cneto obtain the mutation rate used in Equation 2.
Computations:The model described above was imple-mented using the statistical script programming lan-guage R (Ihakaand Gentleman 1996; Maindonald and Braun 2002), which can be freely downloaded from http://www.r-project.org/. All core functionality was contained in a function ‘‘FopBgs,’’ which takes all pos-sible input parameters and returns a list that contains all potentially informative results. FopBgs was tested by monitoring key parameters while stepping through the important parts of the code and by comparing results with analytical results, for the case with no recombina-tion and for an approximarecombina-tion for the case of crossing
over with no gene conversion (Equation 9 of Nordborg
et al. 1996).
RESULTS
Edges of exons experience less background selec-tion:Figure 1 shows the pattern ofB-values across genes with the standard structure described above, assuming a fixed selection coefficient. Figure 1A shows the effect of varying the rate of gene conversion, rg, with standard mutation and crossover rates. Gene conversion reduces the overall effects of background selection, as would be Figure1.—Background selection in a single gene with the
fixed selection coefficient approximation, showing the effects of gene conversion and mutation rates with a crossover rate of 108. The selection coefficientswas set equal to the harmonic mean heterozygous selection coefficient, estimated from a DDME with a width ofsg¼50, which gives anNesvalue of
12.7 and a frequency of effectively neutral mutations, cne, of 12.6%. All curves are paired, with the bottom curve repre-senting the coding sequence of a gene without introns and the top curve that of a gene with four equidistant introns. (A) Different gene conversion rates for u¼ 43109; pairs of solid lines from top to bottom are for rg ¼53106, 2.5
expected from its major role in intragenic recombina-tion in Drosophila (Hilliker and Chovnick 1981). The edges of a gene experience less background se-lection, as would be expected from the lower density of deleterious sites that they experience—see the discus-sion following Equations 9 and 10 in Nordborget al. (1996). The same principle applies to the boundaries of introns. These effects generate aU-shaped pattern forB within each exon. We also found that gene conversion alone, without any reciprocal crossing over, can produce patterns similar to those shown here (data not shown). The presence of introns has a small but notable effect on the meanBfor a gene, reflecting the increased re-combination rate among the sites contributing to back-ground selection.
Figure 1B shows the effect of varying the mutation rate, for standard selection and recombination param-eters. As would be expected from the exponential dependence ofBon mutation rate (Equation 2), a high mutation rate greatly increases the effect of background selection. This gives some insight into the expected patterns of differences between genes caused by differ-ent mutation rates, assuming fixed selection and re-combination parameters (the standard mutation rate was used to estimateNeand the parameters of the DDME in these cases).
An important question is the sensitivity of these results to the assumption of constant selection coeffi-cients. Figure 2, A and B, shows the same plots as Figure 1, A and B, but with a DDME of widthsg¼50, averaged over 100 genes, instead of a fixed selection coefficient. Together with the results for other DDMEs (data not shown), this suggests that the general nature of the patterns within genes is robust to the distribution ofs, but that the overall effects of background selection are reduced by a wide distribution. The effects of introns and gene boundaries seem to be slightly more pro-nounced with a wider DDME, but the reduction inBin the center of genes is smaller.
The effects of exon and intron lengths: Figure 3 shows that the effect of background selection increases with exon length in genes with no introns and no neighbors. The effect is especially large for a high mutation rate and low rate of crossing over and is quite small (,10%) for the standard recombination and mu-tation rates combined with a realistic exon length and DDME (Figure 3B). Long genes with low crossing over and high or standard mutation rates suffer a consider-able reduction inB, since with low recombination there is a large effect of the number of nonsynonymous muta-tions, as explained in the Introduction. Figure 4 shows that longer introns reduce the mean effect of back-ground selection on a gene, although the effect levels off once introns become.1 kb, except with low recom-bination rates and high mutation rates.
The effects of numbers of neighbors and intergenic distance:The effect of increasing the number of
neigh-boring genes on the mean level of background selection over a gene is surprisingly small, unless the recombina-tion rate is very low or the mutarecombina-tion rate is high (Figure 5). This probably reflects the rather weak average s -values assumed here, which mean that a small amount of recombination is sufficient to remove the effects of linked genes (Equation 2). This result is encouraging, since it suggests that a quite accurate prediction of B can be obtained from our standard model with only five genes on each side of the focal gene, except in regions of low recombination. It also suggests that a substantial reduction in nucleotide site diversity and codon usage bias is expected in low- but non-zero recombination regions, even if they contain only a small number of genes, since B for the low crossing-over rate and the standard mutation rate asymptotes at about two-thirds of the high recombination value, in the presence of gene conversion at the standard rate (Figure 5B). With the standard mutation and recombination parameters, there is little effect beyond 10 genes on each side of the focal gene. With normal levels of recombination, the pattern of variation inNewithin a gene is affected little by the presence of neighboring genes (Figure 6). Figure 7 shows that regions where there is no crossing over Figure2.—Background selection in a single gene: average
show very large effects of the number of neighboring genes on the mean B for the focal gene, even in the presence of gene conversion.
As would be expected from the assumed lack of sites under strong purifying selection in intergenic regions, longer distances between genes (with five genes on each side of the focal gene) reduce the effect of background selection, and this effect is most marked with low recom-bination and a high mutation rate (Figure 8). Once again, however, the effect asymptotes beyond a certain distance,
6 kb for many typical parameter combinations.
The effects of the DDME width: To investigate the dependence ofBon the DDME, we computed the mean Bfor a single standard gene, assuming different widths of the DDME and corresponding estimates of the lo-cation parameter from Table 1. The results show that the width of the DDME has surprisingly small effects
(Figure 9), provided that it is large enough to be compatible with estimates of the rate of occurrence of dominant, effectively lethal mutations (Loewe and Charlesworth2006).
DISCUSSION
We focus on the relation between the theoretical predictions described above and data from genome analyses and population genetic studies of Drosophila.
Patterns of Ne within genes: Background selection caused by deleterious amino acid mutations within a sin-gle gene can reduce the effective population size experi-enced at linked neutral or nearly neutral sites (Figures 1 and 2). In addition, the dilution of background se-lection effects by recombination produces patterning along the gene ofB, the ratio ofNeat a given site to its value in the absence of background selection,N0. This is because intergenic and intron sequences are assumed
Figure3.—Longer exons experience more background
se-lection. Mean values ofB¼Ne/N0for a gene are shown, as-suming no neighboring genes, no introns, andrg ¼ 2.5 3 106. The thickness of the curves denotes the crossing-over rate (thick, 33108; medium, 13108; thin, 13109), line type represents the mutation rate (dotted, 23109; dashed, 43109; solid, 83109), and the highlighted curve indicates a typical gene (dashed line with medium thickness). (A) Fixed selection coefficient is as in Figure 1. (B) Average of 100 sam-ples from the DDME. The bottom three curves belong to the scale on the right.
Figure 4.—Longer introns reduce background selection.
for convenience to be neutral and hence do not con-tribute to background selection. This produces an in-crease inBat the ends of genes and at the boundaries of exons with introns (see Equation 9 of Nordborget al. 1996). While there is evidence for purifying selection on synonymous mutations (Come´ ronand Guthrie2005) and on mutations in noncoding sequences (Haddrill
et al. 2005), the levels of constraint on such mutations are typically much lower than those for nonsynony-mous mutations, so that it seems reasonable as a first approximation to ignore them, especially as the effects of weak selection are rapidly diluted by recombination (Equation 2). This argument does not apply to the splicing signals at the beginning and the end of introns (Mountet al. 1992). These are probably under strong selection and can be accounted for by slightly longer ‘‘effective exons.’’
Although for plausible parameter sets, it is clear that the meanBover all sites within a gene is always reduced by at least 4% or so, the within-gene patterns inBare
likely to be very small and would be very hard to detect in surveys of nucleotide site diversity, which previously have been used to infer differences across the genome in Ne caused by background selection and selective sweeps (Begun and Aquadro 1992; Charlesworth 1996). They may, however, be detectable from patterns of codon bias seen in genomewide analyses of sets of genes, since codon bias is affected by the value of Ne under the standard mutation–selection–drift model (Li 1987; Bulmer 1991; McVean and Charlesworth 1999). According to the Li–Bulmer equation, the equilibrium frequency of optimal codons,fop(assuming a preferred and an unpreferred codon at each site), for a given strength of selection is given by
fop
1
11kexpð4Ne˜sÞ
; ð4Þ
where˜sis the selection coefficient against heterozygotes for nonoptimal codons (semidominance is assumed), and k is the ratio of the mutation rates from and to optimal codons, respectively (i.e., the mutational bias). Without estimates ofkand˜s, it is impossible to make fully quantitative predictions to compare with the data, but an approximate analysis can be carried out as follows. Differentiatingfopin Equation 4 with respect to Ne, we obtain the following expression for the relation between a small change infopas a proportion of its value, (dfop)/fop, and the corresponding small proportional change inNe, (dNe)/Ne:
Ne
fop
dfop
dNe
¼4Ne˜skfopexpð4Ne˜sÞ: ð5Þ
The important parameters can be estimated as fol-lows. In their genome analyses, Come´ ronand Kreitman (2002) used the frequency of GC content at third cod-ing positions (GC3) in genes ofD. melanogasteras a proxy Figure5.—The effect of neighboring genes on the meanB
for a gene under background selection. Both plots show a fo-cal gene and assume four equidistant introns of 100 bp length, 6000 bp intergenic distance, 2000 bp coding sequence for all genes, andrg¼2.53106. Other features of the curves are as in Figure 3. (A) Fixed selection coefficient. (B) Average of 100 samples from the DDME.
Figure6.—Neighboring genes do not affect the patterns of
for codon usage bias, since most preferred codons in Drosophila end in G or C. Work on several species of Drosophila has suggested values ofk3 for mutational bias from GC to AT mutations (Maside et al. 2004; Bartolome´et al. 2005); to be compatible with the mean GC3 of 0.65 found by Come´ ron and Kreitman (2002), Nes for selection on GC3 must be 0.43. A proportional change in equilibrium fop (given by the right-hand side of Equation 5) is 60% of the corre-sponding small proportional change inNe, iffop¼0.65. Thus, everything else being equal, a change in fop is associated with a substantially larger change inNe.
Figure 10 of Come´ ronand Kreitman(2002) shows that GC3 for the central part of aD. melanogastergene without an intron is 3–4% lower than the value for the distal parts, but with a good deal of uncertainty as to the exact value of this difference. Figure 2B shows that, with the standard rate of gene conversion and the estimated
DDME, a mutation rate of 43109(slightly lower than the point estimate of Haag-Liautardet al. 2007) gives a value ofBfor the central part of a gene with no introns that is3% lower than that for the ends, correspond-ing to a difference of 1.8% in fop, somewhat smaller than the observed value. Come´ ronand Guthrie(2005) directly estimated values of Nes from polymorphism and divergence data on D. melanogaster and its close relatives and showed that it was lower for the central regions of long exons; their estimates of fopfor these Figure8.—Longer intergenic distances reduce background
selection in a region. This plot shows the fixed selection coef-ficient prediction for the meanBof a focal gene with varying intergenic distances, when five neighboring genes are located on both sides (with features as in Figure 5) andrg¼2.53106. Other features of the curves are as in Figure 3.
Figure9.—Predictions of background selection are
insen-sitive to uncertainty in realistic DDME width estimates. For each assumed DDME shape (x-axis), a corresponding esti-mate of the location parameter was made from the diversity data. The standard gene structure without neighboring genes was assumed, with rg ¼ 2.5 3 106. Other features of the curves are as in Figure 3. The bottom three lines belong to the axis on the right. Note that realistic shapes in this case are in the range 20–100, as narrower shapes predict too few lethal mutations and wider shapes predict too many lethal mutations (on the basis of estimates in Loewe and
Charlesworth2006). Details of the assumed DDMEs can
be found in Table 1.
Figure 7.—The effect of neighboring genes on
genes showed a reduction of10% for the central 150 codons as opposed to the 150 codons at the beginning and the end of long genes without introns. One possibility for explaining this underprediction of the observed effects is that gene conversion rates may be higher at the ends of genes than in their centers, as seen for therosylocus (Hillikerand Chovnick1981); this could enhance the relative difference in codon bias between the ends and the centers. Another possibility is that the mutation rate is higher than we have assumed. A mutation rate of 8 3 109, which is near the upper confidence interval of the estimates, gives a larger predicted difference infop (14%, transformed from Figure 2B) than is observed.
Figures 1 and 2 also show that the presence of introns reduces the size of the difference inBbetween the ends and the middle of genes, because the value ofBfor the central part of a gene is increased by the presence of introns. This is qualitatively consistent with the results in Figure 10 of Come´ ronand Kreitman(2002).
Qin et al. (2004) reexamined these patterns in the context of the effects of gene length and level of gene expression, using the effective number of codons (ENC) as an inverse measure of codon usage bias. Somewhat unexpectedly, their analyses showed that codon bias is lowest at either end of the genes, reaches a peak toward50–100 codons from the ends, and then declines toward the middle of the genes (their Figure 6). There is no obvious explanation for the low bias at the very ends of genes, which may reflect constraints on translational efficiency at the beginning and the end of translation (Qinet al. 2004), but the tendency for ENC to increase toward the centers of genes is qualitatively consistent with expectations under both background selection and weak Hill–Robertson effects among syn-onymous sites (Come´ ron and Kreitman 2002). The spatial pattern appears to be stronger in genes with higher expression levels; since overall codon bias is well known to be correlated with level of gene expression (Duret and Mouchiroud 1999), this presumably reflects stronger selection for codon bias in more highly expressed genes. From Equation 5, it can be shown that a higher value ofNesis associated with a higher relative sensitivity offoptoNefor realistic parameter values, so that any mechanism causing differences inNewill cause differences in codon bias to be stronger when overall codon bias is higher. Genes with one intron have slightly higher levels of codon usage bias along their length than genes lacking introns (Figure 8 in Qinet al. 2004), consistent with the results in Figures 1 and 2.
The effects of gene length and intron length:Figure 3 shows that exon length can have a substantial effect on the meanB for a gene, but the magnitude of the effect is very dependent on other parameter values. For selection coefficients drawn from the estimated DDME, and with the standard mutation rate of 43 109and standard recombination parameters, the value for the
longest genes in Figure 3B is 0.92 instead of the maximal value of 0.97 that would apply to very short genes;i.e., there is an5% reduction inB, correspond-ing to a 3% reduction infopbelow the maximum. With a mutation rate of 8 3 109 and a standard rate of recombination, B falls from 0.45 for short genes to
0.15 for long genes (Figure 3B, right scale). This 66% reduction inBcorresponds to an31% reduction infop, from Equation 5 withfop¼0.55 andk¼3.
The results on D. melanogaster of Duret and Mouchiroud(1999, Figure 1 therein) showed that long genes (.570 codons) with high expression levels have
11% lowerfopthan very short genes (,333 codons). The direct estimates ofNesalso suggested a large effect of exon length (Come´ ron and Guthrie 2005). Our results indicate that other processes will be required to explain these observations, if the mutation rate is 43 109; however, if the mutation rate in these genes is somewhat larger, background selection can generate these patterns.
Hill–Robertson interference among weakly selected synonymous sites is one of the other processes that may help explain these observations; simulations showed effects of this kind in regions of normal crossing over (but gene conversion was ignored in the model of Come´ ronet al. 1999). It is possible that a combination of background selection and Hill–Robertson interference among synonymous sites might produce larger effects at standard mutation rates. Duret and Mouchiroud (1999) argued that it was unlikely that general Hill– Robertson effects (which include background selec-tion) could explain the effects of gene length, since they found no effect of the length of neighboring genes on fopinCaenorhabditis elegans. However, with the very high linkage disequilibrium observed inC. elegans, prob-ably reflecting a high rate of self-fertilization (Cutter 2006), it is likely that the effective rate of recombination is very low (Charlesworthet al. 1993), so that genes experience background selection effects from many neighbors. This would greatly reduce the effects of im-mediate neighbors, if codon usage bias is determined by the current recombinational environment.
Come´ ron and Kreitman (2002, Figure 11 therein) also showed that the GC3 content of aD. melanogastergene decreases by3% of its maximal value as the proportion of a gene contributed by introns decreases. The results in Figure 4B for the standard parameter set predict an effect of this kind, but the magnitude of the change in fopis only2%, although bigger effects are again pos-sible with a higher mutation rate. Also, it is pospos-sible that including Hill–Robertson interference among synony-mous sites would improve the fit to the data.
et al. 2005). This is consistent with Figure 8, which shows more background selection with shorter intergenic dis-tances in gene clusters of constant size.
Figures 5 and 6 show that neighboring genes have little effect onBand its behavior within a gene, unless crossing over is infrequent. This reflects the fact that background selection caused by the relatively weak selection experienced by most amino acid mutations is very sensitive to recombination. But if crossing over is completely absent, gene conversion on its own fails to prevent the cumulative effects of background selec-tion (Figure 7), so that B is then very sensitive to the number of neighboring genes. With the standard gene conversion, selection, and mutation parameters, Figure 7B shows thatBis reduced to 5% of its maximum level with only 40 genes that fail to cross over. It was not possible to produce numerical results for cases with a distribution of selection coefficients for .40 genes, due to computing time constraints, but it seems likely from the nearly log-linear relation between B and the number of genes that 80 genes (close to the number on chromosome 4 of D. melanogaster; FlyBase 2006) would result in an effective population size of0.1% of its size without background selection. These results assume that gene conversion is occurring at normal rates in regions of low crossing over, consistent with observations on SNPs in such regions inD. melanogaster, other than the Y chromosome (Langley et al. 2000; Jensen et al. 2002; Sheldahl et al. 2003). The effect would obviously be even larger in the absence of gene conversion.
These results raise serious questions about the validity of the model for groups of genes that do not cross over. While codon usage bias is greatly reduced in low-recombination regions of theD. melanogastergenome, it is not completely absent, with an ENC of 50.9 on chro-mosome 4 compared with a value of 56.0 for random nucleotides from noncoding regions (Come´ ron et al. 1999). Furthermore, the level of SNP diversity on chro-mosome 4 is20% of the genomic average ( Jensenet al. 2002; Sheldahl et al. 2003), much greater than pre-dicted by the model. Similarly, diversity on the non-recombining neo-Ychromosome ofD. mirandais about one-sixtieth of that of its partner, the neo-X chromo-some (Bartolome´and Charlesworth2006).
Limitations of the background selection model:
These observations suggest that the model grossly over-estimates the effects of background selection when recombination rates are low. Such an effect has indeed been detected in previous studies using Monte Carlo simulations (Charlesworth et al. 1993; Nordborg
et al. 1996). It is probably caused by the fact that, with very close linkage, Hill–Robertson interference devel-ops between the relatively strongly selected sites causing background selection, and so its efficacy is undermined. The more densely that selected sites are packed into a given map length, the greater the extent of Hill–
Robertson interference among them, and so the weaker the effective selection acting on each of them. A pattern of this kind can be seen in Figure 9 of McVeanand Charlesworth(2000). This suggests a need to carry out more detailed investigations, to determine whether the observed features of low-recombination regions can be adequately accounted for. There is also a need to reinvestigate the predictions of the background selec-tion model for the distribuselec-tion of Neover large geno-mic regions in Drosophila (Hudsonand Kaplan1995; Charlesworth1996), using estimates of the distribu-tion of selecdistribu-tion coefficients from molecular populadistribu-tion genetics analyses rather than mutation-accumulation experiments.
Conclusion: Background selection within genes seems to be sufficient to explain the observed patterns of codon usage bias in genes, if mutation rates are high enough. However, we cannot exclude other explana-tions, since the absolute magnitude of the strength of background selection is strongly influenced by evo-lutionary parameters such as local mutation rates, recombination rates, and the distribution of selection coefficients. Other explanations like Hill–Robertson effects among synonymous sites or recurrent selective sweeps can be excluded only if the evolutionary param-eters of background selection can be estimated with sufficient accuracy. We therefore suggest that any in-tegrated theory of the patterns of codon bias in genes must include background selection. Further under-standing of these complexities will require models that include all relevant factors.
We thank Beatriz Vicoso for sharing her compilation of diversity data, Magnus Nordborg for sharing his unpublished simulation results, Deborah Charlesworth and Gabriel Marais for helpful dis-cussions, and Andrea Betancourt and Kelly Dyer for helpful comments on this manuscript. We also thank two anonymous reviewers for their comments, which helped to improve the article. This study was funded by a grant from the Leverhulme Trust to B.C., who is supported by the Royal Society.
LITERATURE CITED
Adams, M. D., S. E. Celniker, R. A. Holt, C. A. Evans, J. D. Gocayne et al., 2000 The genome sequence of Drosophila melanogaster. Science287:2185–2195.
Aitchison, J., and J. A. C. Brown, 1957 The Lognormal Distribution, With Special Reference to Its Uses in Economics. Cambridge University Press, Cambridge, UK.
Andolfatto, P., and M. Nordborg, 1998 The effect of gene
con-version on intralocus associations. Genetics148:1397–1399. Bartolome´, C., and B. Charlesworth, 2006 Evolution of
amino-acid sequences and codon usage on theDrosophila miranda neo-sex chromosomes. Genetics174:2033–2044.
Bartolome´, C., X. Maside, S. Yi, A. L. Grantand B. Charlesworth,
2005 Patterns of selection on synonymous and nonsynonymous variants inDrosophila miranda. Genetics169:1495–1507. Begun, D. J., and C. F. Aquadro, 1992 Levels of naturally occurring
DNA polymorphism correlate with recombination rates in Dro-sophila melanogaster. Nature356:519–520.
Betancourt, A. J., and D. C. Presgraves, 2002 Linkage limits the
Bierne, N., and A. Eyre-Walker, 2006 Variation in synonymous
co-don use and DNA polymorphism within the Drosophila genome. J. Evol. Biol.19:1–11.
Birky, Jr., C. W., and J. B. Walsh, 1988 Effects of linkage on rates of
molecular evolution. Proc. Natl. Acad. Sci. USA85:6414–6418. Bulmer, M., 1991 The selection-mutation-drift theory of
synony-mous codon usage. Genetics129:897–908.
Charlesworth, B., 1996 Background selection and patterns of
ge-netic diversity inDrosophila melanogaster. Genet. Res.68:131–149. Charlesworth, B., M. T. Morganand D. Charlesworth, 1993 The
effect of deleterious mutations on neutral molecular variation. Genetics134:1289–1303.
Charlesworth, D., B. Charlesworth and M. T. Morgan,
1995 The pattern of neutral molecular variation under the background selection model. Genetics141:1619–1632. Come´ ron, J. M., and T. B. Guthrie, 2005 Intragenic Hill-Robertson
interference influences selection intensity on synonymous muta-tions in Drosophila. Mol. Biol. Evol.22:2519–2530.
Come´ ron, J. M., and M. Kreitman, 2000 The correlation between
intron length and recombination in Drosophila: dynamic equi-librium between mutational and selective forces. Genetics156:
1175–1190.
Come´ ron, J. M., and M. Kreitman, 2002 Population, evolutionary
and genomic consequences of interference selection. Genetics
161:389–410.
Come´ ron, J. M., M. Kreitmanand M. Aguade´, 1999 Natural
selec-tion on synonymous sites is correlated with gene length and re-combination in Drosophila. Genetics151:239–249.
Crow, E. L. (Editor), 1988 Lognormal Distributions: Theory and Appli-cations. Marcel Dekker, New York.
Cutter, A. D., 2006 Nucleotide polymorphism and linkage
disequi-librium in wild populations of the partial selfer Caenorhabditis elegans. Genetics172:171–184.
Duret, L., and D. Mouchiroud, 1999 Expression pattern and,
surprisingly, gene length shape codon usage in Caenorhabditis, Drosophila, and Arabidopsis. Proc. Natl. Acad. Sci. USA 96:
4482–4487.
Felsenstein, J., 1974 The evolutionary advantage of
recombina-tion. Genetics78:737–756.
Fisher, R. A., 1930 The Genetical Theory of Natural Selection.
Claren-don Press, Oxford.
FlyBase, 2006 A Database of the Drosophila Genome(http://flybase.
bio.indiana.edu/).
Frisse, L., R. R. Hudson, A. Bartoszewicz, J. D. Wall, J. Donfack et al., 2001 Gene conversion and different population histories may explain the contrast between polymorphism and linkage dis-equilibrium levels. Am. J. Hum. Genet.69:831–843.
Gordo, I., and B. Charlesworth, 2001 Genetic linkage and
molec-ular evolution. Curr. Biol.11:R684–R686.
Haag-Liautard, C., M. Dorris, X. Maside, S. Macaskill, D. L.
Halligan et al., 2007 Direct estimation of per nucleotide
and genomic deleterious mutation rates in Drosophila. Nature
445:82–85.
Haddrill, P. R., B. Charlesworth, D. L. Halligan and P.
Andolfatto, 2005 Patterns of intron sequence evolution in
Drosophila are dependent upon length and GC content. Genome Biol.6:R67.
Haldane, J. B. S., 1927 The mathematical theory of natural and
ar-tificial selection. Part V: selection and mutation. Proc. Camb. Philos. Soc.23:838–844.
Hey, J., and R. M. Kliman, 2002 Interactions between natural
selec-tion, recombination and gene density in the genes of Drosophila. Genetics160:595–608.
Hill, W. G., and A. Robertson, 1966 The effect of linkage on limits
to artificial selection. Genet. Res.8:269–294.
Hilliker, A. J., and A. Chovnick, 1981 Further observations on
in-tragenic recombination inDrosophila melanogaster. Genet. Res.38:
281–296.
Hilliker, A. J., G. Harauz, A. G. Reaume, M. Gray, S. H. Clarket al.,
1994 Meiotic gene conversion tract length distribution within the rosy locus ofDrosophila melanogaster. Genetics137:1019–1026. Hudson, R. R., and N. L. Kaplan, 1995 Deleterious background
se-lection with recombination. Genetics141:1605–1617.
Ihaka, R., and R. Gentleman, 1996 R: a language for data analysis
and graphics. J. Comput. Graph. Stat.5:299–314.
Jensen, M. A., B. Charlesworthand M. Kreitman, 2002 Patterns
of genetic variation at a chromosome 4 locus ofDrosophila mela-nogasterandD. simulans. Genetics160:493–507.
Kim, Y., 2004 Effect of strong directional selection on weakly
se-lected mutations at linked sites: implication for synonymous co-don usage. Mol. Biol. Evol.21:286–294.
Kimura, M., 1962 On the probability of fixation of mutant genes in
a population. Genetics47:713–719.
Kimura, M., 1983 The Neutral Theory of Molecular Evolution.
Cam-bridge University Press, CamCam-bridge, UK.
Langley, C. H., B. P. Lazzaro, W. Phillips, E. Heikkinenand J. M.
Braverman, 2000 Linkage disequilibria and the site frequency
spectra in thesu(s) and su(wa) regions of theDrosophila mela-nogaster Xchromosome. Genetics156:1837–1852.
Li, W. H., 1987 Models of nearly neutral mutations with particular
implications for nonrandom usage of synonymous codons. J. Mol. Evol.24:337–345.
Limpert, E., W. A. Staheland M. Abbt, 2001 Log-normal
distri-butions across the sciences: keys and clues. BioScience51:341– 352.
Loewe, L., and B. Charlesworth, 2006 Inferring the distribution
of mutational effects on fitness in Drosophila. Biol. Lett.2:426– 430.
Loewe, L., B. Charlesworth, C. Bartolome´and V. No¨ el, 2006
Es-timating selection on nonsynonymous mutations. Genetics172:
1079–1092.
Maindonald, J., and J. Braun, 2002 Data Analysis and Graphics Us-ing R: An Example-Based Approach. Cambridge University Press, Cambridge, UK.
Marais, G., T. Domazet-Loso, D. Tautzand B. Charlesworth,
2004 Correlated evolution of synonymous and nonsynonymous sites in Drosophila. J. Mol. Evol.59:771–779.
Maside, X., A. W. Leeand B. Charlesworth, 2004 Selection on
codon usage inDrosophila americana. Curr. Biol.14:150–154. MaynardSmith, J., and J. Haigh, 1974 The hitchhiking effect of a
favorable gene. Genet. Res.23:23–35.
McVean, G. A. T., and B. Charlesworth, 1999 A population
ge-netic model for the evolution of synonymous codon usage: pat-terns and predictions. Genet. Res.74:145–158.
McVean, G. A. T., and B. Charlesworth, 2000 The effects of
Hill-Robertson interference between weakly selected mutations on patterns of molecular evolution and variation. Genetics 155:
929–944.
McVean, G. A. T., and J. Vieira, 2001 Inferring parameters of
mu-tation, selection and demography from patterns of synonymous site evolution in Drosophila. Genetics157:245–257.
Misra, S., M. A. Crosby, C. J. Mungall, B. B. Matthews, K. S.
Campbellet al., 2002 Annotation of theDrosophila melanogaster
euchromatic genome: a systematic review. Genome Biol. 3:
research0083.0081–0022.
Moriyama, E. N., and J. R. Powell, 1996 Intraspecific nuclear DNA
variation in Drosophila. Mol. Biol. Evol.13:261–277.
Mount, S. M., C. Burks, G. Hertz, G. D. Stormo, O. Whiteet al.,
1992 Splicing signals in Drosophila: intron size, information content, and consensus sequences. Nucleic Acids Res. 20:
4255–4262.
Muller, H. J., 1932 Some genetic aspects of sex. Am. Nat.66:118–
138.
Nordborg, M., B. Charlesworth and D. Charlesworth,
1996 The effect of recombination on background selection. Genet. Res.67:159–174.
Nordborg, M., T. T. Hu, Y. Ishino, J. Jhaveri, C. Toomajianet al.,
2005 The pattern of polymorphism in Arabidopsis thaliana. PLoS Biol.3:1289–1299.
Payseur, B. A., and M. W. Nachman, 2002a Gene density and
hu-man nucleotide polymorphism. Mol. Biol. Evol.19:336–340. Payseur, B. A., and M. W. Nachman, 2002b Natural selection at
linked sites in humans. Gene300:31–42.
Presgraves, D. C., 2005 Recombination enhances protein
adapta-tion inDrosophila melanogaster. Curr. Biol.15:1651–1656. Qin, H., W. B. Wu, J. M. Come´ ron, M. Kreitman and W. H. Li,
2004 Intragenic spatial patterns of codon usage bias in prokary-otic and eukaryprokary-otic genomes. Genetics168:2245–2260. Reed, F. A., J. M. Akeyand C. F. Aquadro, 2005 Fitting
divergence along the human autosomes. Genome Res.15:1211– 1221.
Sheldahl, L. A., D. M. Weinreichand D. M. Rand, 2003
Recom-bination, dominance and selection on amino acid polymorphism in the Drosophila genome: contrasting patterns on theXand fourth chromosomes. Genetics165:1195–1208.
Stephan, W., B. Charlesworthand G. McVean, 1999 The effect of
background selection at a single locus on weakly selected, par-tially linked variants. Genet. Res.73:133–146.
Stephan, W., Y. S. Songand C. H. Langley, 2006 The hitchhiking
effect on linkage disequilibrium between linked neutral loci. Ge-netics172:2647–2663.
Tachida, H., 2000 DNA evolution under weak selection. Gene261:
3–9.
Wiuf, C., and J. Hein, 2000 The coalescent with gene conversion.
Genetics155:451–462.