DOI: 10.1534/genetics.106.060491
Nonlinear Tests for Genomewide Association Studies
Jinying Zhao,* Li Jin
†,‡and Momiao Xiong*
,†,1*Human Genetics Center, University of Texas Health Science Center, Houston, Texas 77030,†Laboratory of Theoretical Systems Biology, School of Life Science, Fudan University, Shanghai 200433, China and‡CAS-MPG Partner Institute of
Computational Biology, SIBS, CAS, Shanghai 200031, China Manuscript received May 8, 2006
Accepted for publication June 19, 2006
ABSTRACT
As millions of single-nucleotide polymorphisms (SNPs) have been identified and high-throughput genotyping technologies have been rapidly developed, large-scale genomewide association studies are soon within reach. However, since a genomewide association study involves a large number of SNPs it is therefore nearly impossible to ensure a genomewide significance level of 0.05 using the available statistics, although the multiple-test problems can be alleviated, but not sufficiently, by the use of tagging SNPs. One strategy to circumvent the multiple-test problem associated with genome-wide association tests is to develop novel test statistics with high power. In this report, we introduce several nonlinear tests, which are based on nonlinear transformation of allele or haplotype frequencies. We investigate the power of the nonlinear test statistics and demonstrate that under certain conditions, some nonlinear test statistics have much higher power than the standard x2-test statistic. Type I error rates of the nonlinear tests are validated using simulation studies. We also show that a class of similarity measure-based test statistics is based on the quadratic function of allele or haplotype frequencies, and thus they belong to nonlinear tests. To evaluate their performance, the nonlinear test statistics are also applied to three real data sets. Our study shows that nonlinear test statistics have great potential in association studies of complex diseases.
W
ITH the imminent completion of the HapMap Project providing a comprehensive catalog of com-mon genetic variations in human populations (Altshuler and Clark 2005) and rapid development of technol-ogies enabling efficient and economical genotyping of a large number of variants (Borstinget al.2005), ge-nomewide association studies will become practically feasible in the near future. However, a limit, which may keep genomewide association studies from realization, pertains to problems of a statistical nature. Considering the adjustment for millions of statistical tests, a strin-gentP-value of 106–107has been suggested to ensurea genomewide significance level of 0.05 (Freimer and Sabatti 2004; Neale and Sham 2004; Wang et al. 2005). Although this problem can be alleviated by se-lecting and typing tag SNPs (Halldorssonet al.2004; Ahmadiet al.2005), the effect of such a strategy on the significance level is still limited. Therefore, developing novel test statistics with high power requires immediate consideration.
The primary assumption for association studies is that a mutation (a disease allele) increases disease suscep-tibility. Under this assumption, one expects that the disease allele will occur more frequently in the affected
individuals (cases) than in the unaffected ones (con-trols) (Pritchardand Donnelly2001). The standard x2-test for association studies is to identify the disease
locus by comparing the differences in allele or haplo-type frequencies between the affected and unaffected individuals. More precisely, thex2-statistic is a quadratic
form of difference of allele or haplotype frequencies be-tween the affected and unaffected individuals (Chapman and Wijsman1998; Akeyet al.2001). A natural way to amplify differences in frequency is to conduct linear transformation of allele or haplotype frequencies in the currently used statistics for association studies. However, any statistics arising from linear transformation will not change the values of pretransformation statistics. We propose to use nonlinear transformations of allele or haplotype frequencies in cases (PA) and in controls (P),
i.e.,fðPAÞandfðPÞ, with the expectation that statistics
based on the difference jfðPAÞ fðPÞj will be more
powerful than those based on the difference jPAPj.
For example, the case–control differential may be en-hanced with some nonlinear transformations of allele or haplotype frequencies. Association tests with such nonlinear transformation are referred to as nonlinear association tests hereafter.
The main purpose of this report is to develop a general statistical framework of nonlinear association tests and to present several nonlinear test statistics for association studies. To accomplish this, we first study the
1Corresponding author: Human Genetics Center, School of Public Health, University of Texas Health Science Center, 1200 Herman Pressler,
Houston, TX 77030. E-mail: [email protected]
properties of nonlinear transformations of allele or haplotype frequencies in cases and controls. We then study how to construct test statistics on the basis of the nonlinear transformations of allele or haplotype fre-quencies and to derive asymptotic distributions of the nonlinear test statistics under null and alternative hy-potheses. Alternative to comparing differences in allele or haplotype frequencies, a recently developed class of association tests compares similarities of a genome region between affected and unaffected individuals (Tzenget al.2003; Zhanget al.2003). Under the gen-eral statistical framework for nonlinear association tests, we show that many similarity measure-based test statis-tics are nonlinear association tests with quadratic trans-formation of allele or haplotype frequencies. Thus, we can unify the allele or haplotype frequency-based as-sociation tests and similarity measure-based asas-sociation tests. Since different nonlinear tests may have different power, selection of nonlinear statistics is critical to a successful application of nonlinear tests to association studies. We compare the power of several nonlinear test statistics and uncover the relationship between the power of the nonlinear test statistics and the strength of nonlinearity used in the test statistics (Bates and Watts1980). To demonstrate that amplification of the differences in allele or haplotype frequencies by non-linear test statistics will not cause false positive prob-lems, we study the type I error rates of the nonlinear test statistics by simulations. Finally, to evaluate the perfor-mance of the nonlinear test statistics for association studies, the presented nonlinear test statistics are ap-plied to three real data examples.
METHODS
Nonlinear transformations of allele or haplotype frequencies:The principle behind the standardx2-test
in case–control studies is to compare the difference in allele or haplotype frequencies between cases and controls. We expect that amplifying such a difference may improve the power to detect disease susceptibility genes. One strategy to amplify the difference is to non-linearly transform the frequencies. The difference in the values of nonlinear function of allele or haplotype frequencies between cases and controls should be larger than the difference in original allele or haplotype fre-quencies. Therefore, our goal is to search for nonlinear transformations that meet this requirement. To achieve this goal, we first investigate the factors that would affect the difference in values of nonlinear function of allele or haplotype frequencies between the two populations. For convenience of presentation, we study only haplo-types. The results can be adapted easily for the alleles.
Consider two allelesDanddat the disease locus. Let
Ddenote the disease allele and f11;f12, and f22 be the
penetrance of genotypesDD,Dd, and dd, respectively.
LetPðAÞ ¼P2
Df1112PDPdf121Pd2f22 be the prevalence
of disease. Define
a1¼
PDf111Pdf12
PðAÞ and a2 ¼
PDf121Pdf22
PðAÞ ;
wherePDandPd are the frequencies of allelesDandd,
respectively. Suppose that K marker loci spanm hap-lotypes Hiði¼1;. . .;mÞ. Let dHiD and dHid be the overall measures of linkage disequilibrium (LD) be-tween haplotype Hi and disease allele D and alleled,
respectively, and define
dHiD¼PHiDPHiPD and dHid ¼PHidPHiPd;
where PHiD and PHi are the frequencies of the haplo-types HiD and Hi, respectively (Xionget al. 2003). It is known that PA
Hi ¼PHi1ða1a2ÞdHiD ¼PHi1edHiD, wherePA
Hi andPHiare the frequencies of the haplotype
Hi in the cases and controls, respectively, and e¼ a1a2 (Zhao et al. 2005). Let fðPHiÞ be a nonlinear function of the haplotype frequency PHi. We now cal-culate the difference between the nonlinear transfor-mation of the haplotype frequency in the affected individuals PA
Hi and the nonlinear transformation of the haplotype frequency in the general populationPHi. By Taylor’s expansion, we can obtain
d0 ¼fðPHAiÞ fðPHiÞ ef9ðPHiÞdHiD1 e2
2f$ðPHiÞd
2
HiD;
wheref9ðPHiÞandf$ðPHiÞare the first and second de-rivatives of the functionfðPHiÞwith respect toPHi. This equation still holds if the haplotype frequencies are replaced by allele frequencies.
From the above equation, the difference between the nonlinear functions of the frequencies in cases and controls depends on the first and second derivatives of the function fðPHiÞwith respect to PHi as well as the overall measure of the LD between the haplotypeHiand
the disease alleleD. Ifjf9ðPHiÞ1ðef$ðPHiÞdHiD=2Þj.1, then we havejd0j.jPHAiPHij, which implies that the absolute value of the difference in nonlinear functions of the haplotype frequencies between cases and controls is larger than that of the original frequency difference under this condition.
Test statistics: Assume that nA affected individuals
andnGunaffected individuals are sampled. LetPˆAHi and PˆHi be the estimators of frequencies of haplotype Hi in cases and controls, respectively. The allele or haplo-type frequencies are asymptotically distributed as mul-tivariate normal distributions NðPA;ð1=2n
AÞSAÞ and NðP;ð1=2nGÞSÞ, respectively, wherePA¼ ½PHA1;...;P
A
Hm T
,
P¼ ½PH1;...;PHm T
,SA¼diagðPA
1;...;PmAÞPAðPAÞ
T
, and S¼diagðP1;...;PmÞPPT.
Y ¼ ½Y1;. . .;Ym
T
. Then, the random vectorsX andY
are asymptotically distributed as multivariate normal distributions NðfðPAÞ;ð1=2N
AÞBSABTÞ and NðfðPÞ;
ð1=2nGÞCSCTÞ, respectively (Serfling 1980), where
bii¼ @fðPHAiÞ=@P A
Hi, bij ¼0, cii¼@fðPHiÞ=@PHi, cij¼0,
B¼ ðbijÞm3m, andC ¼ ðcijÞm3m.
Define the matrix
L¼ 1 2nA
BSABT1 1 2nG
CSCT:
Let ˆLbe an estimator of the matrixL. We propose the test statisticTN to test the association of the alleles or
haplotypes with disease,
TN¼ ðX YÞTLˆ
ðX YÞ;
where ˆL is the generalized inverse of matrix ˆL. The null hypothesis is that there is no association of alleles or haplotypes with the disease; i.e., H0:PA¼P. Let r ¼rankðLÞ. Under the null hypothesis,ˆ TN is
asymp-totically distributed as a central x2 with r degrees of
freedom (Greenwood and Nikulin 1996; Serfling 1980). The test statisticTNdefines a class of nonlinear
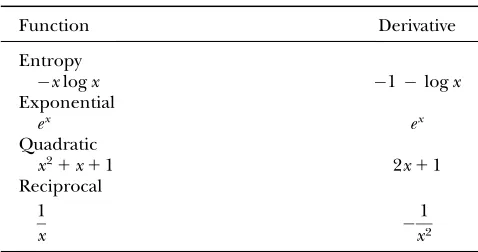
tests. Various nonlinear functions with some regularity can be used to construct the test statistic. Table 1 lists some of the nonlinear functions used in this study and their corresponding derivatives.
Similarity measure-based statistics are special cases of the nonlinear tests: We often observe that affected individuals share common haplotypes in the region sur-rounding disease mutations more often than unaffected individuals (Fanand Lange1998; Jorde2000). There are two ways to quantify the excessive sharing of com-mon haplotypes acom-mong affected individuals. One way is to measure differences in allele or haplotype frequen-cies between affected and unaffected individuals (Akey
et al.2001). Another way is to measure differences in similarity of the genome region between affected and unaffected individuals (Bourgain et al. 2001; Tzeng
et al.2003). Inappendix b, we show that the similarity measure of the genome region is a quadratic function of
allele or haplotype frequencies. Therefore, similarity measure-based statistics are nonlinear test statistics.
Analytic formulas for power calculation of the non-linear tests: To evaluate the performance of the non-linear test for association studies, we need to calculate its power. The alternative hypothesis is that there is at least one allele or haplotype associated with the disease;
i.e., Ha:PA6¼P. Under the alternative hypothesis, the
test statistic TN is asymptotically distributed as a
non-central x2
ðrÞ with noncentrality parameter lN, where
lN¼ ½fðPAÞ fðPÞTL1½
fðPAÞ fðPÞ, r ¼rankðLÞ, fðPAÞ ¼ ½fðPA
H1Þ;. . .;fðP
A
HmÞ T;
fðPÞ ¼ ½fðPH1Þ; . . .;
fðPHmÞ T
, L¼ ð1=2nAÞBS
A
BT1ð1=2n
GÞCSCT, S
A¼
diagðPA
H1; . . .;P
A
HmÞ P AðPAÞT
, S¼diagðPH1; . . .;
PHmÞ PP
T, PA ¼ ½PA
H1; . . .;P
A
Hm T
, P ¼ ½PH1; . . .;
PHm T
, bii¼@fðPHAiÞ=@P A
Hi;bij ¼0; i6¼j, cii ¼@fðPHiÞ= @PHi;cij ¼0;i 6¼j,B¼ ðbijÞm3m, andC ¼ ðcijÞm3m.
The noncentrality parameterlNcan be approximated
by
lNe2dTHD I1
1 2S
T 1
2nA
ðI1SÞSAðI1SÞ1 1
2nG S
3 I11
2S
dHD
(appendix c), where
e¼PDðf11f12Þ1Pdðf12f22Þ
PðAÞ ;
dHD¼ ½dH1D; . . .;dHmDT; and
S¼C1HðPAPÞ ¼diag ef$ðPH1ÞdH1D
f9ðPH1Þ
;. . .;ef$ðPHmÞdHmD f9ðPHmÞ
:
The matrixSmeasures the strength of the nonlinearity of the nonlinear transformationfðPÞ(appendix c). Note that under the same alternative hypothesis, the tradi-tionalx2-test statistic, which is defined as
T ¼ ðPˆAPˆÞTLˆ1
0 ðPˆAPˆÞ Lˆ0 ¼ 1 2nA
ˆ SA1 1
2nG ˆ S;
is a noncentral x2
ðrÞ-distribution with the noncentrality
parameter
le2dTHD 1 2nA
SA1 1
2nG S
dHD:
Comparing the noncentrality parameterslNandl, we
can see that the noncentrality parameter lN involves
one more termS than the noncentrality parameterl. The matrixScharacterizes the nonlinearity of the non-linear function. The power of the nonnon-linear test sta-tistics depends on the strength of the nonlinearity of the nonlinear function through the matrixS. The matrixS TABLE 1
Some of the nonlinear transformations for allele or haplotype frequencies
Function Derivative
Entropy
xlogx 1logx Exponential
ex ex
Quadratic
x21x11 2x11
Reciprocal 1
x
is referred to as the strength matrix of the nonlinearity of the nonlinear function.
If the product terms of the haplotype frequencies in the variance–covariance matricesSAandSare ignored, the matricesSA and Scan be approximated by SA ¼ diagðPA
H1;. . .;P
A
HmÞ and S¼diagðPH1;. . .;PHmÞ. Then the noncentrality parameterslN andl will be further
reduced to
lNe2X
m
i¼1
d2H
iDð11ðepi=2ÞdHiDÞ
2 ð1=2nAÞð11ðepidHiD=2ÞÞ
2PA
Hi1ð1=2nGÞPHi
;
le2X
m
i¼1
d2H
iD
ð1=2nAÞPHAi1ð1=2nGÞPHi
;
where pi¼f$ðPHiÞ=f9ðPHiÞ. The parameter pi is pro-portional to the curvature of a nonlinear function (Batesand Watts 1980) and influences the noncen-trality parameterlN.
From the above formulas, we can see that both noncentrality parameterslandlNdepend on the
fre-quencies of the allele or haplotypes, penetrance, the measure of the LD between the marker alleles or haplo-types, and the disease allele as well as sample size. In addition, the noncentrality parameter of nonlinear test lNalso depends on the curvature, which measures the
degree of nonlinearity of nonlinear function.
RESULTS
Distribution of the nonlinear test statistics: In the previous sections, we have shown that when the sample size is large enough to apply large sample theory, the nonlinear test statistics under the null hypothesis of no association are asymptotically distributed as a central x2-distribution. To examine the validity of this
state-ment, we performed a series of simulation studies. The computer program SNaP (Nothnagel2002) was used
to generate haplotypes of the sample individuals. Two data sets with a single haplotype block each were simu-lated. The first data set has two marker loci that gener-ated four haplotypes with frequencies 0.2952, 0.2562, 0.1957, and 0.2529. The second data set has six marker loci that generated eight haplotypes with frequencies 0.1820, 0.1461, 0.1406, 0.1291, 0.1211, 0.1107, 0.0817, and 0.0887. For each data set, 20,000 individuals who were equally divided into cases and controls were gen-erated in the general population.
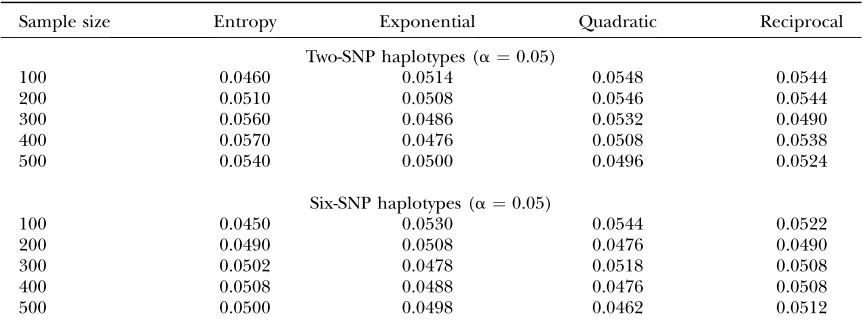
To examine whether the asymptotic results of the nonlinear test statistics still hold for small sample size under the null hypothesis of no association, 100–500 individuals were randomly sampled from each of the cases and controls. Ten thousand simulations were re-peated for each of the nonlinear test statistics. In each simulation, the nonlinear test statistics were calculated. Table 2 shows that the estimated type I error rates (at the significance level 0.05) of the nonlinear test statistics were not appreciably different from the nominal level a¼0:05.
Power of nonlinear test statistics and standardx2-test
statistic: Power of a test statistic for association studies depends on the allele or haplotype frequencies at the marker loci and the frequency of the disease allele, measure of LD between the alleles or haplotypes at the marker loci and the disease allele, sample size, the dis-ease model, and the measure of nonlinearity of the nonlinear function. To evaluate the performance of nonlinear tests, we compare the power of several non-linear test statistics with that of the standard x2-test
statistic by both analytical method and simulation. The results are very similar. In this report, we present only the power calculation by analytical method.
We first investigate the expected noncentrality pa-rameters of nonlinear test statistics at the disease locus. We assume that frequencies of two alleles at the disease locus in controls are both equal to 0.5. Figure 1 plots the
TABLE 2
Estimated type I error rates for the nonlinear test statistics (10,000 simulations)
Sample size Entropy Exponential Quadratic Reciprocal
Two-SNP haplotypes (a¼0.05)
100 0.0460 0.0514 0.0548 0.0544
200 0.0510 0.0508 0.0546 0.0544
300 0.0560 0.0486 0.0532 0.0490
400 0.0570 0.0476 0.0508 0.0538
500 0.0540 0.0500 0.0496 0.0524
Six-SNP haplotypes (a¼0.05)
100 0.0450 0.0530 0.0544 0.0522
200 0.0490 0.0508 0.0476 0.0490
300 0.0502 0.0478 0.0518 0.0508
400 0.0508 0.0488 0.0476 0.0508
expected noncentrality parameters of the nonlinear test statistics and the standardx2-test statistic as a function
of frequency of disease allele in cases. From Figure 1 we can see three remarkable features. First, the expected noncentrality parameters of all test statistics increase as the difference in frequency of disease allele between cases and controls increases. Second, except for the reciprocal-based statistic that uses reciprocal function as nonlinear transformation of allele/haplotype frequencies, expected noncentrality parameters for all the other nonlinear test statistics are larger than that of the standard x2-test
statistic. Third, except for the reciprocal-based statistic, expected noncentrality parameters for all the other nonlinear test statistics are almost indistinguishable.
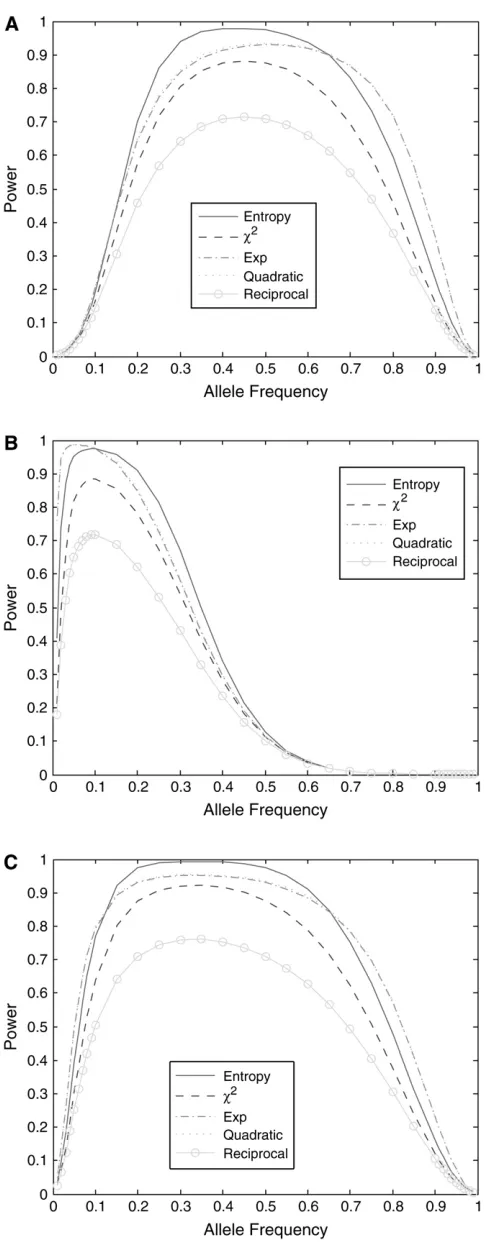
We then investigate the power of nonlinear test statistics at the disease locus. Figure 2 plots the power of the nonlinear test statistics and the standardx2-test
statistic as a function of disease allele frequency under three different disease models: (i) disease model with penetrancef11¼1,f12¼0:2, andf22¼0:1; (ii) disease
model with penetrancef11¼1, f12¼1, andf22¼0:1;
and (iii) genotype relative risk model forr¼4, in which the genotype relative risk for genotypesDd and DDis
r and r2 times greater than that for the genotype dd
(Rischand Merikangas1996). Several features emerge from Figure 2. First, power for most of the nonlinear test statistics is higher than that of the standardx2-test
statistic, but power of the reciprocal-based test statistic is lower than that of the standardx2-test statistic. The
power curves of the exponential and quadratic func-tions are similar. Second, power of the nonlinear test statistics is influenced by disease models. Shapes of the nonlinear test statistics in disease model ii are different from those of the test statistics in disease models i and
iii. Third, power of the test statistics depends on disease allele frequency. Shapes of the power curves in disease models i and iii are roughly bell; however, shapes of the power curves in disease model ii are skewed to the left.
Real data examples: Nonlinear test statistics are also applied to three real examples. The first example is a test of association of COMT haplotypes with schizophrenia.P-values of the nonlinear tests for testing associations of two-SNP haplotypes (generated from two SNP markers) and three-SNP haplotypes (generated from three SNP markers) with schizophrenia are pre-sented in Table 3. Table 3 also includesP-values of the standardx2-tests by Shifmanet al.(2002). Improvement
of the nonlinear tests over the standard x2-test varies
among nonlinear tests and among haplotypes. The quadratic-based test has the largest improvement over the standard x2-test when it is applied to three-SNP
haplotypes. The P-value of the quadratic-based test is 4.031014, which is much smaller than the 4:53104
obtained by the standardx2-test.
The second example is a test of association of func-tional haplotypes in the promoter of the matrix metal-loproteinase-2 (MMP-2) gene with esophageal cancer in the Chinese Han population (Yuet al.2004). Two SNPs in theMMP-2gene were typed in 527 esophageal cancer patients and 777 controls.P-values of the nonlinear tests are given in Table 4. We can see thatP-values for most of the nonlinear tests are 10–100 times smaller than that of the standard x2-test, whereas the P-value of the
reciprocal-based test is almost the same as that of the standardx2-test.
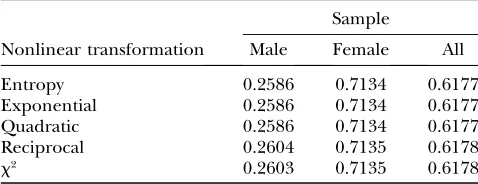
To examine whether nonlinear test statistics show significant association or not when the standardx2-test
shows no significance, the proposed nonlinear test sta-tistics were also applied to test association of a func-tional SNP inZDHHC8with schizophrenia in a Japanese case–control population (Saitoet al.2005). The results are summarized in Table 5. The data demonstrate that when thex2-test shows no association of the functional
SNP in the ZDHHC8 gene with schizophrenia, non-linear test statistics also show no evidence of association.
P-values of the nonlinear test statistics are the same as that of the standardx2-test.
DISCUSSION
In the near future, genomewide association studies performing millions of statistical tests will be conducted. To ensure a genomewide significance level of 0.05, a stringentP-value is required for the statistical test. There is crucial need for increased efforts in developing new statistical methods that can achieve smallP-values. As an attempt toward this direction, in this report, we present nonlinear tests for association studies.
The traditional x2-test statistic is a quadratic
func-tion of the difference (PAP) in allele or haplotype Figure1.—Expected noncentrality parameters of the
frequencies between the affected and unaffected indi-viduals. Although thex2-test statistic itself is a nonlinear
function of allele or haplotype frequencies, its basic unit (PAP) is a linear transformation of allele or
haplo-type frequencies. If the difference in nonlinear trans-formation of allele or haplotype frequencies is larger than the difference in allele or haplotype frequencies,
i.e., kfðPAÞ fðPÞk.kPAPk, where k:k denotes a
norm of the vector, then the statistics based onfðPAÞ fðPÞmay have higher power than the statistics based on (PAP). On the basis of this simple idea, we have
developed a general statistical framework for nonlinear tests that provides basic procedures about how to con-struct test statistics using nonlinear transformations of allele or haplotype frequencies. We have showed that, in general, similarity measure-based statistics can be for-mulated as the differences in quadratic forms of allele or haplotype frequencies. Therefore, using the pro-posed statistical framework for nonlinear tests, we can derive many similarity measure-based statistics. As a by-product, nonlinear test theory can unify two classes of association tests: tests of the difference in allele or hap-lotype frequencies and tests based on a similarity mea-sure of the genome region being tested.
The distributions of nonlinear test statistics are based on the asymptotic statistical theory of nonlinear trans-formations. We investigate the distributions of several nonlinear test statistics under the null hypothesis by
TABLE 3
Association tests forCOMThaplotypes with schizophrenia
Two-SNP haplotypesa Three-SNP haplotypea:
H4
P-values for H1 H2 H3
Entropy 1.9e-009 2.7e-006 2.9e-006 1.5e-012 Exponential 1.2e-013 9.5e-009 1.8e-005 8.0e-014 Quadratic 7.5e-013 1.5e-008 9.5e-006 4.0e-014 Reciprocal 1.4e-010 8.3e-008 2.4e-006 2.9e-013
x2b 1.4e-004 5.7e-003 1.1e-003 4.5e-004
All data (including males and females) are used in the analysis.
a
H1, rs737865–rs165599; H2, rs737865–rs165688; H3, rs165599–rs165688;H4, rs165688–rs737865–rs165599.
b
P-values reported by Shifmanet al. (2002).
Figure2.—(A) Power of the nonlinear test statistics and
simulation studies. Even with moderate sample size (n ¼100Þ, distributions of the proposed nonlinear sta-tistics are still close to centralx2-distribution (data not
shown). To validate the test statistics, we calculate the type I error rates of the presented nonlinear statistics by simulations. This showed that the type I error rates of nonlinear statistics were close to the nominal signifi-cance levels, which implies that the nonlinear tests for association study are valid in a single homogeneous population.
To evaluate the performance of the nonlinear test statistics, we compare the power of the nonlinear test statistics with that of the standard x2-test statistic. To
reveal the relationships between the power of the non-linear test statistics and the measure of nonnon-linearity of nonlinear transformations, we developed analytical tools for calculations of the power of the test statistics. Power of the nonlinear statistics depends on several parameters such as disease model, allele or haplotype frequencies, measure of LD between the allele or haplotype and disease allele, and the measure of non-linearity of the nonlinear transformations of the allele or haplotype frequencies. We showed that, in many cases, most of the studied nonlinear test statistics have higher power than the standard x2-test statistic, with
the exception of the reciprocal transformation whose power, in general, is lower than that of the standardx2
-test statistic. However, since the power of a statistic is a complex issue, there is not one statistic that is uniformly most powerful. Forms of nonlinear transformation are crucial for developing nonlinear test statistics. Our
preliminary results showed that the larger the measure of nonlinearity of the nonlinear transformation is, the higher the power of its corresponding nonlinear test statistic. Power of nonlinear test statistics is a compli-cated function of the measure of nonlinearity of the non-linear transformation and other genetic and population parameters, particularly allele/haplotype frequencies. Our experience shows that when the frequencies of alleles/haplotypes are ,0.05, nonlinear test statistics may not be a good choice for association analysis. We suggest using nonlinear test statistics when the frequen-cies of alleles/haplotypes are .0.05; i.e., we use non-linear test statistics for association analysis of common diseases with common alleles. A clear and consistent pattern of power of the nonlinear test statistics depends on the measure of nonlinearity of the nonlinear trans-formation and is difficult to obtain. More investigations are needed.
To further evaluate the performance of the nonlinear test statistics, the proposed nonlinear test statistics were also applied to three real data examples. The results showed that when the standardx2-test detected
associ-ation of the COMT gene with schizophrenia, all non-linear test statistics demonstrated strong association of the COMT gene with schizophrenia and when the standard x2-test detected no association of the gene ZDHHC8with schizophrenia, all nonlinear test statistics with almost the same P-values as that of the standard x2-test also showed no association.
The results in this report are very limited. Theoretical and empirical studies should be conducted to compare and investigate the relative strengths and weaknesses of nonlinear tests and other existing association tests. The properties of the nonlinear test statistics should be further investigated both by theoretical studies and by empirical simulations. In this report, we studied only very limited nonlinear functions. It is worth developing general theory for searching optimal nonlinear func-tions with the highest power. Nonlinear tests are a new concept for developing test statistics, which will open new ways for developing powerful statistics in genetic studies of complex diseases. Theory for nonlinear tests is at its infancy. Many theoretical works and empirical evaluations are needed in the future.
We thank Sagiv Shifman and Ariel Darvasi for providing the detailed data information for schizophrenic haplotype analyses. We thank two anonymous reviewers for helpful comments on the manuscript, which led to its improvement. We also thank Ranjan Deka for his constructive comments. M. M. Xiong is supported by the National Institutes of Health (NIH)–National Institute of Arthritis and Musculoskeletal and Skin Diseases grants IP50AR44888 and HL74735 and by NIH grant ES09912. J. Y. Zhao is supported by NIH grant ES09912.
LITERATURE CITED
Ahmadi, K. R., M. E. Weale, Z. Y. Xue, N. Soranzo, D. P. Yarnall et al., 2005 A single-nucleotide polymorphism tagging set for
human drug metabolism and transport. Nat. Genet.37:84–89.
TABLE 5
Association tests of a functional SNP in theZDHHC8gene with schizophrenia
Sample
Nonlinear transformation Male Female All
Entropy 0.2586 0.7134 0.6177
Exponential 0.2586 0.7134 0.6177
Quadratic 0.2586 0.7134 0.6177
Reciprocal 0.2604 0.7135 0.6178
x2 0.2603 0.7135 0.6178
TABLE 4
P-values of nonlinear tests for theMMP-2gene with esophageal cancer
Nonlinear transformation P-value
Entropy 3.2e-008
Exponential 2.3e-007
Quadratic 1.9e-007
Reciprocal 5.1e-006
Akey, J., L. Jinand M. Xiong, 2001 Haplotypes vs single marker
linkage disequilibrium tests: What do we gain? Eur. J. Hum.
Genet.9:291–300.
Altshuler, D., and A. G. Clark, 2005 Genetics. Harvesting medical
information from the human family tree. Science307:1052–1053.
Bates, D. M., and D. G. Watts, 1980 Relative curvature measures of
nonlinearity. J. R. Stat. Soc. Ser. B42:1–25.
Borsting, C., J. J. Sanchezand N. Morling, 2005 SNP typing on
the NanoChip electronic microarray. Methods Mol. Biol. 297:
155–168.
Bourgain, C., E. Genin, P. Margaritte-Jeanninand F. Clerget
-Darpoux, 2001 Maximum identity length contrast: a powerful
method for susceptibility gene detection in isolated populations.
Genet. Epidemiol.21(Suppl. 1): S560–S564.
Chapman, N. H., and E. M. Wijsman, 1998 Genome screens using
linkage disequilibrium tests: optimal marker characteristics and
feasibility. Am. J. Hum. Genet.63:1872–1885.
Fan, R., and K. Lange, 1998 Models for haplotype evolution in
a nonstationary population. Theor. Popul. Biol.53:184–198.
Freimer, N., and C. Sabatti, 2004 The use of pedigree, sib-pair and
association studies of common diseases for genetic mapping and
epidemiology. Nat. Genet.36:1045–1051.
Greenwood, P. E., and M. S. Nikulin, 1996 A Guide to Chi-Square Testing.John Wiley & Sons, New York.
Halldorsson, B. V., V. Bafna, R. Lippert, R. Schwartz, F. M. DeLa
Vegaet al., 2004 Optimal haplotype block-free selection of
tag-ging SNPs for genome-wide association studies. Genome Res.14:
1633–1640.
Jorde, L. B., 2000 Linkage disequilibrium and the search for
com-plex disease genes. Genome Res.10:1435–1444.
Lehmann, E. L., 1983 Theory of Point Estimation.John Wiley & Sons,
New York.
Neale, B. M., and P. C. Sham, 2004 The future of association
stud-ies: gene-based analysis and replication. Am. J. Hum. Genet.75:
353–362.
Nothnagel, M., 2002 Simulation of LD block-structured SNP
hap-lotype data and its use for the analysis of case-control data by
supervised learning methods. Am. J. Hum. Genet. 71(Suppl.):
A2363.
Pritchard, J. K., and P. Donnelly, 2001 Case-control studies of
as-sociation in structured or admixed populations. Theor. Popul.
Biol.60:227–237.
Risch, N., and K. Merikangas, 1996 The future of genetic studies
of complex human diseases. Science273:1516–1517.
Saito, S., M. Ikeda, N. Iwata, T. Suzuki, T. Kitajimaet al., 2005 No
association was found between a functional SNP in ZDHHC8 and schizophrenia in a Japanese case-control population. Neurosci.
Lett.374:21–24.
Serfling, R. J., 1980 Approximating Theorems of Mathematical Statistics.
John Wiley & Sons, New York.
Shifman, S., M. Bronstein, M. Sternfeld, A. Pisante-Shalom,
E. Lev-Lehmanet al., 2002 A highly significant association
be-tween a COMT haplotype and schizophrenia. Am. J. Hum.
Genet.71:1296–1302.
Tzeng, J. Y., B. Devlin, L. Wassermanand K. Roeder, 2003 On
the identification of disease mutations by the analysis of
haplo-type similarity and goodness of fit. Am. J. Hum. Genet. 72:
891–902.
Wang, W. Y., B. J. Barratt, D. G. Clayton and J. A. Todd,
2005 Genome-wide association studies: theoretical and
practi-cal concerns. Nat. Rev. Genet.6:109–118.
Xiong, M., J. Zhaoand E. Boerwinkle, 2003 Haplotype block
link-age disequilibrium mapping. Front. Biosci.8:a85–a93.
Yu, C., Y. Zhou, X. Miao, P. Xiong, W. Tanet al., 2004 Functional
haplotypes in the promoter of matrix metalloproteinase-2 pre-dict risk of the occurrence and metastasis of esophageal cancer.
Cancer Res.64:7622–7628.
Zhang, S., Q. Sha, H. S. Chen, J. Dongand R. Jiang, 2003
Trans-mission/disequilibrium test based on haplotype sharing for
tightly linked markers. Am. J. Hum. Genet.73:566–579.
Zhao, J., E. Boerwinkleand M. Xiong, 2005 An entropy-based
sta-tistic for genomewide association studies. Am. J. Hum. Genet.77:
27–40.
Communicating editor: N. Takahata
APPENDIX A
In the following, we show that any statistics arising from linear transformation will not change the values of pretransformation statistics. To illustrate this point, let
PAandPbe the allele (haplotype) frequencies in cases
and controls, respectively, DP ¼PAP be a vector of
differences in allele or haplotype frequencies between cases and controls,Sbe variance–covariance matrix of the vector of differencesDP, and A be a linear trans-formation matrix, where linear transtrans-formation of the allele or haplotype frequencies is expressed asAPAand AP, respectively. The popularly usedx2-test statistic can
be derived from the statistic
T ¼ ðPAPÞTSð
PAPÞ;
whereSis a generalized inverse of the matrixS. The difference in linear transformation of allele or haplotype frequencies between cases and controls can be written as
X ¼APAAP ¼ADP;
where A is assumed a nonsingular matrix. Then, the variance–covariance matrix is given by
L¼CovðX;XÞ ¼ASAT:
The new statistic resulting from transformation is
T ¼ ðADPÞTL
ADP ¼ ðDPÞTSD
P ¼T:
This shows that linear transformation of allele or hap-lotype frequencies will not change test statistics.
APPENDIX B
Below we show that a similarity measure of the ge-nome region is a quadratic function of allele or haplo-type frequencies. Therefore, similarity measure-based statistics are nonlinear test statistics. For simplicity of presentation, we consider only haplotype similarity. However, the conclusions, in general, hold for other types of similarity of the genome region. Suppose that the numbers ofHi haplotypes in the affected and
un-affected individuals arenA
i andni, respectively.nA;nG; PA
Hi, andPHi are defined as before. Then, we havePHi ¼
ni=2nG;PHAi ¼n A
i =2nA. LetGHi andG A
Hi be the similarity measure of the haplotype Hi in the unaffected and
affected individuals. LetSðHi;HjÞbe a measure of the
similarity between the haplotypeHiand the haplotype Hj. Then, the similarity measure of the haplotype Hi
in the unaffected individuals is given by
GHi ¼ ni 2nG
Xm
j¼1
nj
2nG
Let P¼ ½PH1;. . .;PHm T;
Si¼ ½SðHi;H1Þ;. . .;SðHi;HmÞ.
Then the above equation can be further reduced to
GHi ¼PHiSiP:
The similarity measure of all the haplotypes in the un-affected individuals, which is referred to as the overall similarity measure and denoted byG, is defined as the summation of the similarity measure of the individual haplotype, i.e., G¼Pm
i¼1GHi ¼
Pm
i¼1PHiSiP. Let S ¼ ðSðHi;HjÞÞm3m be a similarity matrix. We have S ¼
½ST 1;. . .;S
T
m
T
. Then,Gcan be written as
G¼ ½PH1;. . .;PHm S1
.. .
Sm
2 6 4
3 7
5P ¼PTSP:
Similarly, for the affected individuals, we have
GA¼ ðPAÞT
SAPA; wherePA,SA, andGA
are similarly defined as those for the unaffected individuals. Clearly, similarities mea-suresGHiandGare quadratic functions of the haplotype frequencies and hence are nonlinear transformations of the haplotype frequencies. Both the overall similarity measureGand the similarity measureGHi of the haplo-typeHican be used to construct association tests.
We first consider the overall similarity measure-based test statistic. LetS¼diagðPH1;. . .;PHmÞ PP
TandSA¼
diagðPA
H1;. . .;P
A
HmÞ P AðPAÞT
. The Jacobian matrix B
of the overall similarity measureG with respect to P is given by
B¼@G @P ¼2SP:
Similarly, we haveC ¼@GA=@PA¼2SPA. Let ˆG, ˆGA,Pˆ,
andPˆAbe the corresponding estimators ofG,GA
,P, and
PA, respectively. Then the variance of ˆGand ˆGAcan be
approximated by
varðGÞ ¼ˆ 1 2nG
BTSB¼ 2
nG
PTSTSSP;
varðGˆAÞ ¼ 1 2nA
CTSAC ¼ 2
nA
ðPAÞTðSAÞTSASAPA
(Lehmann1983). We define the overall haplotype sim-ilarity measure-based statistic as
Tos¼
ðGˆAGÞˆ 2 varðGÞˆ 1varðGˆAÞ:
This is similar to the similarity measure-based test sta-tisticDin Tzenget al.(2003), where the variances of ˆG and ˆGAare accurately calculated.
Now consider the haplotype similarity measure-based test statistic. LetGH ¼ ½GH1;. . .;GHl
T
,bii ¼@GHi=@PHi ¼
SðHi;HiÞPHi1
Pm
j¼1SðHi;HjÞPHj and bij¼@GHi=@PHj¼
PHiSðHi;HjÞ,B¼ ðbijÞl3m ðl#mÞ.G
A
H and the Jacobian
matrix C for the affected individuals are similarly defined. Let L¼ ð1=2nGÞBSBT1ð1=2naÞCSACT. We
define the haplotype similarity measure-based test sta-tistic as
Ts¼ ðGˆ A
H GˆHÞTLˆ
ðGˆAH GˆHÞ;
where ˆGAH;Gˆ, and ˆLare the estimators ofGA
H;G, andL,
respectively, and ˆL is the generalized inverse of the matrix ˆL. Letr ¼rankðLÞ; then, under the null hypoth-esis of no association between the haplotypes and the disease, the test statisticTsis asymptotically distributed
as a centralx2
ðrÞ. It is clear that both test statisticsTosand Tsare nonlinear test statistics. Therefore, the similarity
measure-based statistics are special cases of the non-linear test statistics.
APPENDIX C
Let fðPÞ be a vector-valued nonlinear function of random vector P. Assume that the nonlinear function
fðPÞ satisfies regularity conditions that ensure that Theorem 3.3A in Serfling (1980) holds. Then, fðPˆÞ is asymptotically distributed as a multivariate normal distributionNðfðPÞ;ð1=2nGÞCSCTÞ, where
cii¼
@fðPHiÞ
@PHi
; cij¼
@fðPHiÞ
@PHj
; C ¼ ðcijÞm3m;
S¼diagðPH1;. . .;PHmÞ PP
T:
Similarly,fðPˆAÞis asymptotically distributed asNðfðPAÞ;
ð1=2nAÞBS A
BTÞ, where
bii¼
@fðPHAiÞ @PHAi ; bij¼
@fðPHAiÞ
@PHAj ; B¼ ðbijÞm3m;
SA¼diagðPA
H1;. . .;P
A
HmÞ P
AðPAÞT:
Therefore, under the null hypothesis H0:PA¼P, which
implies fðPAÞ ¼fðPÞ, fðPˆAÞ fðPˆÞ is asymptotically
distributed asNð0;LÞ, where
L¼ 1 2nA
BSABT1 1
2nG
CSCT:
Let Z ¼fðPˆAÞ fðPˆÞ and r ¼rankðLÞ. Then, under
the null hypothesis, TN ¼ ZTLZ is asymptotically
distributed as a central x2
ðrÞ-distribution (Greenwood
and Nikulin 1996). The alternative hypothesis is Ha:
PA6¼P. Under the alternative hypothesis,T
Nis
asymp-totically distributed as a noncentral x2
ðrÞ-distribution
with the following noncentrality parameter:
lN¼ ½fðPAÞ fðPÞTL½fðPAÞ fðPÞ: ðC1Þ By Taylor expansion, we have
fðPAÞ fðPÞ CðPAPÞ11 2ðP
whereHl¼diagð0; . . .;f$ðPHlÞ;0. . .0Þ,l¼0;. . .;m,
ðPAPÞTHðPAPÞ ¼
ðPAPÞT
H1ðPAPÞ ..
.
ðPAPÞTH
mðPAPÞ
2 6 6 4 3 7 7 5:
Equation C2 can be rewritten as
fðPAÞ fðPÞ C½ðPAPÞ11 2C
ðPAPÞTHðPAPÞ
¼C½ðPAPÞ112CHðPAPÞðPAPÞ:
ðC3Þ
LetS ¼CHðPAPÞ;then
fðPAÞ fðPÞ CðI11 2SÞðP
A
PÞ: ðC4Þ
SubstitutingfðPAÞ fðPÞin Equation C4 into Equation
C1 yields
lN¼ ðPAPÞTðI112SÞTðCTLCÞðI112SÞðPAPÞ ¼ ðPAPÞTðI11
2SÞ T½CLð
CTÞðI112SÞðPAPÞ: ðC5Þ
Recall that
PAP ¼edHD and BC1HðPAPÞ; ðC6Þ where
dHD ¼ ½dH1D;. . .;dHmDT: Thus,
CLðCTÞ¼C 1
2nA
BSABT1 1
2nG
CSCT
ðCTÞ
¼ 1
2nA
CBSAðCBÞT1 1 2nG
S
¼ 1
2nA
ðI1SÞSAðI1SÞ1 1 2nG
S: ðC7Þ
Substituting Equations C6 and C7 into Equation C5, we obtain
lNe2dTHDðI112SÞ T 1
2nA
ðI1SÞSAðI1SÞ
1 1
2nG S
ðI11
2SÞdHD: ðC8Þ
Next we study geometric interpretation of the matrixS. LetgðPÞ ¼ ½Z1;. . .;Zm
T
, whereZi ¼fðPHiÞ. Define the following parameter equations:
PA ¼P1tDP:
Astvaries,gðPAÞ ¼gðP1tDPÞdefines a curveCin the
space. The tangent vector of the curveCat the pointP
is given by
dg
dt ¼
@g @PTDP;
where
@g @PT¼
f9ðPH1Þ 0 0
.. .
.. .
...
0 0 f9ðPHmÞ 2 6 4 3 7 5:
TakingZiði¼1;. . .;mÞas a new coordinate system, we
obtain the change rates of the tangent vector of the curve over new coordinates,
@ðdr=dtÞ @ZT ¼C
HDP ¼S;
where H ¼ H1 .. . Hm 2 6 4 3 7
5 and Hi ¼diagð0;. . .;f$ðHiÞ;. . .;0Þ:
The change rate of the tangent vector of the curve characterizes the strength of the nonlinearity of the nonlinear function (Bates and Watts 1980). The vectorShas the following form:
S¼diag f$ðPH1Þ f9ðPH1Þ
ðPHA
1PH1Þ;. . .;
f$ðPHmÞ f9ðPHmÞ
ðPHA
mPHmÞ
:
If the product terms of the haplotype frequencies are ignored, we obtainCLðCTÞ¼diagðL
1;. . .;LmÞ,
where
Li¼ 1 2nA
½11piðPHAiPHiÞ
2PA
Hi1
1 2nG
PHi;
pi¼f$ðPHiÞ f9ðPHiÞ
;
I11
2S ¼diagð11ðp1=2ÞðPHA1 PH1Þ; . . . ;11ðpm=2Þ
ðPA
Hm PHmÞÞ. Then, Equation C8 can be simplified to
lNe2
Xm
i¼1 d2H
iD½11ðpi=2ÞðP
A
HiPHiÞ
Li
¼e2X
m
i¼1
d2
HiD½11ðepi=2ÞdHiD
2 ð1=2nAÞð11ðepidHiD=2ÞÞ
2PA
Hi1ð1=2nGÞPHi
:
For the standardx2-test statistic, we havep
i ¼0. Thus,
its noncentrality parameter is given by
le2dT
HD
1 2nA
SA1 1 2nG
S
dHD
and
le2X
m
i¼1
d2H
iD
ð1=2nAÞPHAi1ð1=2nGÞPHi