Properties of Pavement Quality Concrete with
Partial Replacement of Fine Aggregates by
Iron Ore Tailings
Panditharadhya B J1, Sowmyashree T2, Manjunath C S 3, Siddu Karthik C S 4
Assistant Professor, Department of Civil Engineering, Vijaya Vittala Institute of Technology, Bangalore, India1
Assistant Professor, Department of Civil Engineering, Vijaya Vittala Institute of Technology, Bangalore, India2
Assistant Professor, Department of Civil Engineering, Vijaya Vittala Institute of Technology, Bangalore, India3
Assistant Professor, Department of Civil Engineering, Vijaya Vittala Institute of Technology, Bangalore, India4
ABSTRACT: Concrete is the basic material in all construction works and fine aggregates constitute more than 30% of the mix. But the procurement of natural sand is getting difficult day by day because of lack of natural source and environmental ill effects. From the stage of quarrying the raw materials to the completion of project has resulted in stripping of earth for the use of exhaustible resources and has caused an adverse effect on the nature. This has resulted in an acute shortage of fine as well as coarse aggregates, obligating to explore the replacement for these materials without compromising the quality, environmental and economic factors. In recent years, almost every mineral producing country is facing the problem of better utilization of mine waste because of its accumulation and lack of suitable storage space. In the present study Iron Ore Tailings (IOT) procured from KudremukhLakya Dam site (KIOCL Ltd.) are used as partial replacement to fine aggregates at levels of 10, 20, 30, 40 and 50 percent and the basic material properties, strength parameters are studied. It is found that as the IOT percentage increases in the mix workability is reduced. At 40percent replacement level the 28days compressive strength is more than the reference mix and other replacement percentage mixes. Flexural strength is observed maximum for reference mix. Quality of concrete mixes is found good from Ultrasound Pulse Velocity test). Flexural fatigue analysis is carried out on mix with 40percent IOT replacement at stress ratios 0.65, 0.7 and 0.75 compared with IRC model for number of repetitions using log normal distribution. Up to 0.7 stress ratio it showed more number of repetitions than IRC and at higher stress ratio mix with IOT achieved failure earlier.
KEYWORDS: Iron Ore Tailings, compressive strength, flexural fatigue, ultrasonic pulse velocity, stress ratio, IRC.
I. INTRODUCTION
India is one of the important iron ore producers and exporter in the world. However, the rapid growth in production, especially from large surface mines, have already caused ecological imbalance in their respective regions and emerge as the source of main environmental hazards. The waste/tailings that are ultra-fines or slimes, having diameter less than
150 μm, are not useful and hence are discarded. InIndia approximately 10 – 12 million tons of such mined ore is lost as
ore tailings in Lakya Dam, which was constructed as an ecological dam for this purpose.
The objectives of the study are as follows,
(1). Determining the properties of iron ore tailings and comparing the results with the conventional sand. (2). Partial replacement of iron ore tailings with the conventional sand.
(3). Determining the strength properties of concrete for 3, 7, 28 and 56days.
(4). Development of fatigue model by log normal distribution and comparing with IRC.
An attempt is made with Iron Ore Tailings as a partial replacement of fine aggregate in the concrete. The main aim of this section is to present an overview of research work carried out by various researchers in the field of Iron Ore Tailings and replacement of fine aggregates.
Aravindkumar.B.Harwalkar et al (2012) [1]studied onfatigue behavior of high volume fly ash concrete (HVFAC) and conventional concrete (PCC) under constant amplitude fatigue loading. Comparative studies on total number of 95 prism specimens of HVFAC and 100 prism specimens of PCC were tested under constant amplitude fatigue loading. All prism specimens were of size 75mm×100mm×500mm and were tested under flexural fatigue loading using haiver sine wave loading. Frequency of fatigue loading was kept at 4Hz. Studies indicated that lognormal model was acceptable for fatigue life distributions at all stress levels for both HVFAC and PCC. The parameters of distribution exhibited dependency on stress levels and type of concrete. Relations between stress level and fatigue life were developed for both HVFAC and PCC. These relations were found to be dependent on type of concrete. A total number of 24 prism specimens were tested under compound fatigue loading. It was found that Miner‟s hypothesis gives both unsafe and over safe predictions of failure. Miner‟s sum was found to be dependent on type of compound loading and sequence of loading.
Sujing Zhao et al (2014) [2]investigated that 100%replacement of natural aggregate by the tailings significantly decreased the workability and compressive strength of the material. Also showed, when the replacement level was no more than 40%, for 90 days standard cured specimens, the mechanical behavior of the tailings mixes was comparable to that of the control mix, and for specimens that were steam cured for 2 days, the compressive strengths of the tailings mixes decreased by less than 11% while the flexural strengths increased by up to 8% compared to the control mix. Concluded stiffness and hardness of the tailings were on average lower than those of the natural sand. Incorporation of the tailings into the mix increased the water demand and lowered the flow ability of the fresh material due to the high specific surface area and rough surface of the tailings.
II. MATERIALSANDMETHODOLOGY
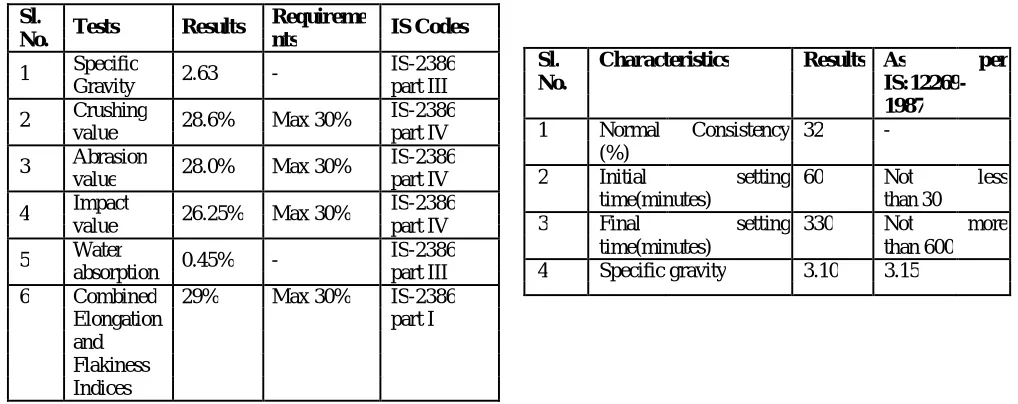
Cement:Ordinary Portland cement of Grade 53(Birla Super) conforming to IS: 12269-1987 is used in the present studies. The tests performed on this cement according to IS: 4031-1998 is summarized in Table 1.
Fine Aggregates: River sand conforming to IS: 383-1970 (reaffirmed 1997) is used for the present investigation as fine aggregate. Tests on sand as per IS specifications are conducted and results are as shown in Table 2.
Table 1: Properties of Cement Table 2: Properties of Fine Aggregates
Coarse Aggregates: Coarse aggregates are those which are retained on IS sieve size 4.75 mm. In the present study, aggregates of size 20mm and 10mm in the proportion 55 % and 45% by weight respectively are used. Proper grading of aggregates is essential to get required strength as per design mix. Tests results are tabulated in Table 3.
Iron Ore Tailings (IOT): Iron Ore Tailings are the materials left over, after the process of separating the valuable fraction from the worthless fraction of an ore. Tests on Iron Ore Tailings procured from Kudremukh, Lakya Dam site were conducted. The properties of the IOTs are indicated in Table 4.
Table 3: Properties of Coarse Aggregates Table 4: Physical Properties of Iron Ore Tailings Sl.
Characteristics Value No.
1 Specific gravity 2.53
2 Water absorption 0.88
3 Moisture content (%) 1.905
4 Fineness modulus 3.629
5 Grading zone Zone II
Sl. Characteristics Value No.
1 Specific gravity 3.33
2 Water absorption 3.97
3 Moisture content (%) 6
4 Fineness modulus 2.545
5 Grading zone
-Fig
Sl. Characteristics Results As per No.
IS:12269-1987
1 Normal Consistency 32
-(%)
2 Initial setting 60 Not less
time(minutes) than 30
3 Final setting 330 Not more
time(minutes) than 600
4 Specific gravity 3.10 3.15
Sl. Tests Results Requireme IS Codes
No. nts
1 Specific 2.63 - IS-2386
Gravity part III
2 Crushing 28.6% Max 30% IS-2386
value part IV
3 Abrasion 28.0% Max 30% IS-2386
value part IV
4 Impact 26.25% Max 30% IS-2386
value part IV
5 Water 0.45% - IS-2386
absorption part III
6 Combined 29% Max 30% IS-2386
Elongation part I
Figure 1: Iron Ore Tailings
Figure 1 shows the screened Iron Ore Tailings material. After sieve analysis test, the distribution of grain sizes are plotted and the particle size distribution curves for traditional river sand and Iron Ore Tailings are shown in figures 2 and 3. The difference of particle gradation between river sand and IOT is shown in graphs below.
Particle Size Distribution Curve - River Sand
100.00
P
a
ss
in
g 80.00
60.00
P
er
ce
n
tage
40.00
20.00
0.00
0.01 0.1 1 10
Sieve Size
Figure 2: Particle Size Distribution Curve For RiverSand Figure 3: Particle Size Distribution Curve For IOT
III. RESULTS AND DISCUSSIONS
The results of fresh properties of concrete such as slump and compaction factor are determined and hardened properties such as Compressive Strength, Ultrasound Pulse Velocity, Flexural Strength and fatigue life are presented and discussed below.
Rheology of Concrete: Fresh Concrete or Plastic Concrete is a freshly mixed material which can be moundedinto any shape. The relative quantities of cement, aggregate and water mixed together to control the properties of concrete in the wet state as well as in the hardened state.
Measurement of Workability: Tests adopted for measurement of workability in the present investigation are, 1. Slump Test
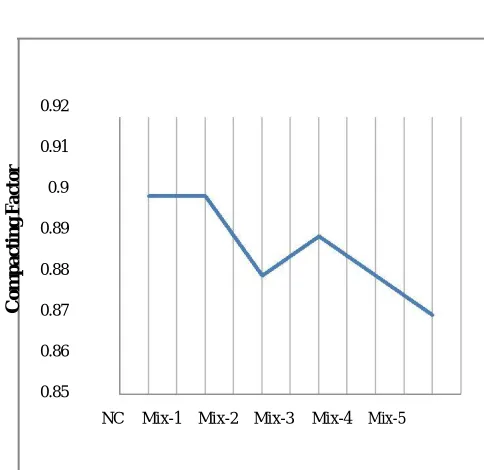
2. Compaction factor Test
Particle Size Distribution Curve-Iron Ore
Tailings
100
P
a
ss
in
g 80
60
P
er
ce
n
tage 40
20
0
0.01 0.1 1 10
Table 5: Workability Results
The results of slump and compaction factor tests are
as given in Table 5, which shows that workability is getting reduced with increase in IOT content.
Figure 4: Variability of Slump Value Figure 5: Variability of Compaction Factor
The above graphs show the fresh properties of concrete with IOT as fine aggregate and it can be observed that the workability is getting reduced with increase in IOT content. Further when it is needed to have higher slump values alternatives like superplastisizers can be preferred.
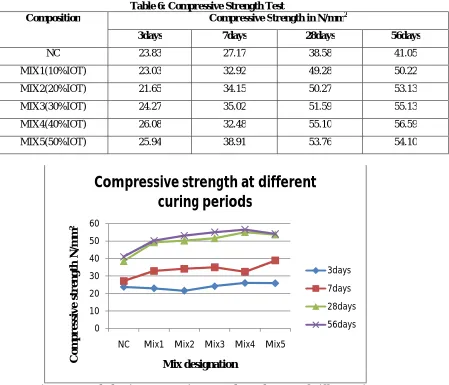
Compressive Strength Test: The cube specimens were tested in Compression Testing Machine after specified curing period for different percent of IOT replacement Mix1(10%IOT),Mix2(20%IOT),Mix3(30%IOT),Mix4(40% IOT) and Mix5(50%IOT) and for normal concrete mix. The compressive strengths after respective curing periods are noted in Table 6.
Designation Slump in mm Compacting Factor
NC 67 0.90
Mix1 55 0.90
Mix2 38 0.88
Mix3 25 0.89
Mix4 25 0.88
Mix5 23 0.87
80
70
60
in
m
m 50
40
F
lo
w
30
20
10
0
NC Mix-1 Mix-2 Mix-3 Mix-4 Mix-5
0.92
0.91
F
a
ct
o
r
0.9
C
om
p
a
ct
in
g 0.89
0.88
0.87
0.86
0.85
Table 6: Compressive Strength Test
Composition Compressive Strength in N/mm2
3days 7days 28days 56days
NC 23.83 27.17 38.58 41.05
MIX1(10%IOT) 23.03 32.92 49.28 50.22
MIX2(20%IOT) 21.65 34.15 50.27 53.13
MIX3(30%IOT) 24.27 35.02 51.59 55.13
MIX4(40%IOT) 26.08 32.48 55.10 56.59
MIX5(50%IOT) 25.94 38.91 53.76 54.10
Figure 6: Graph showing Compressive Strength Development of Different Mixes
The development of compressive strength for normal concrete mix and mixes with different IOT percentage is as shown in the above graph (Figure 6). This shows the higher compressive strength development for mix 4 with 40 % IOT replacement.
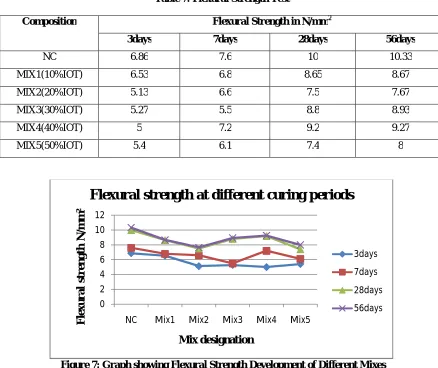
Flexural Strength Test: The specimens were tested in flexural testing machine as per IS codes and the flexural strength is calculated depending on the failure plane position from the supports. Values obtained for concrete with different IOT replacement levels and for the normal concrete mix are as note in Table 7.
The development of flexural strength for normal concrete mix and mixes with different IOT percentage is as shown in the below graph (Figure 7). This shows the higher flexural strength development for mix 4 with 40 % IOT replacement.
0 10 20 30 40 50 60
NC Mix1 Mix2 Mix3 Mix4 Mix5
C
om
p
re
ss
ive
s
tr
en
gt
h
N
/m
m
²
Mix designation
Compressive strength at different
curing periods
3days
7days
28days
Table 7: Flexural Strength Test
Composition Flexural Strength in N/mm2
3days 7days 28days 56days
NC 6.86 7.6 10 10.33
MIX1(10%IOT) 6.53 6.8 8.65 8.67
MIX2(20%IOT) 5.13 6.6 7.5 7.67
MIX3(30%IOT) 5.27 5.5 8.8 8.93
MIX4(40%IOT) 5 7.2 9.2 9.27
MIX5(50%IOT) 5.4 6.1 7.4 8
Figure 7: Graph showing Flexural Strength Development of Different Mixes
Ultrasound Pulse Velocity Test: This test is done to assess the quality of concrete by ultrasonic pulse velocity method as per IS: 13311 (Part 1) – 1992. The method consists of measuring the time of travel of an ultrasonic pulse passing through the concrete being tested. Comparatively higher velocity is obtained when concrete quality is good in terms of density, uniformity, homogeneity etc. The Basic formula for estimating the pulse velocity is given by, Pulse velocity = (Path length/Travel time).
Table 8: Interpretation of UPV Test Results Composition Pulse velocity(km/s) Grading
NC 4.25 GOOD
Mix1 3.83 GOOD
Mix2 4.28 GOOD
Mix3 4.31 GOOD
Mix4 4.30 GOOD
Mix5 4.23 GOOD
It is giving the grade of concrete for all the mix combinations as GOOD (Table 8), from the Ultrasound Pulse Velocity
0 2 4 6 8 10 12
NC Mix1 Mix2 Mix3 Mix4 Mix5
F
le
x
u
r
a
l
st
re
n
gt
h
N
/m
m
²
Mix designation
Flexural strength at different curing periods
3days
7days
28days
test results.
Derivation of Modulus of Elasticity from UPV Data:
The dynamic Young„s Modulus of Elasticity (E) may be determined from pulse velocity and dynamic Poisson„s Ratio (μ) from the following Equation obtained from IS:
13311-Part I-1992.
E = [ρ (1+ μ) (1-2μ) / (1- μ)]*V2
Where, E = Young„s Modulus in N/mm2ρ = Density of Concrete in kg/m3
μ = Poisson„s Ratio = 0.15 V = Pulse Velocity in m/s
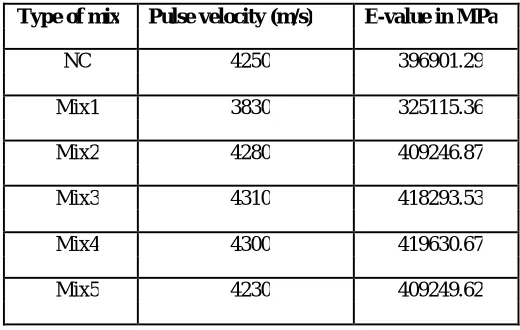
The E-values calculated using the above equation are given in Table 9.
Table 9: E values obtained from UPV Results Type of mix Pulse velocity (m/s) E-value in MPa
NC 4250 396901.29
Mix1 3830 325115.36
Mix2 4280 409246.87
Mix3 4310 418293.53
Mix4 4300 419630.67
Mix5 4230 409249.62
FLEXURAL FATIGUE TESTING:
The beam specimens are marked in the same way as for the static flexure test. The load cell is brought in contact with the loading frame placed on the specimen. The computer system and other instrumentations are kept ready. Specimen is marked with a chalk/pencil. The support points at 400 mm apart from the bottom and 133.33 mm from the top. The load is then applied on the frame by giving data entries in the computer.
DEVELOPMENT OF FATIGUE MODELS:
In the present investigations, the flexural fatigue tests are done on Conventional M30 grade concrete (PQC) with fine aggregates replaced with IOT. The prism specimens are of size 100X100X500 mm. The specimens are subjected to accelerated half sine wave form of cyclic loading tests at three stress levels 65%, 70% and 75% of static flexure load results got by the Static Flexural Strength with a rest period of 1s and frequency of load application being 2 Hz i.e., two cycles per second. Prediction of fatigue life using statistical models is attempted for Log Normal Distribution.
The flexural static failure loads are obtained as average flexural strength of three specimens and the values are shown in Table 10. The number of repetitions to failure of Concrete at different stress levels is given in Table 11.
Table 10: Fatigue Loads at different Stress Ratios Type Flexural SR=0.65 SR=0.7 SR=0.75 of mix Load
Table 11: Fatigue Testing Results for Mix 4
Sl. No. of repetitions to failure
No. SR=0.65 SR=0.7 SR=0.75
1 86 38 15
2 780 263 184
3 1164 454 240
4 3918 1234 508
5 4900 1580 592
6 8706 3785 1910
7 10352 6254 2722
8 18132 9880 4724
9 25468 17524 9382
Log Normal Distribution Model: A Log Normal Distribution model which is also a linear regression model of the form (Y=aX+b) was attempted using present experimental results in which stress ratio (SR) was taken on Y-axis and Log (N) values were taken on X-axis. The scatter diagram and the linear relationship have been shown in Figure 8. The linear regression model considering all the values are given by Equation 1.
y = -0.0165x + 0.7525………. (1) With R² = 0.1123, R² being the Regression Co-Efficient In this case, y = S, the stress ratio and x = Log N. Then the equation becomes
Log N=
0165
.
0
7525
.
0
SR
Figure 8: Relationship between Stress Ratio (SR) and number of repetitions N
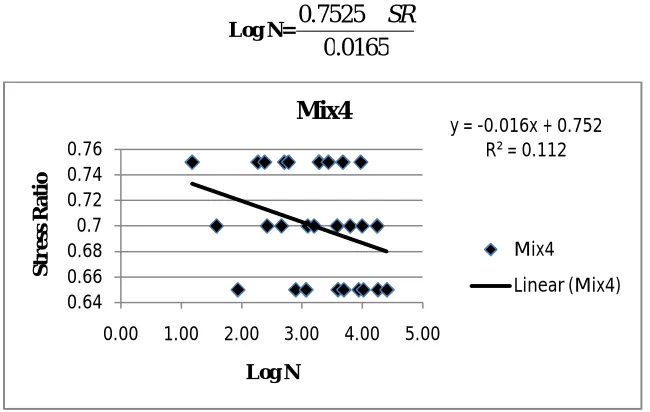
From the results obtained for 9 specimens in the Linear Regression Model shown above, the R2 value obtained was 0.1123 which clearly indicates that there is a lot of scatter among the number of repetitions. Applying the correction by omitting lowest values, Linear Regression model considering 6 specimens per stress ratio was developed. The corrected model is shown in Equation 2 and the relation is shown in Figure 9.
y=-0.0492x+0.8795………. (2) With R² = 0.3332
Log N=
0492
.
0
8795
.
0
SR
y = -0.016x + 0.752 R² = 0.112
0.64 0.66 0.68 0.7 0.72 0.74 0.76
0.00 1.00 2.00 3.00 4.00 5.00
S
tr
e
ss
R
ati
o
Log N
Mix4
Mix4
Figure 9: Relationship between Stress Ratio (SR) and number of repetitions N with omitted Values Fatigue Equation as Per IRC 58:2011
Due to repeated application of flexural stresses by the traffic loads, progressive fatigue damage takes place in the cement concrete slab in the form of gradual development of micro-cracks especially when ratio between the applied flexural stress and the flexural strength of concrete is high. This ratio is termed as stress ratio (SR). If the stress ratio is less than 0.45, the concrete is expected to sustain infinite number of repetitions. As the SR increases the number of load repetitions required to cause cracking increases. The fatigue equation given by IRC: 58 - 2011 code is used to compare the developed linear regression model for Mix4 (40% IOT). The models suggest by IRC are shown below,
N = Unlimited for SR < 0.45 N=
268 . 3
4325
.
0
2577
.
4
SR
Where 0.45≤ SR ≤ 0.55
Log10N=
0828
.
0
9718
.
0
SR
Where SR > 0.55
Similarly for Mix4 with SR being > 0.55, the equation becomes
Log10N=
0492
.
0
8795
.
0
SR
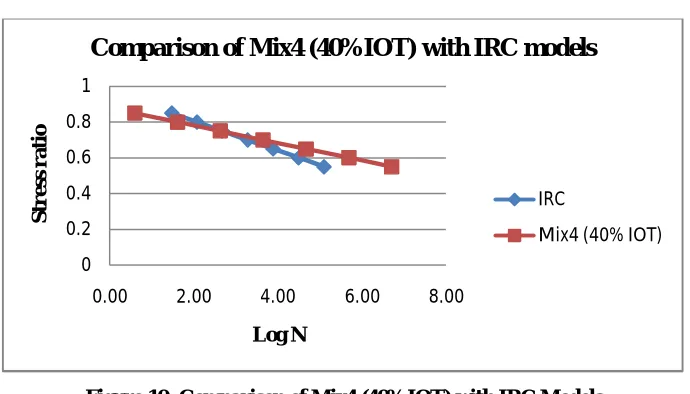
Table12: Comparison of No. of Repetitions to Failure of both the Models SR No. of repetitions to failure
IRC Mix4 (40% IOT) 0.55 124223 4979142
0.6 30927 479617
0.65 7700 46199
0.7 1917 4450
0.75 477 429
0.8 119 41
0.85 30 4
y = -0.049x + 0.879 R² = 0.333
0.6 0.65 0.7 0.75 0.8
0 2 4 6
S
tr
e
ss
R
ati
o
Log N
Mix4
Mix4
Figure 10: Comparison of Mix4 (40%IOT) with IRC Models
All test data for Mix4 is used to compare the number of repetition to failure with IRC model. The comparison is shown in Table 12 and Figure 10.
VI.CONCLUSIONS
From the tests conducted on materials for assessing properties and tests on hardened concrete to arrive at strength properties such as compressive and flexural strengths, the following conclusions are made.
1. As the IOT percentage increases workability of mix reduces hence for better workability use of super-plasticizers is recommended.
2. Replacement of 40% IOT gives maximum compressive strength which is more than the reference mix (NC) and other replacement percentages.
3. Reference mix shows maximum flexural strength more than the IOT replaced mixes.
4. The number of repetitions to failure obtained for Mix 4 is more than IRC (reference mix NC) up to 0.7 stress ratio. This shows that IOT replaced concrete can be used for pavements; in particular it is recommended for village roads with lower traffic loads.
REFERENCES
[1] Aravindkumar.B.Harwalkar and Dr.S.S.Awanti “Fatigue Behavior Of High Volume Fly Ash Concrete Under Constant Amplitude And Compound Loading”
International Journal of Civil Engineering and Technology (IJCIET),Volume 3, Issue 2,pp.404-414, July- December 2012.
[2] SujingZhao ,Junjiang Fan, Wei Sun “Utilization of iron ore tailings as fine aggregate in ultra-high performance concrete”, Construction and Building Materials 50, pp.540–548, 2014.
[3] Xiaoyan Huang; Ravi Ranade and Victor C. Li, F.ASCE “Feasibility Study of Developing Green ECC Using Iron Ore Tailings Powder as Cement
Replacement” Journal Of Materials In Civil Engineering 25:923-931, 2013.
[4] Dr. L R Kadyali, Dr. N B Lal “Principles and Practices of Highway Engineering”.
[5] IRC:44-2008 Guidelines for cement concrete mix design for pavements, Indian Roads Congress, New Delhi.
[6] IRC:15-2011 Standard Specifications and code of practice for Construction of Concrete Roads, 4th Revision, Indian Roads Congress, New Delhi.
[7] IRC:58-2011, Guidelines for the Design of Plain Jointed Rigid Pavements for Highways, Indian Roads Congress, New Delhi.
[8] IS:516-1959 Methods of tests for strength of concrete, Bureau of Indian Standards, New Delhi.
[9] IS:2386(part I -1963) particle size and shape, Bureau of Indian Standards, New Delhi.
[10] IS:2386(part III-1963) specific gravity ,density ,voids ,adsorption and bulking, Bureau of Indian Standards, New Delhi.
[11] IS:12269-1987 (Second Revision) [Reaffirmed in 1999], Specifications for Ordinary Portland Cement 53 grade, Bureau of Indian Standards, New Delhi.
[12] IS:456-2000 Code of Practice for plain and reinforced cement concrete, (fourth revision) [Reaffirmed in 2002], Bureau of Indian Standards, New Delhi.
[13]
IS:10262-2009 Concrete mix proportioning-Guidelines (First Revision), Bureau of Indian Standards, New Delhi.0 0.2 0.4 0.6 0.8 1
0.00 2.00 4.00 6.00 8.00
S
tr
e
ss
r
ati
o
Log N
Comparison of Mix4 (40%IOT) with IRC models
IRC