ABSTRACT
KARAHAN TOPRAKCI, HATICE AYLIN. Piezoresistive Properties of Polyvinyl Chloride Composites. (Under the direction of Dr. Tushar K. Ghosh and Dr. Richard J. Spontak.)
Textile based sensors provide an interface between the user and the electronic system by converting any type of physiological or environmental signal into electrical signals. Common applications include health monitoring, rehabilitation, multimedia, and surveillance.
In this research we demonstrate fabrication of piezoresistive sensors on textile fabrics through application of a screen-printed conductive nanocomposite layer of plasticized poly(vinyl chloride) (PVC), and carbon nanofiber (CNF). In order to understand the behavior of conductive plastisol, morphological, mechanical and electrical properties of composite films were investigated for different molecular weights of PVC. Homogeneous filler dispersion and good filler/polymer interphase were observed without any dominant filler orientation. Mechanical and electrical properties were found to be affected by CNF, plasticizer content and matrix molecular weight. CNFs were found to provide substantial bridging in the matrix and enhance strength. These nanostructured composite sensors were found to be sensitive under different levels of strain which can be monitored by change in electrical resistance.
Pizoresistive Properties of Polyvinyl Chloride Composites
by
Hatice Aylin Karahan Toprakci
A dissertation submitted to the Graduate Faculty of North Carolina State University
in partial fulfillment of the requirements for the degree of
Doctor of Philosophy
Fiber & Polymer Science
Raleigh, North Carolina 2012
APPROVED BY:
_____________________________ _____________________________ Dr. Tushar K. Ghosh Dr. Richard J. Spontak
Chair of Advisory Committee
DEDICATION I dedicate this dissertation;
To my wonderful family, this accomplishment was impossible without their endless support, prayers and inspiration.
To the memory of my grandmother, Ayse Demirel, who emphasized the importance of education and helped me throughout her life and taught me whatever she knew without any expectation. She is the meaning of patience in my life.
To my parents, Hicran and Erdogan Karahan, who have been my role-model for hard work, tolerance, personal sacrifices, and have always encouraged me to think in a different and constructive way to follow my dreams.
To my sister, Aysen Karahan, who has been my endless support from the day I learnt to stand on my feet and has been my role-model for rationale thinking and imagination. She is the meaning of trust in my life.
BIOGRAPHY
ACKNOWLEDGMENTS
I express my gratitude to my advisor, Dr. Tushar K. Ghosh for letting me work with him on this amazing project. Under his tutelage, I took a leap forward in the world of science. From him, I learnt the art of conducting scientific investigation. He has been the cardinal support system for me in terms of knowledge and patience throughout my project. I thank him from the bottom of my heart for his motivation and encouragement.
I extend my gratitude to Dr Richard J. Spontak. Under his mentorship, I have learnt to view things in a scientific light. His methodical guidance has always been and will always remain a source of inspiration for me. His novel ideas and his all-out encouragement played an overwhelming role in shaping my scientific outlook for the rest of my life.
I am grateful to Dr. Hoon Joo Lee, Dr. Paul D. Franzon, and Dr. Alexander Deiters for their willingness to be on my committee.
I am grateful to Dr. Russell E. Gorga and Dr. Wendy Krause for letting me use their DMA and rheometer facility. I would also like to thank Nags for helping me out with the DMA and rheology measurements. In addition, I thank Mr. Chuck Mooney and Ms. Birgit Anderson for their assistance with SEM and FTIR analysis respectively. Furthermore, I thank Mr. Hai Bui and Mr. Dzung Nguyen (Win) for their prompt assistance whenever required. Moreover, I am thankful to Ms. Angie Brantley, Ms. Traci Figura and Ms. Vicky Stockdale for making my stay here smooth and hurdle free through their help and cooperation by ensuring that I don’t miss any deadlines.
I would like to thank Showa Denko Corporation for vapor grown carbon nanofibers and Solvay Company for polyvinyl chloride resins.
I would also like to thank my lab mates Saral and Krishna in Dr. Ghosh’s research group for their friendship, motivation and words of encouragement. Special note of thanks to Polymer Morphology Group for their constant support.
I would like to thank my friends Elif and Derya and other friends and teachers in Turkey for their endless support and making my stay here at Raleigh so lovely and memorable.
I would also like to thank Partha for his friendship, support, positive energy, respect and prayers.
I also would like to thank Marie Skłodowska Curie whose life helped me to understand the meaning of dedication to science.
I would like to thank to Fikret Kizilok, who has been always with me with his amazing music.
TABLE OF CONTENTS
LIST OF TABLES ... ix
LIST OF FIGURES ... x
CHAPTER 1. INTRODUCTION ... 1
References ... 4
CHAPTER 2. PIEZORESISTIVE BEHAVIOR OF POLYMER COMPOSITES ... 5
Abstract ... 5
2.1 Polymer Based Electronics (Organic Electronics) ... 6
2.2 Electrically Conducting Polymers ... 7
2.2.1 Intrinsically Conducting Polymers (ICPs) ... 9
2.2.2 Conducting Polymer Composites (CPCs) ... 11
2.2.2.1 Mechanism of electrical conduction and percolation behavior in conducting polymer composites ... 12
2.2.2.2 Factors affecting the conductivity in conducting polymer composites ... 18
A) Filler properties ... 18
B) Matrix properties ... 26
C) Process parameters ... 30
D) Other factors ... 35
2.3 Piezoresistivity and Piezoresistive Composites ... 36
2.3.1 Application of Piezoresistive Composites ... 40
2.3.2 Factors Affecting the Piezoresistance ... 52
2.3.2.1 Filler properties ... 52
2.3.2.2 Filler concentration ... 62
2.3.2.3 Matrix properties ... 69
Conclusions ... 72
References ... 74
CHAPTER 3. TEXTILE BASED SENSORS ... 89
Abstract ... 89
3.1 Introduction ... 89
3.2 Principles of Sensing... 91
3.2.1 Capacitive Sensors ... 93
3.2.3 Piezoelectric Sensors ... 95
3.2.4 Optical Sensors ... 96
3.2.5 Chemical Sensors ... 97
3.2.6 Piezoresistive Sensors ... 98
3.3 Textile Based Sensors ... 99
3.3.1 Textile Based Capacitive Sensors ... 99
3.3.2 Textile Based Inductive Sensors ... 108
3.3.3 Textile Based Piezoelectric Sensors ... 112
3.3.4 Textile Based Optical Sensors ... 119
3.3.5 Textile Based Chemical Sensors ... 123
3.3.6 Textile Based Piezoresistive Sensors ... 127
Conclusions ... 161
References ... 162
CHAPTER 4. MECHANICAL BEHAVIOR OF CARBON NANOFIBER FILLED PLASTICIZED POLYVINYL CHLORIDE ... 170
Abstract ... 170
4.1 Introduction ... 170
4.2 Materials and Methods ... 171
4.3 Results and Discussion ... 173
4.3.1 Morphology... 173
4.3.2 Mechanical Behavior ... 174
4.3.3 Dynamic Mechanical Analysis ... 184
Conclusions ... 187
References ... 189
CHAPTER 5. ELECTRICAL CHARACTERIZATION of CARBON NANOFIBER FILLED PLASTICIZED POLYVINYL CHLORIDE ... 192
Abstract ... 192
5.1 Introduction ... 192
5.2 Materials and Methods ... 195
5.3 Results and Discussion ... 198
5.3.1 Morphology... 198
5.3.2.1 Resistivity ... 199
5.3.2.2 Piezoresistance ... 206
A) Effect of filler concentration on piezoresistive response ... 214
B) Effect of PVC/DOS ratio on piezoresistive response ... 216
Conclusions ... 220
References ... 221
CHAPTER 6. PIEZORESISTIVE FABRIC BASED SENSORS ... 226
Abstract ... 226
6.1 Introduction ... 226
6.2 Materials and Methods ... 230
6.3 Results and Discussion ... 233
6.3.1 Morphology... 233
6.3.2 Electrical properties ... 235
6.3.2.1 Resistivity ... 235
6.3.2.2 Piezoresistance ... 240
Conclusions ... 248
References ... 249
LIST OF TABLES Table 5.1 t, ϕc and R2
LIST OF FIGURES
Figure 2.1 Classification of materials based on their conductivity ... 7
Figure 2.2 Band theory model for (a) insulators (b) semiconductors and (c) metals ... 8
Figure 2.3 Bond (a, b) and site (c, d) percolation ... 14
Figure 2.4 General behavior of a composite material conductivity vs. filler concentration .. 15
Figure 2.5 Fillers with different aspect ratios (a and b, c), fillers with different aspect ratio and same concentration (a and c) ... 19
Figure 2.6 Effect of filler aspect ratio on the critical filler concentration ... 20
Figure 2.7 Carbon black with different structures ... 21
Figure 2.8 Effect of concentration for different fillers ... 22
Figure 2.9 Effect of filler type and concentration on conductivity ... 23
Figure 2.10 Effect of surface functionalization on filler dispersion ... 25
Figure 2.11 Selective localization of CB in a polymer blend ... 30
Figure 2.12 Effect of solvent on the formation of conducting network ... 32
Figure 2.13 Piezoresistance caused from dimensional change ... 38
Figure 2.14 Positive piezoresistance ... 41
Figure 2.15 Negative piezoresistance ... 42
Figure 2.16 Effect of strain and strain rate on 10 wt% CB filled silicone rubber composites ... 42
Figure 2.17 Effect of strain rate on the relative resistivity of different nitrile-rubber composites CF6 (SCF) and XF4 (SCF+CB): ( - - - ) 0.04 min-1 and ( __ ) 0.02 min-1... 43
Figure 2.18 Effect of strain and strain rate on electrical resistivity during loading and unloading cycle of SCF/EVA composites ... 43
Figure 2.19 Effect of strain and strain rate on electrical resistivity during loading and unloading cycle of CB/EVA composites ... 44
Figure 2.20 Piezoresistive behavior of unidirectional continuous carbon fiber reinforced epoxy [0°]. ... 44
Figure 2.21 Piezoresistive behavior of cross-ply [0°/90°] continuous carbon fiber reinforced epoxy ... 45
Figure 2.22 Positive piezoresistance for different types of fillers under compression ... 46
Figure 2.23 Negative piezoresistance for different types of fillers under compression ... 46
Figure 2.24 Effect of pressure on the piezoresistive behavior of CB filled rubber composites ... 48
Figure 2.25 Time dependence of piezoresistance for the sample (vol 30%) of Sn–Pb/PE under various stresses ... 48
Figure 3.1 Mechanism of sensors ... 92
Figure 3.2 Capacitive sensor based on spacing variation ... 93
Figure 3.3 Capacitive sensor based on area variation ... 94
Figure 3.4 Inductive sensor and sensing mechanism ... 95
Figure 3.5 Mechanism of piezoelectric sensing ... 96
Figure 3.6 Mechanism of optical sensors... 97
Figure 3.7 Mechanism of chemical sensors ... 98
Figure 3.8 Mechanism of piezoresistive sensors ... 98
Figure 3.9 Diagram of the capacitor array ... 100
Figure 3.10 Smart fabric ... 100
Figure 3.11 Palm of a hand ... 101
Figure 3.12 (a) Amplitude spectra of an electrode pair (b) phase spectra of an electrode pair ... 101
Figure 3.13 Scheme of the capacitive pressure sensor (top and bottom electrode of conductive textile (1, 3), compressible spacer fabric (2), and shielding layer (4)) ... 102
Figure 3.14 Muscle activity of biceps and triceps ... 103
Figure 3.15 Schematic diagrams for the active electrodes... 103
Figure 3.16 Capacitive sensory systems for respiration monitoring ... 104
Figure 3.17 Respiration graph A: 30 s normal breathing, B: 10 s deep breath, C: 15 s normal breathing, D: 10 s panting, E: 20 s normal breathing ... 105
Figure 3.18 (a) Humidity sensor and (b) humidity sensors integrated to textiles ... 105
Figure 3.19 Sweat monitoring belt ... 106
Figure 3.20 Response of textile sweat rate sensor compared to commercial vapometer ... 106
Figure 3.21 Sensory system ... 107
Figure 3.22 Three different placements of the sensory system (chest, wrist and neck) ... 107
Figure 3.23 Signals from the neck electrodes left: chewing a piece of bread and swallowing, middle: swallowing 15ml of water, right: different head position ... 107
Figure 3.24 Signals from upper leg electrodes (front middle, front up, side and back) during a modes of locomotion experiment (left), signals from lower arm and wrist electrodes during a movement sequence (right) ... 108
Figure 3.25 Basic geometric layout of the conductor for magnetic induction in single-plate sensor. (a) spiral (b) solenoid type (conductors on both sides) (c) meander type (d) zigzag type, and (e) sinusoid type ... 109
Figure 3.26 Knitted coils ... 109
Figure 3.27 (a) Respiratory monitoring system made by knitted coils and (b) voltage change during breathing ... 110
Figure 3.29 Normalized induced voltage of the coil-2 when coil-1 maintaining a constant
voltage value ... 111
Figure 3.30 Inductive sensors with (a) four lines of zigzag pattern and (b) two lines of zigzag pattern ... 111
Figure 3.31 Simulated breathing signals during 4 seconds by stretching and relaxing the sensor by hand... 112
Figure 3.32 Sensor arrangement and e-glove... 113
Figure 3.33 Voltage response of flex and tap ... 114
Figure 3.34 Electrospun sensors with different CNT content ... 114
Figure 3.35 Comparison between plain copolymer sensor and CNT-based sensors, PZT input: 160 V at 175 rad second-1 PVDF ... 115
Figure 3.36 Sketch of the sensory system ... 115
Figure 3.37 Extraction of respiratory cycle information from PVDF film sensor signals, (a) the original signal from PVDF film sensor, (b) the extracted respiratory cycle waveform and (c) the signal from the pneumography sensor for comparison (left). Extraction of heartbeats information from PVDF film sensor signals, (a) the original PVDF film sensor signal, (b) the extracted heartbeats information and (c) 3-lead ECG sensor signal (right) ... 116
Figure 3.38 Car seat structure and fabric structure for cap components ... 117
Figure 3.39 Change in phase angle as a function of pressure for different laminates ... 117
Figure 3.40 E-textile pants ... 118
Figure 3.41 Atlas woven fabric by flexible optical fibers and cotton ... 120
Figure 3.42 (a) Woven optical sensor under bending process and (b) response of the system as a function of transmitted power & curvature of fabric ... 120
Figure 3.43 (a) Knitted optical sensor under strain (b) response of the system as a function of transmitted power and strain ... 121
Figure 3.44 Chest band and strain sensor located at elbow/knee ... 121
Figure 3.45 Sensory system ... 122
Figure 3.46 Optical fiber embedded textile sensor and corresponding cycle of power variation ... 122
Figure 3.47 (a) FBG stitched textile sensor and (b) cycle of power variation ... 123
Figure 3.48 (a) Textile based pH sensor and (b) outcome as a function of light intensity vs. pH ... 124
Figure 3.49 (a) Fluid handling system and (b) pH sensor and optical detection system ... 125
Figure 3.50 (a) pH, conductivity and sodium sensors (b) outcomes of pH sensor during exercise ... 125
Figure 3.51 (a) Sodium activity during exercise trial (b) sodium activity and change in conductivity during in vitro trials ... 126
Figure 3.71 Flexion-extension of the central sensor of KB (continuous curve) and signal
coming from the shoe sensor (dashed curve) which marks the gait cycle ... 141
Figure 3.72 (a) Piezoresistive fabric sensor and (b) its piezoresistive behavior ... 142
Figure 3.73 (a) The arrangement of the marker on body of the athlete (b) the model obtained by using experimental set-up ... 142
Figure 3.74 Flexion-extension angles of the hip (θ1) and knee (θ2) of the left leg in two different trials. The red line is the SMART-e output, while the blue one represents the sensing garment response ... 143
Figure 3.75 (a) Schematic diagram of the pressure sensor and sensor packages, (b) integrated textile sensors on insole ... 143
Figure 3.76 Piezoresistive behavior of pressure sensors as a function of (a) pressure and (b) time ... 144
Figure 3.77 (a) Weft knitted fabric and (b) the knitted stitch ... 144
Figure 3.78 Textile sensors from knitted fabric ... 145
Figure 3.79 Electroconductive fiber path ... 146
Figure 3.80 (a) Resistance change in wale direction (b) resistance change in course direction ... 146
Figure 3.81 Loop extension and recovery in different directions ... 147
Figure 3.82 Prototype model ... 147
Figure 3.83 (a) Signals in basal condition, D1, D2, D3 Einthoven leads I, II, III. V2, V5: standard precordial leads V2 and V5. Th-R, Ab-R: respiration sensors on thoracic and abdominal position respectively. Sh-M, Eb-M: movement sensors on the left shoulder and elbow, respectively (b) signals obtained during flex-extension of the left elbow ... 148
Figure 3.84 (a) Movement sensors located on shoulder and elbow (b) signals obtained during abduction-adduction of the left shoulder, D1, D2, D3 Einthoven leads I, II, III. V2, V5: standard precordial leads V2 and V5. Th-R, Ab-R: respiration sensors in thoracic and abdominal positions, respectively. Sh-M, Eb-M movement sensors on the left shoulder and elbow, respectively ... 148
Figure 3.85 Knitted sensing t-shirt for monitoring abdominal and thoracic respiration ... 149
Figure 3.86 (a) Signals obtained from piezoresistive fabric sensor (upper) and biopac pneumograph (lower) during normal respiration (b) comparison of thoracic (upper) and abdominal (lower) respiration signal by fabric sensors (1-normal, 2- predominantly abdominal, 3-thoracic repiration) ... 150
Figure 3.87 Tubular knitted fabric (a) steel (b) carbon and (c) single warp steel and carbon knitted fabric ... 150
Figure 3.88 Piezoresistive response of (a) tubular steel (2a) tubular carbon (3a) single warp steel (4a) single warp carbon ... 151
CHAPTER 1. INTRODUCTION
Recently, increasing demand of mobile devices opened a new era for wearable electronics. Textiles constitute an ideal choice as platforms for wearable devices, since they are flexible, lightweight, and can be worn everywhere in many forms. This class of textiles with electronic capabilities has been referred to as electronic textiles (e-textiles). Depending on the type and application, e-textiles may be capable of sensing, data processing, actuation, and energy storage or generation. Among all these, textile-based sensing has become an active area of research in the emerging field of e-textiles. Textile based sensors provide an interface between the user and an electronic system by converting physiological or environmental signals into electrical signals. Truly, wearable garments may be capable of monitoring variables such as strain, pressure, temperature, displacement, humidity, etc., and can be used in many applications including medical rehabilitation, health monitoring, communication, entertainment, sports, space, firefighting, security, and surveillance.
colorants, modifiers, fillers [1-3]. Depending on the composition and mechanical properties, PVCs can be classified into two main categories as rigid and plasticized PVCs. While, unplasticized PVCs are known as rigid PVCs; plasticized ones are referred as flexible PVCs [1,2]. Plastisol is a multiphase, paste-like composition obtained by the suspension of PVC resin in a suitable plasticizer with other additives such as thermal stabilizers and fillers [4-6]. Plasticizer is the key component of the plastisol and it determines both processing (viscosity, glass transition temperature, etc.) and end-use properties (i.e., flexibility) of the composition. Plasticizer characteristics, such as, polarity, molecular weight, chain length and linearity, viscosity, weight fraction, etc. can be used to tune these properties [7]. An effective plasticization is achieved when a homogeneous distribution of the plasticizer within the resin occurs thereby reducing the interaction between the polymer chains so that they can move easily. Phthalates, sebacates, phosphates and epoxies, are the common plasticizers for PVC [1,5,7-9].
The research presented here, is aimed at development of textile based piezoresistive sensors with tunable electrical and mechanical properties. This innovative approach includes use of conductive plastisol composite whose properties can be controlled by tailoring the system components and other parameters.
The dissertation is organized in different chapters each of which represents an article. All chapters, with the exception of 1 and 7, is written in the form of review or research articles. A short description of each is provided below.
Chapter 1. Introduction to conductive and piezoresistive composites and outline of the thesis Chapter 2. Includes review of the recent literature on conductive polymer composites with particular focus on piezoresistive polymer composites.
Chapter 3. Includes a detailed review of textile based sensors (TBS). Various TBSs are classified based on their working principles, advantage, and limitations.
Chapter 4. Describes the fabrication and mechanical characterization of carbon nanofiber-filled polyvinyl chloride (PVC) composites.
Chapter 5. Detailed account of fabrication and electrical properties of carbon nanofiber-filled polyvinyl chloride (PVC) composites are explored here.
References
[1] Titow WV. PVC technology. London ; New York: Elsevier Applied Science, 1984. [2] Wilkes CE. PVC handbook. Munich ; Cincinnati, Ohio: Hanser, 2005.
[3] Nass LI. Encyclopedia of PVC. New York: Marcel Dekker, 1998.
[4] Nakajima N, Harrell ER. Rheology of PVC plastisol: Particle size distribution and viscoelastic properties. J Colloid Interface Sci 2001;238:105-15.
[5] Grossman RF. Handbook of vinyl formulating. Hoboken, N.J.: Wiley-Interscience, 2008. [6] Cadogan DF, Howick CJ. Plasticizers. John Wiley & Sons Inc., 2000.
[7] Wypych G. Handbook of plasticizers. Toronto; New York: ChemTec Pub.; William Andrew Pub, 2004.
[8] Ritchie PD. Plasticisers, stabilisers and fillers. London, Iliffe Books for the Plastics Institute, 1972.
[9] Edenbaum J. Plastics additives and modifiers handbook. New York: Van Nostrand Reinhold, 1992.
[10] Koo JH. Polymer nanocomposites : processing, characterization, and applications. New York: McGraw-Hill, 2006.
[11] Advani SG. Processing and properties of nanocomposites. Singapore: World Scientific Publishing, 2007.
[12] Lozano K, Bonilla-Rios J, Barrera EV. A study on nanofiber-reinforced thermoplastic composites (II): Investigation of the mixing rheology and conduction properties. J Appl Polym Sci 2001;80:1162-72.
[13] Lozano K, Barrera EV. Nanofiber-reinforced thermoplastic composites. I. Thermoanalytical and mechanical analyses. J Appl Polym Sci 2001;79:125-33.
CHAPTER 2. PIEZORESISTIVE BEHAVIOR OF POLYMER COMPOSITES
Abstract
Polymers are preferred in many applications because of their desirable properties, such as strength, toughness, lightweight and facile process ability. However the vast majority of the polymers are electrically insulating and used extensively as electrical insulators. In order to expand their applications, electrical conductivity is engendered by incorporating various conductive fillers including nanoparticles into their structure. Polymeric nanocomposites that are filled with conducting nanoparticles have received great attention with regard to their functional structures. Lower percolation threshold and improved mechanical properties are the most important contributions of nanofillers which are stemmed from their high aspect ratio and high surface area. They have wide range of applications including static electricity discharging, electromagnetic interference shielding, conducting adhesives, self-regulating heaters and piezoresistive sensors.
2.1 Polymer Based Electronics (Organic Electronics)
field-effect transistors (OFETs), solar cells and sensors [1,3,4,9,10]. Especially sensor applications are of increasing importance because of their wide range of usage for many areas.
2.2 Electrically Conducting Polymers
Most polymers are insulating and are used extensively as electrical insulators. However, there are two major classes of conducting polymers that have been developed over the last fifty years and are currently used in many applications. They include intrinsically conducting polymers and conducting polymer composites. A major breakthrough in the area of conductive polymers,the discovery that polyacetylene could be easily oxidized (by electron acceptors) or reduced (by donors) in 1971 [11], lead to an entirely new field of intrinsically conductive polymers. In conducting polymer composites, an electrically conducting phase is dispersed in sufficient quantity in a polymeric matrix to form a conductive composite.
Figure 2.1 Classification of materials based on their conductivity [12]
1023
10-18 10-14 10-10 10-6 10-2 102 106 1012
Insulators Semiconductors Conductors Superconductors
qua rtz sulphur diamo nd gla ss Cd S sil ic on germa nium
InSb Iron
,plati num copp er , go ld sil ver
Conductive polymers which show electrical conductivity in the range of semiconductors and conductors (Fig. 2.1 and Fig. 2.2) are emerging as the basis of a number of new technologies, including static electricity discharging, electromagnetic interference shielding, conducting adhesives, self-regulating heaters and piezoresistive sensors.
Figure 2.2 Band theory model for (a) insulators (b) semiconductors and (c) metals [12]
The constant of proportionality is the electrical resistance (R) for the material;
Equation (2.1) In SI units, voltage is expressed in volts (V), resistance in Ohms (Ω) and current in amperes
(A). Another formulation of Ohm’s law is expressed as:
Equation (2.2) Energy of Electrons Conduction Band -Valence Band Energy Gap -Conduction Band Valence Band Valence Band Conduction Band
-Full of Electrons Full of Electrons Partially Filled
- - - - Fermi Level
a) Insulator b) Semiconductor c) Metal
-- - - - -- -- - - -- Electron
No gap, overlapping Narrow band gap
where, J is the current density in unit area (A m-2), σ is the conductivity E is the electric field or electrical potential gradient and is used to express the voltage drop (V) through the length (L) of the material.
Equation (2.3) Conductivity (σ) can also be formulated as a function of conductance (G, Ω−1), in general,
Equation (2.4)
Equation (2.5)
Equation (2.6) Since conductance (G) is the reciprocal of resistance (R) it can be written as a function of resistivity:
Equation (2.7) Polymers are different from metals in theory in terms of their electrical behavior. Unlike metals, most polymeric materials are insulating. Since electrons are located in covalent bonds in polymers, they cannot move as in metals. In polymers electrical conductivity can be attained through the addition of organic or inorganic conductive fillers or by producing a polymer with special structure which are called intrinsically conducting polymers (ICP), consisting of conjugated bonds [12,13].
2.2.1 Intrinsically Conducting Polymers (ICPs)
terms of their electrical properties [14]. Most polymers are “saturated” and act as electrical insulators because all available electrons in their structure, which can carry electrical current, are located in the σ-bonds. On the other hand conjugated structure of IC polymers give rise to electrons that are able to move more easily along the polymer backbone, because π-electrons are less strongly bound than the σ-electrons [15,16]. Other effects of π-electrons (conjugated structure) can be observed on some electronic properties such as low energy optical transitions, low ionization potentials, and high electron affinities which are mainly caused by the less chemically stable structure of the polymers. In other words, these polymers can be oxidized or reduced more easily and more reversibly than conventional polymers [14-16]. Excitation of a polymer (addition or removal of electrons) which leads it to behave like a metal can be obtained by visible photons, electron donating or accepting chemicals and so on [15,16]. Discovery of this effect in doped polyacetylene was first reported in 1977 by Chiang
ICPs are potential materials for all types of applications which require conductivity, because they are flexible, relatively lightweight compared to standard metals, do not corrode and they can be easily controlled during chemical processing. They can be used in different forms from films to coatings, and as nanofibers. While in some applications such as electromagnetic radiation shielding, batteries, conductive adhesives-printing, antistatic clothing, active electronics they are preferred for their conductivity; for some applications such as electrical displays, chemical, biochemical and thermal sensors the main reason is their electroactivity [14].
2.2.2 Conducting Polymer Composites (CPCs)
are explained; the second part of the study is dedicated to piezoresistive behavior of CPCs under different external conditions.
2.2.2.1 Mechanism of electrical conduction and percolation behavior in conducting
polymer composites
Mechanism of electrical conduction in conductive polymer composite has been studied extensively. Based on the composition of the composite different mechanisms of conduction such as electron tunneling, electron hopping, ionic transport, field emission, band type conduction and simple inter-aggregate conduction by contact have been suggested. While conduction by contact is ohmic, electron tunneling shows non-ohmic behavior [13,18,19]. As the fraction of conducting phase of the composite increases, the composite generally undergoes from insulator to conductor transition. This transition has been generally analyzed within the framework of effective media and percolation theories. The clearly delineated transition from insulating to conducting behavior is referred to as the percolation threshold. The fundamental reason for this transition is the existence of aggregates (or islands) of conducting particles in the heterogeneous mixture of materials. Below the critical content of conducting particles, conduction throughout the material cannot take place. Above this threshold, sufficient conducting pathways throughout the composite are set up such that the bulk conductivity increases dramatically.
processing conditions (fiber-matrix interface, alignment of filler, anisotropy, applied pressure, shear, and fiber breakage) [13].
Percolation is a standard model to describe the spatial distribution of species within disordered systems [20,21]. It was firstly developed by Flory (1941) and Stockmayer (1943) to describe the formation of large molecules from small branching molecules. In the mathematics, percolation was introduced by Broadbent and Hammersley (1957). Their approach was mainly based on the spread of hypothetical fluid particles through a random medium. It can be used to explain different physical phenomena in diverse research topics including, electrical conductivity, magnetism, electrochemistry, and molecular transport [20,21].
According to percolation theory, the bulk conductivity (σ) of a percolating composite with volume concentration, Ф, of the conducting phase behaves as a power law of the form [19,20] where σo is a constant of proportionality, and Фc is the critical volume fraction of the filler at the percolation threshold.
Equation (2.8) The exponent t is characteristic of the transition from dispersed filler particles to networked particles, and is assumed to be universal, i.e., material independent. In three-dimensional systems, t is around 2 when describing electrical conductivity [13,23].
Figure 2.3 Bond (a, b) and site (c, d) percolation
(a)
(b)
(c)
Although, percolation theory is the basic phenomena accepted for the conductivity in composites, there are other conditions before and after percolation threshold which required to be explained simply.
Depending on the filler or matrix properties and filler concentration, fillers have mainly two positions in the matrix:
- Separated by a distance (highly separated (xa), closely separated (xb))
- Direct contact (direct contact one continuous network (xc), direct contact many networks (xd)).
Figure 2.4 General behavior of a composite material conductivity vs. filler concentration
distance between the fillers is not enough to transfer charges, they can only inject some carriers into the polymeric matrix and do not change the conductivity of the system significantly [19,24].
of ~10 nm or less (in the range of Å). Another important factor is the applied voltage. Voltage dependence of the current intensity is given as,
Equation (2.9)
where are the constants. Eq. (2.9) shows that under higher voltage, current density increases and more electrons can tunnel through the insulating gap [13]. Since, the mechanism of conductivity based on electron tunneling is not same as the one observed in metals, it is expected to show different I-V behavior. While linear I-V relationship is obtained for the composites with continuously contacting fillers; nonlinear I-V curve is obtained for the composites with closely separated fillers/flocks [19,24,28-30]. Besides non-ohmic I-V character, temperature and pressure dependency of the composite resistance can be some of the other hints which indicate electron tunneling as a dominant mechanism in the system. Especially, thermal fluctuations are important factors for lowering the potential barrier [13,24].
The mechanism of conduction changes from electron tunneling to direct inter-particle/aggregate conduction in the case of increase in the concentration designated as xc in Fig 2.4, known as percolation threshold as mentioned previously [13,19].
the carrier concentration and the mobility of the carriers ( ). Although carrier concentration increases, mobility of the carriers show slow decrease because of increasing interface/surface area between matrix and fillers [19,24,31].
2.2.2.2 Factors affecting the conductivity in conducting polymer composites
Although conductivity phenomenon occurs to some extent in almost every composite containing conducting particle, every composite shows different electrical behavior mainly because of its components. Filler and matrix polymer properties, processing conditions are factors that have direct effect on the dominant mechanism of conductivity.
A) Filler properties
Composites are complex systems with at least two different components. Since fillers are the charge carriers in the system, their properties directly affect the electrical properties of the system. Filler type [32,33], dimension (diameter, length, etc.), shape (tube, cylinder, etc.), geometry [34], surface properties, compatibility with matrix [35,36], purity [37], concentration [38,39], production process (i.e., vapor grown CNF shows better conduction), tendency to disperse or aggregate, and their orientation [40,41] are important factors that have strong influence on electrical properties of the composites.
different forms such as laminates or woven fabrics [51,52]. Metallic fillers are one of the oldest materials used in CPCs because of their excellent electrical and thermal conductivity. However, for CPCs, generally carbonaceous fillers are preferred because of their relatively low cost and ease of processing as well as light weight and chemical and corrosion resistance [51]. The main difference in the electrical behavior of a CPC is caused from the inherent conductivity of the filler particles. Typically, CPCs have conductivity between polymer and filler. Even if two fillers belong to the same group, they can show different electrical properties. Since carbonaceous fillers are generally produced from artificial materials, their properties including fine structure, filler length, diameter, wall thickness, structural defect ratio are directly related with raw material and processing conditions such as pressure, temperature and time. All these variables have effects on the growth mechanism of carbon layers [53,54].
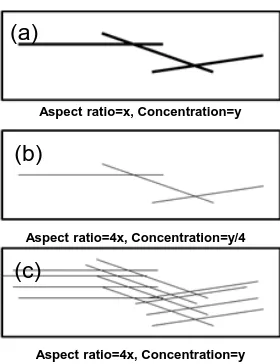
Figure 2.5 Fillers with different aspect ratios (a and b, c), fillers with different aspect ratio and same concentration (a and c)
Aspect ratio=x, Concentration=y
Aspect ratio=4x, Concentration=y/4
Aspect ratio=4x, Concentration=y (a)
(b)
In all fillers mentioned above; if we assume fillers made from the same material, continuous fillers are expected to show the higher conductivity than the chopped ones. As known for the conductivity in a system consisting chopped/loose fillers, can be obtained by contacts between fillers. On the other hand for the continuous fillers, even single filament might be enough to transfer charge from one end to another because of being a network itself.
Filler geometry (dimension, shape, etc.) is another important factor that determines charge transport throughout the CPCs. The aspect ratio or the ratio of the length to the diameter for fibers or ratio of diameter to thickness for platelets and flakes is considered a key dimensional characteristic of particles. Aspect ratios of the fillers can change from 1 (spheres) to 100s; while low aspect ratio indicates short, thick fillers; high aspect ratio indicates long, thin/narrow fillers. In general, the percolation threshold is lower for high aspect ratio particles [55-57]. Particles with a higher aspect ratio present higher probability to span the composite boundary at a lower concentration (see Fig 2.5 and 2.6).
In addition to aspect ratio, shape of the filler also affects the percolation behavior of the composite. While spheres/particles have to be packed closely and form continuous conductive chains of a network [59]; higher aspect ratio particles such as fibers, wires, tubes, sheets just need to come to close proximity to each other along their length in order to set up a conducting pathway [34]. While percolation threshold of carbon black composites have been reported to be in the range of 25-60 wt% depending on the intrinsic conductivity and the structure [59-61], CNF filled composites have been shown to have a lower percolation threshold in the range of 0.68-6.3 wt% [39,49,62]. CNTs showed even lower values of PT within the range of 0.1-2 wt% because of their relatively higher aspect ratios ranging between 100 and 5000 [63-66]. Another important parameter, the surface area of the fillers, differentiates the particles with same aspect ratio. As shown in Fig. 2.7, although all three CB particles have aspect ratio of 1, they have different surface areas which affect their filler-filler and filler-matrix interaction and number of the contact points. Generally, higher structures lead to lower percolation threshold because of their higher potential of forming contacts throughout the composite [67].
Flandin et al., used carbon fiber (CF), carbon black (low and high structure) with an ethylene–octene elastomer in order to compare the effect of filler aspect ratio on percolation threshold. While low structure carbon black (LSCB) showed percolation threshold around 40% v/v, the high structure carbon black (HSCB) had a lower threshold of 15% v/v, and the same for CF was 10% v/v (see Fig. 2.8) [67].
Figure 2.8 Effect of concentration for different fillers [67]
Li et al., used different fillers fabricated by different methods including spraying carbon black (4.87 m2 g-1), semi-reinforcement furnace black (13.55 m2 g-1), fast extruding furnace black (FEF, 33.38 m2 g-1), high abrasion furnace black (HAF, 68.36 m2 g-1), and conductive carbon black (CCB, 981.62 m2 g-1) with increased high surface areas as shown inside the parentheses. Polymeric matrix was ethylene-propylene-diene rubber (EPDM) and EPDM/CCB composites showed the highest conductivity because of its larger surface area [61].
Figure 2.9 Effect of filler type and concentration on conductivity [68]
Filler concentration is a measure of the amount of filler in the composite and is generally expressed in weight percent (wt%), volume percent (v%), or parts per hundred (pph). In addition to intrinsic filler properties (i.e., conductivity) and geometry, filler concentration is the most important parameter influencing conductivity of a CPC. Filler concentration has the most influence on filler-filler and filler/polymer interspacing and interaction. In general, the conductivity-concentration relation can be divided into three main regions, see Fig. 2.4 [19,24,59].
1) The region between bulk polymer and the threshold concentration,
2) A transition region from insulating to conducting phase which shows significant increase in conductivity, and
3) Conducting region
continuous network throughout the composite and conductivity of the composite increases dramatically. In the third region conductivity of the composite does not change significantly. Although different CPCs have different percolation threshold, all of them show characteristic conductivity behavior for composites [13,18,19,38,59,69].
Filler surface property is another important factor in determining the conductivity of the CPC. Since there are significant structural differences between filler and matrix materials including density, surface energy, and stiffness; it is not always easy to process and obtain optimum composite properties However, this can be overcome by additional processing such as modification of the surface characteristics of the filler. Surface properties and surface chemistry of the components are extremely important, because materials get in contact at the outer boundary of a material [35,70]. Different physical and/or chemical modifications have been carried out for fillers including heat treatment [36,71,72], grafting [73], electrochemical deposition [74] and acid treatments by sulfuric and/or nitric acid in order to:
enhance the cleanness, degree of purity [74],
remove structural defects [74],
increase the effective surface area [34,75],
increase surface functionality [73],
decrease surface energy [36],
increase conductivity of the filler [72],
Heat treatment of fillers is an effective way to remove structural defects and polar functional groups, improvement of the graphitic structure/crystallinity and electrical properties. On the other hand, heat treatment may reduce specific surface area, length and aspect ratio of the filler through removal of pore volume and this might lead to increase in percolation threshold of a CPC. In order to minimize these disadvantages of heat treatment, optimization of the process is strongly advised [36,71,72].
Grafting has been used for functionalization of surface by chemically bonding different structures and increasing the interaction between filler and matrix [73,76,77]. While strength and modulus of the composites showed significant increase [77], electrical conductivity is decreased because of the grafted layer. As shown in Fig. 2.10 grafted layer tend to wrap the filler and hinder the charge transport by increasing the filler-filler distance [73,76,77], and can even change the mechanism of conductivity from linear (ohmic) to nonlinear (non-ohmic) [73].
Figure 2.10 Effect of surface functionalization on filler dispersion
high temperatures. The treatment is used for increasing the surface area of the filler, removal of impurities, exfoliation of nanofillers and functionalization of filler surface by imparting oxygen containing groups such as carboxyl and hydroxyl. All of these not only affect the geometry and electrical properties of the fillers but also dispersability, adhesion behavior of fillers in the matrix and electrical, mechanical properties of the composites [33,74,75,78]. Since carbonaceous fillers are inert structures, strong acids such as nitric and/or sulfuric acid, hydrochloric acid or strong bases such as ammonium hydroxide/hydrogen peroxide are required in order to modify the properties [74,75,78]. It is also one of the common ways to obtain expanded graphite which shows activated surface and multi-pores with a higher volume expansion ratio. The process not only increases the filler-polymer interaction and dispersion rate but also lowers percolation threshold because of expanded filler structure [34,75]. In addition, nitric acid has been used to remove the amorphous carbon from CNFs and thereby increasing the filler conductivity [74].
B) Matrix properties
The electrical conductivity of the CPC is significantly influenced by the polymer’s electrical behavior, filler-matrix interaction. The filler-matrix interaction in turn determines filler dispersion in the matrix and is directly affected by the molecular weight [89,92], and crystallinity [92] of the matrix polymer. In addition, polarity and surface tension of the matrix polymer are also important [19,54,93].
molecular weight leads to higher melt viscosity resulted high shearing during mixing and this is an undesired effect for the dispersion of carbon black and formation of the conducting network [54,94]. In addition to that, high viscosity requires higher shear mixing which might lead to breakage of the fibrous fillers and decrease in the aspect ratio [95].
Crystallinity of a polymer determines the ratio of structural order which affects the physical and mechanical properties. When the issue is the CPCs, crystallinity of the polymer has some influences on the electrical conductivity of the system basically resulting from dispersion of fillers [96]. Tiong et al., used amorphous PS, low density polyethylene (LDPE) with low crystallinity, high density polyethylene (HDPE) with high crystallinity and CNFs as conducting filler. While CNFs dispersed well in LDPE, and PS; agglomeration was observed for HDPE. Different types of dispersion characteristics lead to different percolation behavior. PS/CNF nanocomposites had the lowest and HDPE/CNF nanocomposites had the highest percolation concentration [96]. On the other hand, Wessling et.al., reported relatively low percolation threshold for PE than amorphous PS [92]. Furthermore, Huang et.al., used CB and three different vinyl acetate (EVA) copolymers with different crystallinity [54]. The lowest percolation threshold was found for the polymer with the highest crystallinity. It was concluded that crystalline polymers restricted the fillers into the amorphous region and increase the contact rate.
Figure 2.11 Selective localization of CB in a polymer blend [101]
In addition to single polymeric systems, polymer blends can be effectively used in order to lower the percolation threshold (see Fig. 2.11). In these systems, generally two different polymers are used with different degree of crystallinity which induces phase separation and forces fillers to migrate into one phase and lowers the percolation threshold [102-106].
C) Process parameters
and interface properties of the composite become significant. In the second case, optimization requires attention because in order to obtain a good dispersion, harsh processing conditions and longer processing time might be needed which influence the aspect ratio of the fillers and percolative behavior. However, dispersion mechanism is not governed only by processing but also type of the components and their physical properties (cluster size, purity, surface properties of filler, polymer surface tension, etc.) are of importance. If the fillers form strong agglomerates due to Van der Waals forces and physical entanglements it might be difficult obtain satisfied results [40,93,95,107].
For the production of CPCs, various methods can be used including melt mixing [40,107], in-situ polymerization [73], solution casting [57,108]. The common process in each method is the mixing which aims blending of the components. Depending on the filler concentration, viscosity of the mix and polymer processing conditions, it can be carried out by many different methods such as traditional (direct) mixing [109], high-shear mixing, ultrasound mixing, melt mixing and chaotic mixing which can be combined with another mixing or shaping process such as injection molding, extrusion or hot pressing [40,93,95].
Although solution processing has some drawbacks from the environmental aspects and industrial applicability, it leads to lower percolation thresholds since solvent decreases the viscosity of the system and enhances the dispersability of the filler [80,93,112,113].
Figure 2.12 Effect of solvent on the formation of conducting network [57]
and poly(styrene butadiene styrene) block copolymers and various solvents including; 1,1,1-trichloroethane, toluene, acetone, isopropyl alcohol. As shown in Fig. 2.12, depending on the solubility and swelling ratio of the polymer, different morphologies and lower percolation values can be obtained.
Melt mixing: As in all type of mixing techniques, the aim of the melt mixing is to provide homogeneous filler dispersion in a molten polymer. Needless to say that this process is used for thermoplastic polymers and basically consists of three steps including, incorporation of filler and matrix, deagglomeration, and distribution of the filler. Deagglomeration of fillers is the most important step of processing and its deagglomeration mode generally based on rupture or erosion mechanism. To have a homogeneous dispersion and to balance the agglomeration and deagglomeration; filler structure, polymer melt behavior, applied hydrodynamics have to be taken into consideration [40,107].
Viscosity of a filled matrix is determined by filler and matrix. Since carbonaceous and metallic fillers are solid, rigid structures and generally not affected by temperature changes, polymer properties become more important in terms of the viscosity of the system. Generally, any increase in the temperature leads to a reduction in the viscosity of the polymer and lowers the shear effects on fillers which trigger the aggregate and conductive network formation [93,117-119].
In addition to that side product formation is another important point which might influence the total volume and properties of the system, so additional steps might be required in order to remove these undesired products from the system [121]. It was reported by Arlen et al., that the success of the process in terms of filler dispersion and electrical behavior not only depend on the polymerization but also on the surface properties of the fillers and interface properties. While good dispersion and strong interface can be obtained by in situ polymerization, it was also noted that strong interface hinders the charge transfer from filler to filler and lowers the conductivity of the system [73]. Since polymerization is effected by the materials in the medium; filler concentration might affect the distribution of molecular weight of the polymer. At high concentrations, fillers restrict the macromolecular chains and prevent the interaction between polymer chains. As reported by Li et al., any increase in the CB fraction leads to decrease in the molecular weight of the polymer which did not affect the general percolation behavior of the CPC [87].
D) Other factors
amount of additives. In addition to additives, external mechanical effects and environmental conditions were found to affect the conductivity of the system. Although other factors mentioned above affects conductivity without changing the filler-filler distance, environmental factors such as temperature, pressure, vibration, and ambient atmosphere were found effective under certain conditions which are going to be evaluated in the following chapter dealing with piezoresistive behavior of the composites.
2.3 Piezoresistivity and Piezoresistive Composites
Piezoresistivity is a material property that involves change in electrical resistance due to applied mechanical stresses. It was first reported in 1856 by William Thomson (Lord Kelvin) who observed the resistance change in iron and copper as a result of applied strain [125]. Application of this discovery has been in practice as strain gauges and thermo resistors since early 1900’s. These devices are made from pure metals or metal alloys. In 1950’s, piezoresistive behavior of silicon and germanium semiconductors was discovered by Smith [126] while working in the Bell Laboratories. It opened a new era in piezoresistive sensors. To illustrate the concept of piezoresistivity consider a prismatic bar of uniform rectangular cross‐section. The resistance R of the conductor can be expressed as,
Differentiating Eq. (2.10) we obtain:
Equation (2.11)
Dividing the Eq. (2.11) by resistance R,
Equation (2.12) The terms dA⁄A represents fractional change in area, dL/L represents fractional change in length in the long‐direction, and represents fractional change in resistivity of the conductor resulting from applied force along the longitudinal direction. The relative change in length, or the axial strain:
Equation (2.13) Lateral strain:
Equation (2.14) If the Poisson ratio is now expressed in terms of axial and lateral strain:
Equation (2.15)
Now the relative resistance change can be written as a function of the strain and resistivity;
Equation (2.16)
Figure 2.13 Piezoresistance caused from dimensional change [127]
The terms , and ( represent the geometric and material (or inherent) components of piezoresistivity, respectively. In semiconducting materials (e.g. silicon, germanium) the fractional change in resistivity, , is the predominant source of piezoresistive behavior. For metals, on the other hand, the fractional change in resistivity is nearly insignificant compared to the fractional change in resistance due to deformation or geometrical change.
The Gauge Factor (K) of a piezoresistive material is defined as the fractional change in resistance (ΔR/R) per unit strain, ε. It is expressed as [127];
Equation (2.17)
In metals, the change in inherent resistivity is negligible and GF can be reduced to:
Equation (2.18)
degenerated and as a result the carrier mobility and resistance change [126,127]. Electrical sensitivity in the atomic state and generation of high resistance difference makes semiconductors very favorable materials for piezoresistive sensors. They generally show relatively high GFs, around two orders of magnitude more than metals. Since the geometrical component (ν 0.28) of the GF is not as high as the material component, it can be neglected and GF can be written as [127]:
Equation (2.19)
For conducting composites, mechanism of piezoresistance is different. Although change in the geometry of the composite due to applied strain may be significant, the most important factor is the change in conducting network structure. The change in network structure may be due to a combination of change in inter-particle separation, and reorientation of filler particles [128,129]. Equation (2.20)
form new conducting networks, resistance will decrease which is referred as negative piezoresistance. Dominant mechanism depends on many structural and external factors such as polymer type, filler type, concentration, geometry [130], filler orientation-dispersion [131], amplitude, direction and type of external factor [130], measurement configuration.
2.3.1 Application of Piezoresistive Composites
Piezoresistive polymer composites can be used in different forms such as coating, printed layer, film and bulk form in many areas from civil engineering to textiles as self-monitoring sensory materials [52] because of their ability to reflect the magnitude of external factors in terms of change in resistance. These composites can be used as strain, pressure, temperature and gas sensors and can be produced easily with relatively lower cost [128].
Figure 2.14 Positive piezoresistance
As shown in Fig. 2.14 application of unidirectional strain leads to filler separation and decrease in the resistance. Filler separation degree is directly related with the magnification of the strain/stress. On the other hand, when aligned continuous fibers or laminates are used as filler as shown in Fig. 2.15; filaments or laminates come closer under strain and leads to decrease in resistance. However if applied strain increased and elastic limits of the composite is exceeded, filler-matrix debonding, filler breakage, might occur and resistance will increase [132-134]. In addition to filament based composites, some authors reported negative response for CB [67] and nickel/carbon fiber [135] filled polymer composites. This behavior was attributed to the filler alignment during loading process as shown in Fig. 2.15.
Generally, a higher strain and strain rate can lead to higher change in resistance because of higher deformation of the composite [118,136-138].
Figure 2.15 Negative piezoresistance
Kost et al. compared the effect of strain rate on the piezoresistive behavior of 10 wt% CB filled silicone rubber composites. As shown in Fig. 2.16, both magnitude of the strain and strain rate were found to influence the response of the composite. 2 mm/min strain rate lead to higher change in resistance when compared with 0.01 mm/min [136].
Similar study was carried out by Pramanik et al. with CB and short carbon fiber (SCFs) filled nitrile-rubber composites at higher strain values. As shown in Fig. 2.17, strain and strain rate were significant parameters in terms of the resistivity change because of their effect on filler configuration in the elongation process [137].
Figure 2.17 Effect of strain rate on the relative resistivity of different nitrile-rubber composites CF6 (SCF) and XF4 (SCF+CB): ( - - - ) 0.04 min-1 and ( __ ) 0.02 min-1 [137]
Das et al., investigated the effect of magnitude of strain and strain rate on the piezoresistive behavior and repeatability of CB and SCF filled ethylene-vinyl acetate (EVA) composites.
As shown in Fig. 2.18 and 2.19 both CB and SCF filled composites showed higher sensitivity under higher strain and strain rate which is assumed to be caused from the higher separation ratio. On the other hand, composites showed irreversible behavior between loading and unloading cycles [118].
Figure 2.19 Effect of strain and strain rate on electrical resistivity during loading and unloading cycle of CB/EVA composites [118]
In addition to short fiber and particle filled composites, Boschetti-de-Fierro et al. investigated the electromechanical response of unidirectional and bi-directional continuous carbon fiber/epoxy composites under different magnitudes of strain.
As shown in Fig. 2.20, filler orientation is of significance in terms of piezoresistive response. Although both composites showed increase in resistance by the increase in strain; unidirectional continuous fiber reinforced epoxy showed increase in two steps and bi-directional one showed step-wise increase. The region which showed the highest increase was reported to be caused from the fracture of the fibers in the structure [52].
Figure 2.21 Piezoresistive behavior of cross-ply [0°/90°] continuous carbon fiber reinforced epoxy [52]
Figure 2.22 Positive piezoresistance for different types of fillers under compression
While for fillers such as graphite nanosheets it is easier to increase the number of the points by applying pressure, this might adversely affect the CB particles. Since nanosheets have higher surface area, formation of the new networks can be dominant during the pressure application [139].
On the other hand, network formed by CB, can easily be destructed by the compression because of their spherical shape [141]. But, degree of resistance change is affected by the applied pressure. Pressure affects the filler configuration, filler to filler distances and piezoresistive response throughout the composite. The change in the resistance depends on the magnitude of the compression. Generally, at lower pressures, reformation of conducting networks dominates. However, at higher compression, resistance change can be higher because of higher dimensional change of the composite which leads to higher filler separation [54,103,130,141-143]. As reported by many authors, even if sample showed NPC, with the increase in the magnitude of the pressure, particle separation or destruction of the network even filler breakage might dominate and resistance will increase, see Fig. 2.22. On the other hand, type of the pressure coefficient not only depends on the magnitude of the pressure but also to the filler geometry and concentration [34,131,142,144]. As reported by Vidhate et al., at concentrations above the percolation threshold, increase in the compression stress was not found effective for resistance change [142].
Figure 2.24 Effect of pressure on the piezoresistive behavior of CB filled rubber composites [141]
Similar behavior is reported for Sn-Pb/PE composites by Wu et al. As shown in Fig. 2.25, higher compression stresses lead to higher filler separation and breakdown of the conducting network [54].
Temperature Sensors: In addition to mechanically driven piezoresistance, thermally driven polymer expansion can lead to piezoresistive response in CPCs. Generally, increased temperature gives rise to expansion of the polymer and destruction of the conducting network by increasing filler-filler distance [138]. Similar to the designation for strain sensors, for temperature sensors, positive and negative piezoresistance is designated by positive temperature coefficient (PTC) and negative temperature coefficient respectively. The type of the piezoresistive behavior (PTC ot NTC) is directly related with the polymer physical-chemical properties, filler geometry, content, aspect, heating-cooling rate, number of the heating-cooling cycles (thermal history) [145-147].
Figure 2.26 Positive and negative piezoresistance for different types of fillers under temperature effect
the different expansion ratios of the polymers [145-147]. As reported by many authors, a PTC phenomenon is generally observed around the melting temperature (Tm) of the semicrystalline polymers. As shown in Fig. 2.26, with the increase in the temperature, thermal expansion of the polymer takes place and molecular movement increases; this leads to destruction of the conducting network and increase in the resistance [68,118,146-149]. On the other hand, except some special cases [118,150], NTC behavior is generally observed in the melt state of the polymer which is caused from the low viscosity of the polymer and reconnection/agglomeration tendency of the conducting filler [146,147].
Feng et al., studied the effect of temperature change on the resistivity of CB filled ethylen-tetratluoro ethylene (ETFE) composites. As shown in Fig. 2.27, normalized resistivity is not affected up to 60°C which is caused from the lower expansion rate of polymer far below its melting point. After 60°C, increase in the normalized resistivity becomes noticeable and huge jump is seen around melting point of the polymer [138].
Gas Sensors: In addition to strain, pressure and temperature sensing ability of the CPCs, it was also reported by many authors that they are suitable materials for gas/ vapor sensors because of their ability to give measurable response about vapor type and concentration by change in resistance. The mechanism of the piezoresistance in this instance is similar to temperature sensors and shown in Fig. 2.28. When a CPC is exposed to vapor, gas molecules diffuse into the composite and lead to swelling of the polymeric matrix and decrease the system viscosity. Increase in the volume and decrease in the viscosity of the polymer affect the movement and distribution of polymer-filler and generally result with an increase in the filler-filler distance and composite resistance which is named as positive vapor coefficient (PVC) [87,151-156]. At a given time, resistance generally increases up to a peak value and followed by a decrease probably caused from the reformation of the conducting network which is named as negative vapor coefficient (NVC) [87,151].


![Figure 2.6 Effect of filler aspect ratio on the critical filler concentration [58]](https://thumb-us.123doks.com/thumbv2/123dok_us/1641228.1205067/41.612.246.386.459.631/figure-effect-filler-aspect-ratio-critical-filler-concentration.webp)
![Figure 2.8 Effect of concentration for different fillers [67]](https://thumb-us.123doks.com/thumbv2/123dok_us/1641228.1205067/43.612.221.407.243.376/figure-effect-concentration-different-fillers.webp)

![Figure 2.11 Selective localization of CB in a polymer blend [101]](https://thumb-us.123doks.com/thumbv2/123dok_us/1641228.1205067/51.612.162.468.69.287/figure-selective-localization-cb-polymer-blend.webp)
![Figure 2.13 Piezoresistance caused from dimensional change [127]](https://thumb-us.123doks.com/thumbv2/123dok_us/1641228.1205067/59.612.219.406.68.200/figure-piezoresistance-caused-from-dimensional-change.webp)

![Figure 2.24 Effect of pressure on the piezoresistive behavior of CB filled rubber composites [141]](https://thumb-us.123doks.com/thumbv2/123dok_us/1641228.1205067/69.612.232.401.399.577/figure-effect-pressure-piezoresistive-behavior-filled-rubber-composites.webp)
