Positive and Negative Selection on the Human Genome
Justin C. Fay,* Gerald J. Wyckoff*
,1and Chung-I Wu*
,†*Committee on Genetics,†Department of Ecology and Evolution, University of Chicago, Chicago, Illinois 60637 Manuscript received December 10, 2000
Accepted for publication April 5, 2001
ABSTRACT
The distinction between deleterious, neutral, and adaptive mutations is a fundamental problem in the study of molecular evolution. Two significant quantities are the fraction of DNA variation in natural populations that is deleterious and destined to be eliminated and the fraction of fixed differences between species driven by positive Darwinian selection. We estimate these quantities using the large number of human genes for which there are polymorphism and divergence data. The fraction of amino acid mutations that is neutral is estimated to be 0.20 from the ratio of common amino acid (A) to synonymous (S) single nucleotide polymorphisms (SNPs) at frequencies ofⱖ15%. Among the 80% of amino acid mutations that are deleterious at least 20% of them are only slightly deleterious and often attain frequencies of 1–10%. We estimate that these slightly deleterious mutations comprise at least 3% of amino acid SNPs in the average individual or at least 300 per diploid genome. This estimate is not sensitive to human population history. TheA/Sratio of fixed differences is greater than that of common SNPs and suggests that a large fraction of protein divergence is adaptive and driven by positive Darwinian selection.
W
HILE the fixation of adaptive mutations may be tion of amino acid-altering mutations that are deleteri-ous. Divergence of 46 genes among hominid species viewed as the crux of Darwinian evolution, it haslong been argued that the majority of DNA changes was used to estimate that 38% of amino acid-altering mutations are deleterious (Eyre-Walkerand Keight-that accumulate over time are not adaptive but neutral,
fixed by stochastic fluctuations in a finite population ley 1999). However, this may be an underestimate if positive selection has increased the rate of amino acid (Kimura1983). Indeed, except for a few proteins with
extremely high rates of evolution, evidence for adaptive divergence.
The fitness effects of deleterious mutations are perti-evolution at the molecular level has been elusive (Nei
1987). Much more is known about deleterious muta- nent to public health as they determine the frequency of the deleterious mutations and consequently the num-tions and H. J. Muller argued in an influential address
that the reduction in mean population fitness due to ber of individuals affected by a particular mutation. In the extreme case, if all deleterious mutations cause these mutations may constitute a considerable human
health concern (Muller1950). embryonic lethality and spontaneous abortion, then
mutations that survive to be polymorphic in a popula-The proportion of mutations that are deleterious has
been estimated from both allozyme and DNA diver- tion are either neutral or advantageous. Standing poly-morphism, therefore, would not be of health concern. gence data. Negative selection prevents deleterious
mu-tation from reaching common frequencies and so The increased rate of stillbirths and prereproductive
mortality with inbreeding reveals substantial effects of should produce an excess of rare variation. In humans,
the number of rare (⬍0.5%) allozyme alleles is much partially recessive deleterious mutations segregating in
the population (Morton andCrow 1956). However,
greater than expected under neutrality in an
equilib-rium population (Kimura1983). The difference in the it is not known whether most deleterious mutations an individual carries are rare and unique to one or a few number of rarevs.common alleles was used to estimate
that 79–85% of amino acid-altering mutations are dele- individuals or quite common in the general population. This distinction is relevant to association studies and terious (Kimura 1983). However, a recent increase in
our understanding of complex human genetic diseases. human population size can also account for the excess
The proportions of neutral, deleterious, and adaptive of rare variants. Negative selection also lowers the ratio
mutations and their selection coefficients can be esti-of amino acid to synonymous divergence between
popu-mated by various methods from variation within and be-lations and this ratio can be used to estimate the
propor-tween species (Kimura1983;Watterson 1987; McDon-ald and Kreitman 1991; Sawyer and Hartl 1992;
Corresponding author:Chung-I Wu, Department of Ecology and Evo- Templeton1996;Akashi1999). If all detectable amino lution, University of Chicago, Zoology Bldg., 1101 E. 57th St., Chicago,
acid and synonymous polymorphism is neutral, the ratio
IL 60637. E-mail: ciwu@uchicago.edu
of amino acid to synonymous variation within species
1Present address:Department of Human Genetics, University of
Chi-cago, ChiChi-cago, IL 60637. should remain constant regardless of a population’s
were classified by the investigators as⬍5, 5–15, and 15–50% and correspond to occurrences of 1–5, 6–17, and 18–57 times out of 114 chromosomes. The SNP-II data were categorized by the original investigators first into population-specific and shared SNPs and then by the frequency of the minor allele in the population in which each SNP is found. To categorize the SNP-II data by total population frequency, African-specific, European-American-specific, and SNPs shared by both popula-tions were split into low, moderate, and common frequency classes that roughly correspond to the three SNP-I frequency classes. For instance, the African-specific SNPs in the 1.25– 6.25% class (1–5 occurrences in a sample of 80 African chro-mosomes) are placed into the low frequency class, which is 0.7–3.4% in the total population. Low, moderate, and com-mon frequency classes respectively include the following: Afri-can-specific SNPs that occur 1–5, 6–9, and 10–40 times in a sample of 80; non-African-specific SNPs that occur 1–5, 6–8, and 9–34 times in a sample of 68; and shared SNPs that occur 0, 1–11, and 12–74 times in the total sample of 148. A portion of the low frequency class was removed (49 amino acid, 16
Figure1.—The expected number of mutations found in a
synonymous, and 38 noncoding SNPs) as compensation for population as a function of frequency, where each mutation
false positive SNPs, estimated to be 17% of all SNPs identified is either under positive (2Ns⬎1), negative (2Ns⬍ ⫺1), or
(Halushkaet al.1999). No compensation was made for SNP-I
no selection (2Ns⫽0). The distribution is obtained from an
because every SNP was confirmed. infinite-site model with free recombination, no dominance,
The divergence data are from 182 orthologous human and ⫽4N ⫽1, whereNis the effective population size,sis the
old world monkey genes (ⵑ183 kb). The number of amino selection coefficient, andis the mutation rate (materials
acid and synonymous differences between orthologs was
cor-and methods).
rected for multiple hits using Kimura’s two-parameter model (Li1997). The proportion of amino acid-altering sites in cod-ing regions was calculated from simulation, and for the
diver-graphic history. However, this ratio should change as a gence data is 0.725 (Wyckoffet al. 2000). The divergence function of frequency if some amino acid variation is data can be obtained at http://ecolevol-mac2.uchicago.edu/ under positive or negative selection (Figure 1). At allele supp.html. The proportion of amino acid-altering sites in the two SNP surveys was calculated as 1 minus the number of
frequencies on the order of the reciprocal of the
effec-fourfold degenerate sites plus one-half the number of twofold
tive population size, selection is ineffective and the
rela-degenerate sites divided by the total number of sites and is
tive proportions of neutral, deleterious, and adaptive 0.714 and 0.757 for the SNP-I and SNP-II surveys, respectively. variants correspond to their production by mutation. The slight differences between these numbers do not affect The relative number of deleterious to neutral mutations any conclusions.
Deleterious mutations model: We assume all amino acid
declines as a function of frequency in the
pop-mutations are either neutral, slightly deleterious, or strongly
ulation. Advantageous mutations, on the other hand,
deleterious. The neutral class,f0, is estimated from common
become enriched relative to neutral mutations in the SNPs to be 0.20 (see
results). The slightly deleterious class,
high frequency portion of the distribution and in fixed f
1, must account for the excess of low frequency amino acid
differences between species. The effects of positive selec- SNPs (Table 1). The strongly deleterious class,f2, is not found
in a sample. The excess of low and moderate frequency amino
tion can be distinguished from negative selection only
acid SNPs is fit to a deleterious mutation model. The model
if an outgroup is used to infer whether a mutation is
assumes a randomly mating population of constant size, that
at, say, 5 or 95%. Many polymorphism studies do not
each new mutation occurs in a monomorphic site
(infinite-make this distinction and so an excess of rare (low and site model), free recombination (independence between all high) compared to common single nucleotide polymor- sites), and that each SNP is deleterious and reduces an individ-phisms (SNPs) cannot be attributed to just positive or ual’s fitness bysin the homozygous state andhsin the heterozy-gous state, wheresand hare the selection and dominance
negative selection. To estimate the fraction of DNA
vari-coefficients, respectively. The expected frequency distribution
ation within and between species that has been under
of deleterious SNPs in a population, or the frequency
spec-positive and negative selection we compare amino acid trum, is and synonymous polymorphism from two recent
sur-veys of human DNA variation (Cargill et al. 1999;
φ(x)⫽ f1
冮
1 x(y)dy x(1⫺x)(x)冮
10(y)dy
(1) Halushka et al. 1999) and from divergence between
humans and old world monkeys.
(y)⫽exp[2Ns(2h⫺1)y2⫺2hy] (2)
(Equation 4.24;Ewens1979), wherexis the frequency of a MATERIALS AND METHODS
deleterious SNP, ⫽4N,Nis the effective population size, is the mutation rate per generation, andf1is the fraction
Data:SNP-I is of 106 genes (ⵑ136 kb) surveyed in an average
of amino acid SNPs that are slightly deleterious. The number of 114 chromosomes (Cargillet al.1999), and SNP-II is of
of slightly deleterious SNPs in a population is a fraction,f1, 75 genes (ⵑ87 kb) surveyed in an average of 148 chromosomes
absence of negative selection and can range from zero, in amino acid SNPs are deleterious (Cargillet al. 1999; which case all amino acid SNPs are either neutral or strongly Halushkaet al.1999). The low ratio of noncoding (NC) deleterious, to 0.80, in which case 20% of amino acid SNPs
to synonymous SNPs indicates 50% of the noncoding
are neutral and 80% are slightly deleterious.was estimated
sites surveyed are under constraint (Table 1). However,
from the number of synonymous SNPs at low and moderate
frequency to be 87.10 using the formula noncoding SNPs appear neutral in that their distribu-tion is similar to that of synonymous variadistribu-tion. This
⫽S
冢
兺
17i⫽1 1
i ⫹
兺
113i⫽97 1
i
冣
⫺1␣, (3) suggests that amino acid and noncoding mutations
dif-fer in their distribution of selection coefficients ( Suny-whereSis the number of low and moderate frequency synony- aevet al.2000).
mous SNPs,␣is the number of amino acid-altering sites per The difference in the per site ratio of amino acid to synonymous site, and the denominator is similar to that of
synonymous SNPs at low compared to common
fre-Watterson’s estimator of, except that it accounts for the fact
quency is an estimate of the fraction of low frequency
that the estimate is based on segregating sites where the minor
SNPs that are slightly deleterious. To make this estimate,
allele occurs 1–17 times in a sample (Watterson 1975;Fu
1995). amino acid mutations are assumed to fall into three
The expected number of deleterious SNPs in a sample was classes: neutral,f
0; slightly deleterious,f1; and strongly found by taking the integral of the product of the frequency
deleterious, f2. Neutral amino acid mutations are re-spectrum,φ(x), and the sampling formula,
sponsible for all common SNPs as well as a proportion of low and moderate frequency SNPs. Slightly deleterious
a(i,n)⫽ n! (n⫺i)!i!x
i(1⫺x)n⫺i (4)
mutations account for the excess of low frequency amino acid variation and are prevalent in the general
over all possible values ofx, whereiis the number of
occur-population. Strongly deleterious mutations rarely rise to
rences of an allele in a sample ofnchromosomes. We
inte-grated from 1/2Nto 1⫺1/2N, whereNwas assumed to be detectable frequency and may be associated with simple
106. The results are the same for N ⫽ 104or 107. We also
genetic diseases. Adaptive mutations are assumed to
consider a model where each deleterious SNP has a different
be rare in polymorphism (but not divergence). The
selection coefficient and these selection coefficients are
expo-observed distribution of amino acid SNPs is a composite
nentially distributed. Under this model the expected number
of these three classes. Although synonymous and
com-of deleterious SNPs in a sample is
mon amino acid SNPs may not all be neutral, this would
冮
0∞冮
1⫺1/2N
1/2N φ(x)a(i,n)e
⫺sdxds, (5)
result in an underestimate of the deleterious fraction. In addition, this measure is independent of any
demo-whereis 1/s,sis the average selection coefficient, and there
graphic effects, which should influence both the
distri-is no dominance (h⫽0.5).
To assess the fit of the model, the numbers of deleterious bution of neutral amino acid and synonymous SNPs and
SNPs predicted to be found 1–5 times (⬍5%), 6–17 times should thus have no effect on their ratio.
(5–15%), and⬎17 times (⬎15%) in the sample were gener- The ratio of amino acid to synonymous SNPs is shown ated using the appropriate sampling formula. The number of
in Table 1 asA*/S* for each frequency class and survey
sites for which an individual is expected to be heterozygous
(* denotes the number of SNPs per site). The combined
and homozygous for a deleterious mutation was found by numerical integration ofφ(x)x2and φ(x)2x(1 ⫺ x),
respec-A*/S* ratio of common SNPs is 0.20, indicating that
tively. the majority (80%) of amino acid SNPs are deleterious.
TheA*/S* ratio of low frequency SNPs is higher than that of common SNPs and indicates a large fraction of
RESULTS
the amino acid SNPs are slightly deleterious and reach only low frequencies. For SNP-I, the ratio increases from Detection of deleterious mutations:The numbers of
amino acid (A) and synonymous (S) single nucleotide 0.23 to 0.46, which suggests that 23% of amino acid mutations are slightly deleterious. The other 54% of polymorphisms (SNPs) found in two published surveys
of human DNA variation are shown in Table 1, hereafter mutations are strongly deleterious and not found in the population sample. The excess number of amino acid referred to as SNP-I (Cargillet al. 1999) and SNP-II
(Halushkaet al.1999). The two surveys differ in a num- SNPs at low frequency is the observed minus expected number of amino acid SNPs, calculated as the product ber of respects and so are analyzed separately (materials
and methods). In the SNP-I survey, there is a significant of the A/S ratio of common SNPs and the number of synonymous SNPs at low or moderate frequency (Table 1). difference in the ratio of amino acid to synonymous
SNPs in the low (⬍5%) compared to common (⬎15%) We are interested in estimates of the number of dele-terious mutations an individual is expected to carry. frequency class (2 ⫽ 7.39, P ⬍ 0.01). In the SNP-II
survey, there is a significant difference in the ratio of Such an estimate requires knowledge of the frequency of these mutations in the population. A conservative amino acid to synonymous SNPs in the low (2⫽8.97,
P⬍0.01) and moderate (2⫽4.74,P⬍0.05) compared estimate is to assume each deleterious mutation is
pres-ent only once in the sample. This estimate is not depen-to common frequency class. The different ratios of
TABLE 1
Summary of two DNA polymorphism surveys in humans and divergence from old world monkeys
Data Class A S A*/S* Excess NC NC*/S*
SNP-I Low 93 81 0.46 47 52 0.41
Moderate 26 38 0.27 4 35 0.59
Common 36 63 0.23 0 49 0.50
Total 155 182 0.34 51 136 0.48
SNP-II Low 85 66 0.41 47 142 0.44
Moderate 40 35 0.37 20 77 0.45
Common 34 59 0.19 0 179 0.62
Total 159 160 0.32 67 398 0.51
Combined Common 70 122 0.20 0 228 0.69
Divergence Total 3660 4151 0.34 1278
A, amino acid SNP;S, synonymous SNP;A*/S*, the ratio of amino acid to synonymous SNPs per amino acid-altering and synonymous site, respectively; excess, observed minus expected number of amino acid SNPs, where expected is the product ofS(low or moderate) andA/S (common); NC, noncoding SNP; and NC*/ S*, the per site ratio of noncoding to synonymous SNPs. Low, moderate, and common classes of the minor allele frequency are⬍5%, 5–15%, and⬎15%, respectively, for the SNP-I survey (seematerials and methods
for a description of the SNP-II survey).
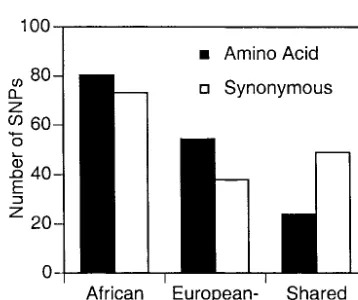
present more than once in the sample. Indeed, in both pected number an individual carries can also be assessed surveys the excess is not limited to the lowest frequency by comparing shared and population-specific SNPs. Del-class. The conservative estimate is the excess divided by eterious mutations are kept at low frequency and should the number of individuals sampled and is 0.89 deleteri- not easily spread to multiple populations. Figure 2 shows ous mutations per individual for both the SNP-I and that amino acid SNPs are much more likely to be popula-SNP-II surveys (Table 2). These deleterious SNPs consti- tion specific than synonymous SNPs. In SNP-II, theA/S tute 3.4 and 2.5% of the average number of amino acid ratio of African- and European-American-specific SNPs SNPs found in an individual in the SNP-I and SNP-II is 135/111 and is significantly greater than 24/49, the surveys, respectively (Cargillet al.1999;Halushkaet A/Sratio of SNPs shared between the two populations al.1999). Assuming there are 5 ⫻ 107 coding sites in
(2 ⫽ 10.9, P ⬍ 0.001). If all amino acid SNPs were
the genome (ⵑ1.5% of the genome), the SNP-I and neutral the ratio of amino acid to synonymous SNPs
SNP-II surveys represent 1/368 and 1/575 of coding should be the same for population-specific compared DNA in the genome and the conservative estimates of to shared SNPs, regardless of population history. Based the average number of deleterious mutations an individ- on the ratio of shared amino acid and synonymous SNPs ual is expected to carry are 329 and 513, respectively and the number of population-specific synonymous
(Table 2). SNPs, the excess of population-specific amino acid SNPs
The frequency distribution (or frequency spectrum) is 80 (135⫺111⫻24/49). Using the most conservative of deleterious mutations in a population and the ex- estimate, which assumes that the deleterious mutations
TABLE 2
Conservative estimates of the number of deleterious SNPs in an individual’s genome
D D D/T
Data (sample) T (genome) (%)
SNP-I 0.89 26.62 329 3.4
SNP-IIa 0.89 36.17 513 2.5
SNP-IIb 1.09 36.17 627 3.0
Dis the number of deleterious SNPs carried by an individual in the genes surveyed and is calculated as the excess of amino acid SNPs in the sample divided by the number of individuals sampled. T is total number of amino acid SNPs carried by an individual in the genes surveyed (Cargill et al. 1999;
Halushkaet al.1999). Figure2.—The numbers of amino acid and synonymous
SNPs that are population specific and shared between the aThe excess is calculated from frequency classes.
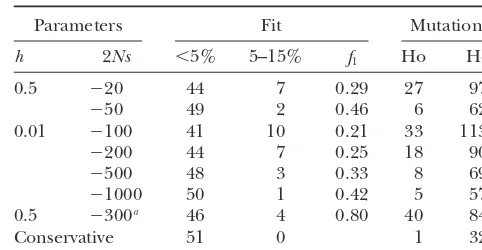
TABLE 3
are found only once in the sample, an individual is
expected to carry 627 deleterious mutations in his ge- Fit of a deleterious mutation model to the excess
nome. This estimate is quite similar to that based on the of amino acid SNPs
frequency analysis, 513, and indicates most deleterious
SNPs are population specific. However, both estimates Parameters Fit Mutations
are conservative in that all the deleterious SNPs were h 2Ns ⬍5% 5–15% f
1 Ho He
assumed to be found only once in the sample. A better
0.5 ⫺20 44 7 0.29 27 972
estimate can be made by knowing the frequency
distri-⫺50 49 2 0.46 6 624
bution of deleterious SNPs in the population. 0.01 ⫺100 41 10 0.21 33 1139
Fit to a deleterious mutation model:To estimate the ⫺200 44 7 0.25 18 906
frequency spectrum of deleterious SNPs in the popula- ⫺500 48 3 0.33 8 692
tion, the SNP-I survey is fit to an infinite-site deleterious ⫺1000 50 1 0.42 5 579
0.5 ⫺300a 46 4 0.80 40 847
mutation model (materials and methods). The
SNP-Conservative 51 0 1 329
II survey is not analyzed as it is categorized primarily by
population rather than frequency. The model is fit to h, dominance coefficient; 2Ns, the scaled selection coeffi-the excess of low and moderate frequency amino acid cient wheresis the selection coefficient andNis the effective population size;⬍5% and 5–15%, the number of deleterious
SNPs inferred to be in thef1or slightly deleterious class.
mutations the model predicts at low and moderate frequency,
The neutral fraction,f0, is responsible for all common
respectively;f1, the estimated proportion of amino acid
muta-SNPs and is 0.20 from the combined A*/S* ratio of tions that are slightly deleterious; Ho and He, the estimated common SNPs (Table 1). Each mutation in the slightly number of sites homozygous and heterozygous, respectively, deleterious class reduces fitness bysin the homozygous for a deleterious mutation in an individual.
aThe average strength of selection whensis exponentially
state and hs in the heterozygous state, where s and h
distributed.
are the coefficients of selection and dominance, respec-tively. The number of deleterious SNPs in a sample is determined by the strength of selection and the fraction
tion even though the majority (⬎80%) of all slightly of amino acid mutations that are slightly deleterious,f1.
deleterious SNPs in the population are expected to be As the strength of selection increases, fewer amino acid
at a frequency of⬍1% (materials and methods). SNPs are found at a detectable frequency (⬎1%), so
Given the large range of selection coefficients that the proportion of mutations that are slightly deleterious,
can explain the deleterious excess, it may be appropriate f1, must increase to produce the same number of
delete-to fit the excess delete-to a model that assumes each deleterious rious SNPs observed at low frequency. As selection
be-SNP has a different selection coefficient. To do this, comes weaker, deleterious SNPs are found at higher
the excess is fit to an infinite-site deleterious mutation frequencies and the excess of low frequency compared
model, which assumes selection coefficients are expo-to common amino acid SNPs is lost. The model is fit
nentially distributed and there is no dominance ( mate-such that 51 deleterious SNPs (the excess) are expected
rials and methods). In this model there are two classes in a sample of 114 with three constraints: (i) the slightly
of amino acid mutations: a neutral class of amino acid deleterious fraction,f1, cannot exceed 0.80 since 20%
mutations,f0, and a deleterious class,f1, which is fixed
of mutations were estimated to be neutral; (ii) the
pre-at 0.80 since the class must account for all deleterious dicted number of common deleterious SNPs (⬎15%)
amino acid mutations. An average scaled selection coef-is not more than one SNP; and (iii) there coef-is at least one
ficient (2Ns) of⫺300 provides a good fit to the observed slightly deleterious SNP predicted at moderate
frequen-number of low and moderate frequency amino acid cies (5–15%).
SNPs (Table 3). The range of parameter values that can explain the
Detection of advantageous mutations:The other ma-observed excess of amino acid variation is presented in
jor focus of this study is on how often advantageous Table 3. The average number of deleterious mutations
mutations occur. Under the neutral theory, the small per individual predicted by the model lies in the narrow
number of advantageous substitutions is overwhelmed range of 500–1200 regardless of the strength of
selec-by the large number of neutral substitutions between tion, degree of dominance, or proportion of mutations
species. Positive selection is expected to increase the that are slightly deleterious, f1. In the absence of the
number of high frequency compared to common SNPs third constraint the estimated number of deleterious
(Figure 1). This effect should be stronger forA than mutations approaches the conservative estimate of 329.
forS;Scan also rise to high frequency by hitchhiking The slightly deleterious fraction (f1, fifth column)
sug-with mutations under positive selection (Fay andWu gests that 20–45% of amino acid mutations are slightly
2000). For SNP-I, low vs. high frequency SNPs were deleterious and reach appreciable frequencies in the
distinguished using an outgroup. The ratio of common population. The fitted distribution shows that most
(15–85%) amino acid to synonymous SNPs (28/38) is (⬎60%) of the deleterious SNPs an individual carries
While many more high frequency SNPs would be needed to show a significant increase in theA/Sratio, analysis of flanking variation for a hitchhiking effect would provide direct evidence for positive selection (FayandWu2000).
TheA/Sratio of divergence is also inflated by positive selection. A common test for positive selection is a com-parison of the A/S ratio of polymorphism and
diver-gence (McDonaldand Kreitman1991; Sawyerand
Hartl1992;Templeton1996). Since mutations under positive selection spread through a population quickly, they are not well represented in polymorphism but should have a cumulative effect on divergence. TheA/S
ratio from divergence is estimated from 182 orthologous Figure3.—The observed to expected ratio of conservative, human and old world monkey genes (Table 1). To avoid moderate, and radical amino acid-altering mutations found
at low and common frequency and fixed between species.
the confounding effects of deleterious mutations, which do not contribute to divergence but do make a signifi-cant contribution to polymorphism, theA/Sratio from
population are deleterious or adaptive and which are divergence is compared to that of common SNPs (Table
neutral. However, weak selection should have a signifi-1). The difference in the A/S ratio of common SNPs
cant impact on the distribution of amino acid variation combined from both surveys compared to divergence
within and between species and this can be used to is significant (2⫽8.14,P⬍0.01) and can be explained
estimate the fractions of amino acid variation that are by positive selection, assuming the average constraint
deleterious, neutral, and adaptive. To estimate these on the divergence and polymorphism genes is the same.
quantities we make a number of assumptions that, as The large number of amino acid substitutions
sug-we discuss below, are conservative and should not affect gests a high rate of adaptive evolution in primates. The
our conclusions. expected number of amino acid substitutions is 2382
The fraction of amino acid mutations that are neutral (4151⫻ 70/122) based on theA/S ratio of common
is estimated from theA*/S* ratio of common SNPs by polymorphism and the excess is 1278. Therefore, a large
assuming synonymous mutations and common amino proportion, 35%, of amino acid substitutions between
acid SNPs are neutral. If violated, this assumption leads humans and old world monkeys are estimated to have
to an overestimate of the neutral fraction and an under-been driven by positive selection. Extrapolating this
pro-estimate of the slightly deleterious and advantageous portion to the total amount of coding DNA in the
ge-fraction. For example, when 2Ns is ⫺5, 14% of the nome (ⵑ5 ⫻ 107 bp) yields an estimate of up to 1
deleterious SNPs in a sample of 114 are expected to be advantageous substitution every ⵑ200 years since
hu-found at a frequency of⬎15% in the sample (integra-mans separated from old world monkeys 30 million
tion of Equation 1). Evidence for selection on synony-years ago (Li1997).
mous sites has been inferred from a lower frequency of If the proportion of deleterious, neutral, and adaptive
mutations from G or C to A or T at synonymous sites mutations differs among common and low frequency
compared to mutations from A or T to G or C ( Eyre-variation and fixed differences, this may be reflected in
Walker1999). the types of amino acid changes that occur. Amino acid
The fraction of amino acid mutations that are delete-substitutions were classified into conservative,
moder-rious is estimated to be 0.80 from the neutral fraction ate, and radical changes on the basis of their
physico-and is not much affected by advantageous mutations, chemical properties (Grantham1974;Wyckoffet al.
which if under strong selection rarely affect polymor-2000). As expected, radical changes show the largest
phism but accumulate as divergence. A previous esti-decrease from low frequency to common SNPs and so
mate of the deleterious fraction was 0.38 based on diver-are more likely deleterious (Figure 3). Interestingly,
gence of 46 genes (Eyre-Walker and Keightley
moderate changes show the largest increase from the
1999). The difference between these two estimates is common SNP class to fixed differences and so are more
likely due to two factors: (i) the assumption that positive likely to have been influenced by positive selection.
selection does not increase the rate of protein diver-gence and (ii) the relatively small number of genes
DISCUSSION
available for use in the previous analysis.
The estimated number of deleterious mutations an Segregating amino acid mutations with a strong
phe-individual carries is not likely inflated by a complex notype can be detected through studies of linkage and
demographic history. The conservative estimate is not association. In the absence of a strong phenotype it
conser-vative as it assumes all deleterious amino acid SNPs are of the noncoding sites are constrained and must serve some function (Table 1). Because an equal number of found only once in the population. The deleterious
mutation model assumes an equilibrium population but noncoding and amino acid-altering sites were surveyed, noncoding mutation should contribute at least 60% the estimate is not likely inflated for the following
rea-sons. First, the number of deleterious mutations an indi- (0.50/0.80) as much as coding mutations to the total genomic deleterious mutation rate.
vidual carries depends most on those mutations⬎1%
in frequency and so should not be affected much by A contentious issue is whether most common human
genetic diseases are caused by a few common frequency the distribution of deleterious mutations below 1%.
While the distribution below 1% may be affected by SNPs or the combined effects of many low frequency
SNPs (Cargillet al.1999; Halushkaet al. 1999). Al-a recent increAl-ase in populAl-ation size, the distributions
of synonymous SNPs in the low, moderate, and com- though the large number of low frequency slightly dele-terious SNPs is suggestive of numerous factors of small mon classes are 81, 38, and 63, and are very close to
those expected in a neutral equilibrium population: 80, effect, their contribution to human genetic diseases or health ailments is not necessary. Many of these deleteri-44, and 58, respectively (Fu 1995). Second, the
esti-mated number of deleterious mutations per individual ous mutations may no longer affect fitness due to envi-ronmental changes, and fitness in the evolutionary sense depends most on the excess to which it is fit and not
the actual shape of the distribution. This is shown by does not necessarily equate with common human ge-netic diseases. The fitness cost in the evolutionary sense the similar estimates obtained for different values
ofsandh, which determine the shape of the distribution may be manifested through parental care or sexual se-lection (Wyckoffet al.2000) or may be through resis-(Table 3).
The deleterious mutation model may underestimate tance to a previous pathogen or environmental condi-tion. Nevertheless, the increase in the occurrence of the strength of selection. Changes in population size,
interference between selected mutations, and fluctuat- human genetic diseases with inbreeding suggests there are many segregating deleterious mutations of health ing selection coefficients reduce the efficacy of selection
(Gillespie1991;Barton1995;McVeanandCharles- concern (BittlesandNeel1994). Whether slightly or strongly deleterious mutations account for these obser-worth2000). These processes enable a deleterious
mu-tation to attain a higher frequency than in their absence. vations has yet to be determined.
The fraction of amino acid substitutions that were We thank N. Cox, J. Crow, S. Dorus, A. Kondrashov, T. Nagylaki, driven by positive selection is based on the assumption and K. Thornton for comments and discussions. We also thank the reviewers for their helpful comments. This work was supported by a
that the average level of constraint on the genes in the
National Science Foundation and National Institutes of Health grant
polymorphism and divergence data is the same. Further
to C.-I Wu and a National Institutes of Health Training Grant to J. C.
work is needed to test whether this assumption is robust.
Fay.
Regardless, it is clear that an excess of amino acid diver-gence can be obscured by an increase in theA/Sratio of polymorphism due to slightly deleterious amino acid
LITERATURE CITED
SNPs. In this study, theA/Sratio of total polymorphism
Akashi, H.,1999 Within- and between-species DNA sequence
varia-is inflated to that of divergence and so no evidence of
tion and the “footprint” of natural selection. Gene238:39–51.
positive selection would have been detected using the Barton, N. H.,1995 Linkage and the limits to natural selection.
Genetics140:821–841.
standard McDonald-Kreitman test, which compares the
Bittles, A. H.,andJ. V. Neel,1994 The costs of human inbreeding
A/Sratio of total polymorphism to divergence (
McDon-and their implications for variations at the DNA level. Nat. Genet.
aldandKreitman1991). 8:117–121.
Cargill, M., D. Altshuler, J. Ireland, P. Sklar, K. Ardlieet al.,
The number of deleterious mutations an individual
1999 Characterization of single-nucleotide polymorphisms in
carries and their individual selection coefficients cannot
coding regions of human genes. Nat. Genet.22:231–238.
be used in a straightforward estimate of fitness reduction Crow, J. F.,1970 Genetic loads and the cost of natural selection,
pp. 128–177 inMathematical Topics in Population Genetics, edited
or genetic load. A genomic deleterious mutation rate
byK.-I. Kojima.Springer-Verlag, New York.
greater than one suggests epistatic interactions between
Ewens, W. J.,1979 Mathematical Population Genetics.Springer-Verlag,
deleterious mutations in their translation to fitness New York.
Eyre-Walker, A.,1999 Evidence of selection on silent site base
(Crow1970). The genomic deleterious mutation rate
composition in mammals: potential implications for the evolution
in humans was previously estimated to be at least 1.6
of isochores and junk DNA. Genetics152:675–683.
on the basis of an estimate that 38% of amino acid Eyre-Walker, A.,andP. D. Keightley,1999 High genomic
delete-rious mutation rates in hominids. Nature397:344–347.
mutations are deleterious. The genomic deleterious
mu-Fay, J. C.,andC.-I Wu,2000 Hitchhiking under positive Darwinian
tation rate is likely much larger given our estimate that
selection. Genetics155:1405–1413.
80% of amino acid mutations are deleterious and given Fu, Y. X.,1995 Statistical properties of segregating sites. Theor.
Popul. Biol.48:172–197.
that it does not include deleterious mutations in
non-Gillespie, J. H.,1991 The Causes of Molecular Evolution.Oxford
Uni-coding regions, which may be quite common (
Shabal-versity Press, Oxford.
ina and Kondrashov 1999). The combined NC*/S* Grantham, R.,1974 Amino acid difference formula to help explain
protein evolution. Science185:862–864.
Halushka, M. K., J. B. Fan, K. Bentley, L. Hsie, N. Shenet al., 1999 Sawyer, S. A.,andD. L. Hartl,1992 Population genetics of poly-morphism and divergence. Genetics132:1161–1176.
Patterns of single-nucleotide polymorphisms in candidate genes
Shabalina, S. A.,andA. S. Kondrashov,1999 Pattern of selective for blood-pressure homeostasis. Nat. Genet.22:239–247.
constraint inC. elegansandC. briggsaegenomes. Genet. Res.74:
Kimura, M.,1983 The Neutral Theory of Molecular Evolution.
Cam-23–30. bridge University Press, Cambridge, UK.
Sunyaev, S. R., W. C. Lathe III, V. E. RamenskyandI. Bork,2000
Li, W.-H.,1997 Molecular Evolution.Sinauer Associates, Sunderland,
SNP frequencies in human genes an excess of rare alleles and MA.
differing modes of selection. Trends Genet.16:335–337.
McDonald, J. H.,andM. Kreitman,1991 Adaptive protein
evolu-Templeton, A. R.,1996 Contingency tests of neutrality using intra/ tion at theAdhlocus in Drosophila. Nature351:652–654.
interspecific gene trees: the rejection of neutrality for the
evolu-McVean, G. A.,andB. Charlesworth,2000 The effects of
Hill-tion of the mitochondrialcytochrome oxidase IIgene in the homi-Robertson interference between weakly selected mutations on
noid primates. Genetics144:1263–1270. patterns of molecular evolution and variation. Genetics155:929–
Watterson, G. A.,1975 On the number of segregating sites. Theor. 944.
Popul. Biol.7:256–276.
Morton, N. E.,andJ. F. Crow,1956 An estimate of the mutational Watterson, G. A.,1987 Estimating the proportion of neutral mu-damage in man from data on consanguineous marriages. Proc. tants. Genet. Res.50:155–163.
Natl. Acad. Sci. USA42:855–863. Wyckoff, G. J., W. WangandC.-I Wu,2000 Rapid evolution of
Muller, H. J.,1950 Our load of mutations. Am. J. Hum. Genet.2: male reproductive genes in the descent of man. Nature403:
111–176. 304–309.
Nei, M.,1987 Molecular Evolutionary Genetics.Columbia University