Semi-Large Scale Experiments Performed on Specimens with Underclad Cracks
Vladislav Pistora1,.Milan Brumovský1, Jyrki Kohopaa2, Dana Lauerova1, Kim Wallin3
1) Nuclear Research Institute Rez plc, Rez, Czech Republic 2) FORTUM Nuclear Services Oy, Helsinki, Finland 3) VTT Finland, Helsinki, Finland
ABSTRACT
During years 2005 – 2006, a series of semi-large scale experiments on specimens containing underclad (embedded) crack were performed in NRI Rez. The experiments were performed within EU PHARE project EUROPAID/116529/D/SV/CZ, in cooperation with VTT, FNS, TVONS (Finland) and Tecnatom (Spain). The aim of the project was to investigate fracture mechanics properties of cladding, in particular, to establish the role of cladding in the fracture/failure process of the specimen, and to exploit the obtained knowledge in the procedure for evaluation of integrity of WWER reactor pressure vessels.
The specimens were manufactured from artificially aged material of decommissioned (not operated) reactor pressure vessel of WWER 440 Type NPP Nord. Each of the specimens contained through-thickness crack embedded in the base material (with approx. 3 mm ligament separating the upper crack front from cladding), and was loaded by 4PB loading at room temperature. During loading, majority of specimens exhibited pop-ins followed by ductile tearing of cladding and final failure; only 3 specimens fractured through suddenly, without preceding pop-ins. Evaluation of the experiments concentrated on both process of cleavage fracture in base material and process of ductile tearing in cladding.
In the presented paper, the results of experiments are in detail described, including photos from the experiments and photos taken with using high-speed video camera during some of experiments. New proposal for procedure of assessment of RPV integrity, based on the PHARE project results, is briefly presented.
TEST DESCRIPTION
Test Specimens
Material for the testing should represent the materials used for reactor pressure vessels (RPV) of WWER-440 type. Thus, real archive materials from decommissioned (not operated) RPV of unit 8 in NPP Nord were chosen. Several blocks of dimensions approximately 500x1000 mm were mechanically cut from the vessel – these blocks contain also full size austenitic cladding.
Then, these blocks have been heat treated by a special regime to obtain similar embrittlement (defined by material transition temperature) as have the vessels in operated NPPs at the end of their design lifetime. The resulting Master curve reference temperature T0 was approximately 20 °C. The material was well characterised by extensive programme of material testing (thermal-physical, tensile as well as fracture properties of both base material and cladding were measured).
From the aged block, test specimens representing beams for four-point bending with cross-section nominal dimensions 40 x 85 mm with cladding were manufactured. Scheme of the test specimen is given in Fig. 1. The specimen is composed of the middle part - insert from archive materials of 200 mm length, and 2 arms welded up to the insert so that the total length of the specimen is 670 mm. The cladding thickness was approximately 11 mm.
Support(Reaction Force F/2)
670 mm
(Total)Applied Force F Flaw Centreplane
248 mm 57 mm
Support(Reaction Force F/2)
Fig. 1. Scheme of experimental set-up for 4PB experiments
The embedded crack in the specimen was manufactured similarly as in the NESC IV project, i.e. a hole was drilled into the specimen from its flank and then an EDM notch was produced that was finally sharpened by fatigue cycling.
Specimens with two types of through-crack were tested:
• 8 specimens (called “normal specimens”) with embedded type cracks of length 15 mm, their upper front located approx. 3 mm under the fusion line of the cladding, both crack fronts are sharp (fatigue cycled).
• 3 specimens (called “abnormal specimens”) with embedded type cracks of length 40 mm, their upper front located approx. 3 mm under the fusion line of the cladding, only upper crack front is sharp, lower crack front was artificially blunted (by drilling).
Test Equipment
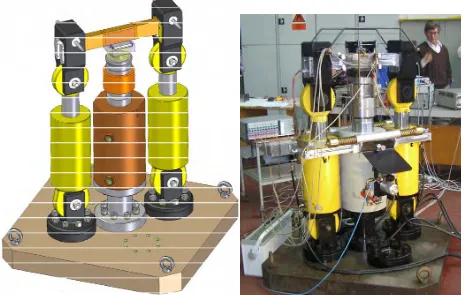
Scheme and photo of the experimental equipment are given in Fig. 2. Beam type specimen is located on the central mast. Two hydraulic cylinders serve as columns; loading was performed by central hydraulic cylinder with the maximum force equal to 1 MN.
The loading was controlled by a servo system that initiates a tension of piston in the central cylinder with respect to base plate through forks, pins and sleeves. Test beam is bent over two edges symmetrically located in the distance equal to 57 mm from transverse central axis. Thus, in the central part of the specimen (between both supporting edges) a constant bending moment is applied. The distance between symmetrical supporting locations and loading edges is 248 mm; maximum bending moment is equal to 124 kNm.
Regarding high accumulated energy in the system, the equipment is supplied by a safe catching cage that is able to catch and damp possible moving parts of the system.
Loading system of the specimen, its settling in central fastener, joint location of hydraulic cylinders, precise definition of loading forces location and other properties of the equipment assure that loading conditions of the specimen are repeatable. Loading during the test is controlled by the displacement of loading piston up to the fracture. Loading rate can be changed.
Test temperature during all tests was equal to a room temperature, i.e. in the range between 19 and 23 °C.
Fig. 2. Scheme and photo of the testing equipment
Testing Procedure
The following steps of the testing procedure were applied during the tests:
1. Identification of the specimen, identification of loading and fracture parameters, measurement of the specimen. 2. Assembling of the specimen in the test equipment, pre-loading up to approx. 5 kN (precise value is measured and
monitored during the experiment), installation of measuring devices.
3. Fracture test was realised by slow quasi-static loading up to specimen fracture or pop-in. In the case of pop-in, the test was stopped to take photos, etc., and then loading continued up to the specimen fracture. All measured parameters were continuously monitored. Fracture test usually lasted between 10 and 40 minutes.
4. Conservation of fracture surfaces against corrosion, identification and marking of broken arms, cutting off fracture surfaces and fractography were performed. The fractography analyses were focused on ductile tearing before cleavage fracture.
Measurements Performed
• Force measurements (load cell)
• Displacement measurements (calibrated to machine compliance) • 7 strain gauges measurements
• Crack mouth opening displacement measurements (CMOD, abnormal spec. only) • Direct current potential drop measurement (DCPD)
• Acoustic emission (selected specimens only)
• High speed video camera recording (selected specimens only)
TEST RESULTS
Total number of 8 normal and 3 abnormal specimens were tested. Three of normal specimens, reaching highest applied loads, failed suddenly (fractured through) after initiation of brittle fracture, while the five remaining normal specimens exhibited pop-ins with crack arrest both in cladding (close to cladding/base mat. interface) and in base material close to specimen bottom; the appropriate values of force just before pop-ins for these specimens were lower than those appropriate for specimens that fractured through. During subsequent loading, additional pop-ins as well as ductile tearing were observed before final specimen failure. All 3 abnormal specimens exhibited initiation of brittle fracture (pop-in) from the upper crack tip, crack arrest in the cladding (with no crack propagation from crack bottom hole) and some amount of ductile tearing in cladding during subsequent loading before the final specimen failure.
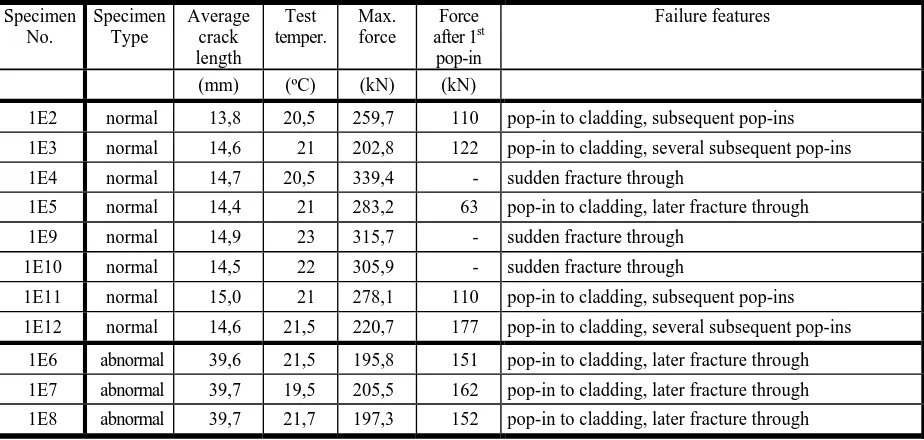
Main fracture test results, like load at initiation of fast fracture and load after first pop-in (for cases with crack arrest), crack dimensions and test temperatures, are summarized in Table 1.
Table 1. Main test results
Specimen No. Specimen Type Average crack length Test temper. Max. force Force after 1st pop-in
Failure features
(mm) (ºC) (kN) (kN)
1E2 normal 13,8 20,5 259,7 110 pop-in to cladding, subsequent pop-ins
1E3 normal 14,6 21 202,8 122 pop-in to cladding, several subsequent pop-ins
1E4 normal 14,7 20,5 339,4 - sudden fracture through
1E5 normal 14,4 21 283,2 63 pop-in to cladding, later fracture through
1E9 normal 14,9 23 315,7 - sudden fracture through
1E10 normal 14,5 22 305,9 - sudden fracture through
1E11 normal 15,0 21 278,1 110 pop-in to cladding, subsequent pop-ins
1E12 normal 14,6 21,5 220,7 177 pop-in to cladding, several subsequent pop-ins
1E6 abnormal 39,6 21,5 195,8 151 pop-in to cladding, later fracture through
1E7 abnormal 39,7 19,5 205,5 162 pop-in to cladding, later fracture through
1E8 abnormal 39,7 21,7 197,3 152 pop-in to cladding, later fracture through
The dependencies of applied force and crack half-length (measured by DCPM) on displacement are presented in Fig. 3, for specimen 1E3. The dependencies of applied force on displacement for all normal and abnormal specimens are presented in Fig. 4 and Fig. 5, respectively. The photos of 1E2 specimen after 1st pop-in and after fracture, as well as photo of its fracture surfaces are seen in Figs. 6 and 7.
1E3 force vs. displacement, displacements corrected to origin and to machine compliance 0 20 40 60 80 100 120 140 160 180 200 220 240 260 280
0 0,5 1 1,5 2 2,5 3 3,5 4 4,5 5 5,5 6
Displacement (mm) Load (kN)
0 3 6 9 12 15 18 21 24 27 30 33 36 39 42
Crack half length (mm)
Force Crack half length
Pop-in
Ductile tearing
Fig. 3. Specimen 1E3, force and crack half-length vs. displacement
Force vs. displacement, displacements corrected to origin and to machine compliance, all normal specimens
0 50 100 150 200 250 300 350
0 0,5 1 1,5 2 2,5 3 3,5 4 4,5 5 5,5 6 6,5 7
Displacement (mm) Load (kN) "1E2" "1E3" "1E4" "1E5" "1E9" "1E10" "1E11" "1E12"
Fig. 4. All normal specimens, force vs. displacement
Abnormal specimens, corrected displacements
0 50 100 150 200 250
0 0,5 1 1,5 2 2,5 3 3,5 4 4,5 5 5,5 6 6,5 7
Displacement (mm) Load (kN) "1E6" "1E7" "1E8"
Fig. 5. All abnormal specimens, force vs. displacement
Fig. 6. Specimen 1E2 after first pop-in and after fracture
High-Speed Video Camera Recording
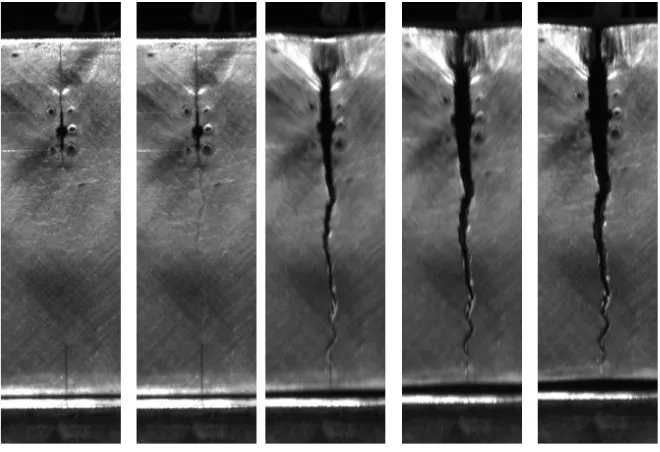
Four tests were recorded on high-speed video camera. Two cameras were used, one with recording frequency 1000 Hz and another with recording frequency 16000 Hz. The faster camera had, of course, smaller graphical resolution (32x1280 pixels only) than the slower one (480x640 pixels). Due to small graphical resolution of the fast camera, the interpretation of resulting figures is rather difficult. Sequences of photos of some important events of the tests (pop-ins, failure) are presented in Figs. 8 - 10. It should be noted that the photos In Figs. 9 and 10 correspond to each other, i.e. in Fig. 9 and 10 the situation at the upper and lower crack tips, respectively, is shown for 3 time moments following immediately one after another, with time difference 1/16 milliseconds.
It can be observed that crack propagation through the cladding is slower (several milliseconds) than cleavage fracture of base material (during one or two snaps with 16000 Hz frequency). From photos with faster camera for specimen 1E11 can be (with some uncertainty) observed that the bottom (lower) crack tip initiated one snap (i.e. 1/16000 s) earlier than the upper crack tip. This result confirms some of the analytical results based on examination of constraint effect with using T-stress approach (see the parallel paper [1]). However, the exact experimental confirmation that the first initiation of cleavage fracture occured at the lower crack tip is still missing.
Fig. 7. Fracture surfaces of specimen 1E2
Fig. 8 Specimen 1E9, video camera frequency 1000 Hz
Fig. 9 Specimen 1E11, video camera frequency 16000 Hz, upper crack tip
Fig. 10 Specimen 1E11, video camera frequency 16000 Hz, lower crack tip
DISCUSSION OF POTENTIAL FOR CRACK ARREST
The experiments showed significant variability in behaviour of specimens during loading (some specimens exhibited pop-ins,
No crack
propagation
Crack
propagatio
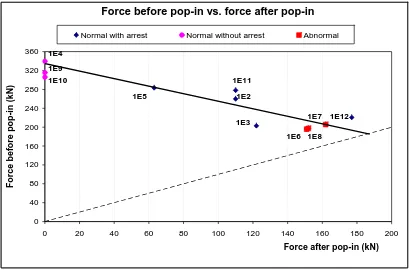
some fractured through suddenly, and besides of that, different depth of lower ligament after 1st pop-in as well as different depths of crack penetration into cladding were observed). Nevertheless, some basic experimental correlations were identified, one of them is illustrated in the Fig. 11. In this figure, force before pop-in/fracture vs. force after pop-in/fracture is plotted. A clear tendency is seen in this figure: The higher is the force before pop-in/fracture; the lower is the force after pop-in/fracture. The dashed line represents 1:1 line; all data points have to lie above this line (force decreases during pop-in).
Full line represents trend line constructed for data points relevant to the specimens that exhibited pop-in (both normal and abnormal). We see that for zero force after pop-in corresponding to fracture through this trend line gives force before pop-in of about 335 kN, which is in good accord with experimental data for specimens that fractured through suddenly (minimum experimental value of force before pop-in for these specimens is 306 kN). The energy accumulated in specimens that sustained higher force than approx. 300 kN is very high, in consequence of which the cracks of these specimens do not have potential to arrest in cladding after initiation of cleavage fracture and sudden fracture through occurs. In the figure, data points for both normal and abnormal specimens lie in the vicinity of common trend line despite the significant difference in crack geometry between normal and abnormal specimens.
Force before pop-in vs. force after pop-in
0 40 80 120 160 200 240 280 320 360
0 20 40 60 80 100 120 140 160 180 200
Force after pop-in (kN)
Force before pop-in (kN)
Normal with arrest Normal without arrest Abnormal
1E10 1E9 1E4 1E5 1E11 1E2 1E12 1E7 1E8 1E6 1E3
Fig. 11 Force before pop-in in dependency on force after pop-in or after fracture
ONCLUSIONS
he semi-large scale tests performed on cladded specimens with embedded cracks produced large set of experim
t, a proposal for enhancement of procedure used for
ive set of further analyses of the tests may be expected within the NESC VI project in near future.
REFFERENCES
] Lauerova D., Pistora V., Kacor A., Brumovsky M.: Evaluation of constraint in semi-large scale experiments performed
[2] h
Framework Programme of the EU, final version, 2003 C
T
ental data concerning initiation of brittle fracture in base material, crack arrest in 1st layer of cladding and ductile tearing and pop-ins in cladding. Some results of finite element analyses of these tests, focused on brittle fracture initiation, T-stress and constraint effect assessment, are presented in the parallel paper [1].
Based on these and other analyses performed within the PHARE projec
assessment of underclad cracks during pressurised thermal shocks (PTS), as prescribed in VERLIFE Unified Procedure [2], was developed. In the new proposal, the crack is postulated in such a manner that it penetrates 1 mm into cladding. For assessment of the crack front lying in cladding the J-integral is evaluated and compared with J1mm value defined on the basis of J-R curve.
Performing extens
[1
on specimens with underclad cracks, Proc. of 19th SMIRT conference, Paper No. 1901, Toronto, Canada, August 2007
Unified Procedure for Lifetime Assessment of Components and Piping in VVER NPPs, VERLIFE, project of the 5t