Comparative Study of Pushover Analysis of
the Conventional Slab System with two
Outrigger levels
Santhosh D.
1, R. Prabhakara
2, Sahana Ponnamma T.D.
3Assistant Professor, Department of Civil Engineering, M.S.Ramaiah Institute of Technology, Bangalore, Karnataka,
India1
Head of Department, Department of Civil Engineering, M.S.Ramaiah Institute of Technology, Bangalore, Karnataka,
India2
Research Scholar, Department of Civil Engineering, M.S.Ramaiah Institute of Technology, Bangalore, Karnataka,
India3
ABSTRACT: Outrigger systems have been efficient in stiffening the structure against lateral loads like wind or earthquakes. So, in order to know more about their effects on the structure and their behaviour under earthquake loads, an overall seismic evaluation and comparison of 30 storey building located in zone 2 with conventional slab system having a central shear wall core with 1 and 2 outrigger levels are demonstrated in this paper. Pushover analysis was performed using ETABS 9.7.4 on the models and using the performance parameters like Base force, Displacement,
Storey drift,Spectral acceleration and Spectral displacement and relevant conclusions were drawn. The outrigger struts
was placed at 0.25h & 0.5h, 0.25h & 0.75h, 0.25h & 1h, 0.5h & 0.75h, 0.5h & 1h, 0.75h & 1h to check for the most beneficial location for the 2 outrigger levels in a structure. Also, the status and location of plastic hinges at the performance point obtained from static pushover results showed that performance levels for almost all the models were found to lie in between Life safety to Collapse prevention range.
KEYWORDS: Pushover analysis, Outrigger systems, Inter storey drifts, Plastic hinges.
I. INTRODUCTION
Pushover Analysis predicts the structural response similar to that of the other 2 methods- response spectra and time history analysis since it incorporates p - Δ effects and material non linearity which are true in real structures. Performances of structures are normally predicted accurately by analysing carefully, the performance parameters obtained from pushover analysis results. The demand curve, capacity curve and the category of performance level it belongs to like Immediate occupancy, Life Safety or Collapse Prevention directly tells us if the structure is safe or about to collapse. Outrigger systems are the horizontal elements like a deep beam or cross bracing struts designed to improve the structure’s overturning stiffness and strength by connecting the building core or spine to the distant or exterior most columns and keeping the columns in their position in turn reducing sway. By providing outrigger systems in high rise buildings, it was seen that the lateral displacement and inter storey drifts in the top stories were much lower than the building frames without outriggers. A lot of analytical studies are needed to understand the influence of the performance parameters and the no. of outrigger levels in the structural performance of the conventional slabs systems. This scholarship of knowledge will be useful for the design engineers to effectively model the structure for seismic performance.
II. REVIEW OF LITERATURE
considerations for outrigger application, effects on behaviour of the structure. They observed that the Outriggers improve the stiffness against overturning by developing a tension-compression couple in perimeter columns when a central core tries to tilt, generating restoring moment acting on the core at the outrigger level [8] and thereby reduce the lateral displacements. N. Herath, et al conducted a parametric study on the behaviour of Outrigger Beams in High rise Buildings under Earthquake Loads and suggested the optimum outrigger height for the building from the base to be 0.44-0.48 times the total height for both earthquake and wind loads [7]. Po Seng Kian [4] and Kiran Kamath, et al [3] have also concluded the mid height of the structure to be the optimum outrigger height. The best location for one outrigger in a structure was found to be 0.6 times the height of the whole structure and 2nd of 2 outriggers in the structure was at 0.5 times the structure height while one is fixed at the top level according to S. Fawzia and T. Fatima [9]. In our present work, the behaviour of 30 storey RC frame building having conventional slab system was studied with one outrigger level and 2 outrigger levels so as to know the effect of no. of outrigger levels in a structure on its lateral force resistance.
III. MODELLING AND ANALYSIS
3.1 Scope of present work
After understanding the literature, the objectives of the present investigation were carved. Analysis of the 3D models of the 30 storey building located in zone 2 has been performed and overall seismic evaluation of the structures were carried out using the performance parameters obtained from the Pushover analysis using the software ETABS 9.7.4 for the cases given below:
Case 1: RC bare frame with conventional slab system and central shear wall core with single outrigger level at the optimum height of 0.5h [CVBFSW015]
Case 2: RC bare frame with conventional slab system having shear wall with 2 outrigger levels
Outrigger struts at 0.25h & 0.5h [CVBFSW07,15]
Outrigger struts at 0.25h & 0.75h [CVBFSW07,22]
Outrigger struts at 0.25h & 1h [CVBFSW07,30]
Outrigger struts at 0.5h & 0.75h [CVBFSW015,22]
Outrigger struts at 0.5h & 1h [CVBFSW015,30]
Outrigger struts at 0.75h & 1h [CVBFSW022,30]
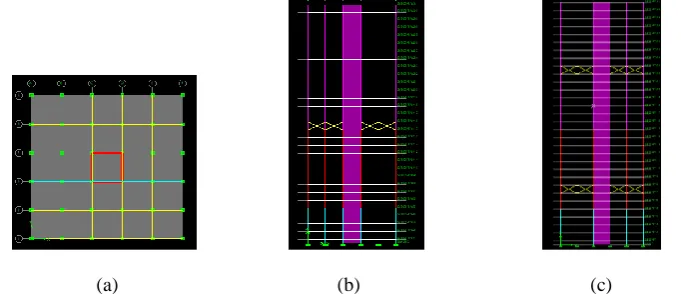
3.2 Structural details and material properties In the present study, 30 storey building with plan area 25m x 25m and 5 no. of bays in both x and y direction was considered. The typical floor height was taken as 3m and plinth level being 1.5m from the base giving a total height of the structure 91.5m. The beams, columns, shear walls and outriggers were assumed as concrete structure. The Plan & elevation of RC frame with conventional slab system and central shear wall core with single Outrigger level at 0.5h and elevation of RC frame with conventional slab system and central shear wall core with 2 Outrigger levels at 0.25h and 0.75h has been shown in the figure 1(a), 1(b) and1(c).
The geometric properties, material properties and the structural properties in the form of the data to be given in the ETABS are outlined in the table 1
Table 1: Geometric properties, Material properties and the Structural properties assigned to the models
3.3 Modeling and Analysis
Modeling is an important stage in the analysis of multistoried buildings. The steps followed in modeling the structure are listed below:
1. Creating the basic computer model (without the pushover data)
2. Choosing the concrete frame design code preference.
3. Defining material properties
4. Evaluation of the sectional properties of the beams, columns, slabs using trial runs. [Regular shaped slabs like
rectangular were designed as membrane type and irregular shaped slabs and shear walls were designed as shell element. Load distribution pattern in the model was taken as 2 way slab type.]
5. Positioning of the beams, columns, slabs and shear walls.
6. Assigning boundary conditions- In all the models, base was considered to be fixed support.
7. Defining the static load cases- Dead load, Live load, Super dead load and seismic loadings as per IS 1893-2002
were considered. In order to have a realistic analysis, the structural properties and model details were arrived based on the previous literatures and is given in the table 2. User defined time period, seismic coefficients, factors and storey ranges were input in to the software.
Table 2: Structural properties and Model details Column to Column spacing
In X-direction 5m
In Y-direction 5m
Support condition Fixed
Conventional Slab thickness 150mm
Outrigger size 300 x 300mm
Shear wall thickness 300mm
Column sizes- 1-5 floors 1000 x 1000mm 6-15 floors 800x800mm 16-20 floors 700x700mm 21-30 floors 500x500mm
Beam size All the floors 230x 450mm
Grade of concrete M25
Grade of steel Fe 415
Modulus of elasticity of M25 25000000kN/m2
Poisson’s ratio 0.2
Coefficient of thermal expansion 9.900E-06
Shear modulus 10416666.7 kN/m2
Type of structure OMRF
Damping ratio 5%
Seismic details conforming to IS 1893(Part 1): 2002
Zone factor 0.10
Importance factor 1
Type of soil Type II (Medium)
8. Specification of structural loads and load combinations
Loads assigned to the slabs, Live load = 3 kN/m2
Default load combinations given in the software were considered.
9. Defining mass source as per IS 1893(Part 1): 2002
Analysis in ETABS 9.7.4
A detailed analysis was carried out in the PG lab at the department of Civil Engineering, MSRIT, Bangalore, affiliated to VTU, Belagavi. Analysis of the models consists of 3 stages, viz., Static analysis, Designing and Pushover analysis. After the modelling, the basic static analysis was run followed by the designing process of the concrete frame structure. For the next stage, which is pushover analysis, prefixing of the hinge points were carried out. The software Etabs includes several built in default hinge properties that are based on average values from ATC-40 (Applied Technology Council) for concrete and average values from FEMA-273 (Federal Emergency Management Agency) for steel members. In this analysis, only user defined hinge properties were considered. For the columns, default PMM hinges were assigned and for the beams, default M3 hinges were taken.
Typically a gravity load pushover is force controlled and lateral pushover is displacement controlled. In our analysis in Etabs 9.7.4 more than 1 pushover load cases were defined and were run in the same analysis. The user defined pushover displacement magnitude of 3.66m obtained by default for each model was applied and load pattern was taken as acceleration in direction X for a scale factor of -1. Finally, the static non linear pushover analysis was run. After the analysis was complete, static nonlinear pushover curve and the pushover table was obtained. As the values of seismic coefficient of acceleration, Ca & seismic coefficient of velocity Cv, damping ratios etc., were varied, the pushover curves and performance point values changed accordingly. The required Ca & Cv values were entered depending on the soil type and seismic zone considered and the observations were made regarding the performance of the model and relevant conclusions were drawn by reviewing the pushover displaced shaped, the performance point and sequence of hinge formation.
IV. RESULTS AND DISCUSSIONS
The efficient lateral force resistance was seen in the structure with two outrigger levels compared to single
outrigger level. Detailed observations of the results obtained from the analysis of 30 storey building having shear wall
with 1 and 2 outrigger levels were recorded and are given below:
4.1 Single outrigger level
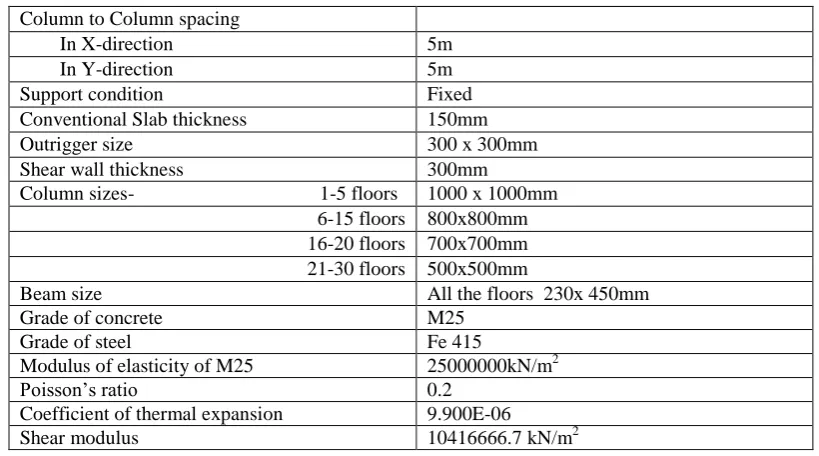
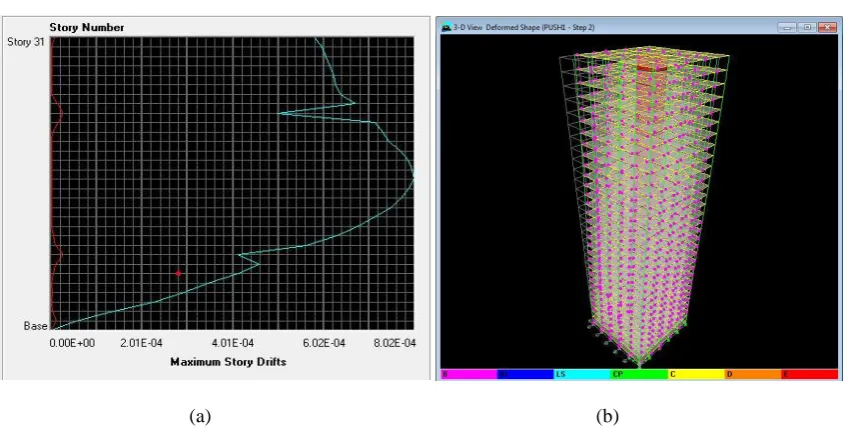
For the better understanding of the performance of the structure, the Pushover curve and the demand curve represented in the figure 2(a) and 2(b) has been plotted. The Storey drift diagram along EQX direction, Status of plastic hinges at the performance point, Data of pushover curve for the 30 storey bare frame with conventional slab system and central shear wall core with outrigger at floor 15 are presented in the figure 3(a), 3(b) and table 3 respectively.
(a) (b)
(a) (b)
Figure 3(a): Storey drift diagram along EQX direction for CVBFSW015 (b) Status of plastic hinges at the performance point for CVBFSW015
Table 3: Data of pushover curve for CVBFSW015
Step Displacement Base Force A-B
B-IO IO-LS
LS-CP
CP-C
C-D
D-E
>E TOTAL NO. OF
HINGES
0 0.0000 0.0000 5948 4 0 0 0 0 0 0 5952
1 0.0369 2254.0728 4912 1040 0 0 0 0 0 0 5952
2 0.2006 10288.3516 3874 2052 26 0 0 0 0 0 5952
3 -0.3491 -15099.956 5952 0 0 0 0 0 0 0 5952
4.2 Two outrigger levels
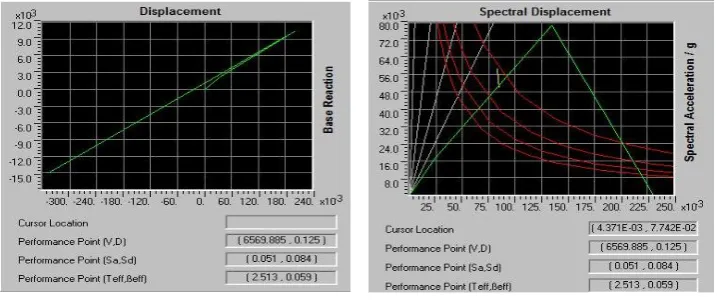
The Pushover curve and the demand curve for the bare frame with conventional slab system and central shear wall with outriggers at floor 7 & 22 model are represented in the figure 4(a) and 4(b). Storey drift diagram along EQX direction, Status of plastic hinges at the performance point, Data of pushover curve for the CVBFSW07, 22 are presented in the figure 5(a), 5(b) and table 4 respectively.
(a) (b)
(a) (b)
Figure 5: a) Storey drift diagram along EQX direction for CVBFSW07, 22 b) Status of plastic hinges at the performance point for CVBFSW07, 22
Table 4: Data of pushover curve for CVBFSW07,22
Step Displacement (m)
Base Force
(kN) A-B B-IO IO-LS LS-CP CP-C C-D D-E >E
TOTAL NO. OF HINGES
0 0.0000 0.0000 5948 4 0 0 0 0 0 0 5952 1 0.0373 2602.8035 4462 1490 0 0 0 0 0 0 5952 2 0.2050 11241.5078 3890 1940 118 4 0 0 0 0 5952 3 0.3544 15460.8838 5952 0 0 0 0 0 0 0 5952
4.3 Discussions
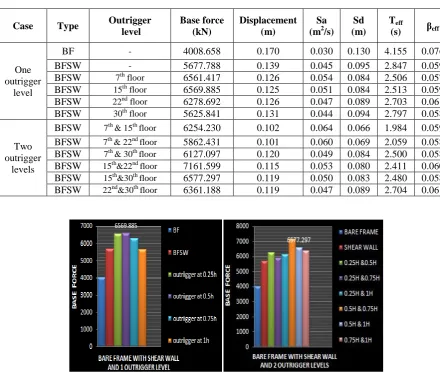
In order to have a comparative evaluation of single and two outrigger level systems, variations of the performance parameters at the performance point are given in the following table 5. The comparison of base force and displacement separately in the form of bar charts for both one and two outrigger level cases are shown in the figure 6 & 7 respectively. Storey drift values for each floor and the graph of storey drift vs. storey height is plotted in a graph for all the models are given in the table 6 and graph 1. The percentage increase in base force and reduction in displacement for
CVBFSW, CVBFSW07,15, CVBFSW07,22, CVBFSW07,30, CVBFSW015,22, CVBFSW015,30 and
Table 5: Comparison of Performance parameters at the performance point for the models with Conventional slab system having one outrigger level and two outrigger levels are shown below
Case Type Outrigger
level
Base force (kN)
Displacement (m)
Sa (m2/s)
Sd (m)
Teff
(s) βeff
One outrigger
level
BF - 4008.658 0.170 0.030 0.130 4.155 0.076
BFSW - 5677.788 0.139 0.045 0.095 2.847 0.059
BFSW 7th floor 6561.417 0.126 0.054 0.084 2.506 0.057
BFSW 15th floor 6569.885 0.125 0.051 0.084 2.513 0.059
BFSW 22nd floor 6278.692 0.126 0.047 0.089 2.703 0.061
BFSW 30th floor 5625.841 0.131 0.044 0.094 2.797 0.058
Two outrigger
levels
BFSW 7th & 15th floor 6254.230 0.102 0.064 0.066 1.984 0.059
BFSW 7th & 22nd floor 5862.431 0.101 0.060 0.069 2.059 0.058
BFSW 7th & 30th floor 6127.097 0.120 0.049 0.084 2.500 0.058
BFSW 15th&22nd floor 7161.599 0.115 0.053 0.080 2.411 0.060
BFSW 15th&30th floor 6577.297 0.119 0.050 0.083 2.480 0.058
BFSW 22nd&30th floor 6361.188 0.119 0.047 0.089 2.704 0.061
Figure 6: Comparison of Base force (kN) at performance point obtained for the models of one and two outrigger levels
Table 6: Storey drift values of each floor for CVBFSW07,15, CVBFSW07,22, CVBFSW07,30, CVBFSW015,22, CVBFSW015,30 and CVBFSW022,30 models are shown below
STOREY NO.
STOREY HEIGHT
(m)
Drift X (m)
CVBFW 07,15,
CVBFW 07,22,
CVBFW 07,30,
CVBFSW 015,22,
CVBFW 015,30
CVBFW 022,30
STORY30 91.5 0.000724 0.000582 0.000517 0.000704 0.000482 0.00035
STORY29 88.5 0.000745 0.000598 0.000725 0.000724 0.000657 0.000496
STORY28 85.5 0.000755 0.000606 0.000759 0.000733 0.000686 0.000524
STORY27 82.5 0.00077 0.000615 0.00082 0.000743 0.000736 0.000563
STORY26 79.5 0.000785 0.000624 0.000886 0.000751 0.000789 0.0006
STORY25 76.5 0.000799 0.000628 0.000949 0.000753 0.000838 0.000637
STORY24 73.5 0.00081 0.000638 0.001006 0.000759 0.00088 0.000662
STORY23 70.5 0.000816 0.000671 0.001057 0.00079 0.000914 0.000698
STORY22 67.5 0.000817 0.0005 0.001102 0.000593 0.00094 0.000485
STORY21 64.5 0.000812 0.000715 0.001138 0.000815 0.000957 0.000805
STORY20 61.5 0.000811 0.000733 0.001184 0.000819 0.000977 0.000881
STORY19 58.5 0.000776 0.000745 0.001178 0.000814 0.000953 0.000937
STORY18 55.5 0.000758 0.000772 0.00119 0.000827 0.000947 0.001001
STORY17 52.5 0.000737 0.000789 0.001191 0.000838 0.000938 0.001054
STORY16 49.5 0.000705 0.000798 0.001183 0.000832 0.000913 0.001094
STORY15 46.5 0.000541 0.000802 0.001169 0.000668 0.000716 0.001127
STORY14 43.5 0.000664 0.000789 0.001136 0.000844 0.000899 0.001136
STORY13 40.5 0.000663 0.000774 0.001103 0.000867 0.000917 0.00114
STORY12 37.5 0.000646 0.00075 0.001058 0.000872 0.000915 0.001133
STORY11 34.5 0.000626 0.000716 0.001002 0.000873 0.00091 0.001113
STORY10 31.5 0.0006 0.000675 0.000937 0.000864 0.000896 0.001081
STORY9 28.5 0.000569 0.00063 0.000868 0.000842 0.00087 0.001036
STORY8 25.5 0.000517 0.000563 0.00077 0.000806 0.00083 0.000978
STORY7 22.5 0.000386 0.000413 0.000558 0.000756 0.000776 0.000906
STORY6 19.5 0.000431 0.000458 0.000618 0.000692 0.000709 0.00082
STORY5 16.5 0.000392 0.000413 0.000554 0.000607 0.00062 0.000711
STORY4 13.5 0.000331 0.000345 0.000461 0.000515 0.000525 0.000598
STORY3 10.5 0.000283 0.000293 0.00039 0.00043 0.000438 0.000497
STORY2 7.5 0.000221 0.000227 0.0003 0.000328 0.000333 0.000378
STORY1 4.5 0.000135 0.000138 0.000182 0.000195 0.000198 0.000224
Table 7: The percentage increase in base force and displacement for CVBFSW, CVBFSW07,15, CVBFSW07,22, CVBFSW07,30, CVBFSW015,22, CVBFSW015,30 and CVBFSW022,30 in comparison with
CVBF are given below
Percentage increase in Base force Percentage reduction in displacement
CVBFSW 41.638% 18.235%
CVBFSW07,15 56.018% 40.000%
CVBFSW07,22 46.244% 40.588%
CVBFSW07,30 52.846% 29.411%
CVBFSW015,22 78.653% 32.352%
CVBFSW015,30 64.077% 30.000%
CVBFSW022,30 58.686% 30.000%
Graph 1: Storey height vs. displacement due to EQX plotted for CVBF, CVBFSW, CVBFSW07,15, CVBFSW07,22, CVBFSW07,30, CVBFSW015,22, CVBFSW015,30, CVBFSW022,30 and CVBFSW015 models
It is observed that the percentage increase in base force obtained from the model with two outrigger levels was found to be 0.112% higher than one outrigger level case and percentage reduction in the displacement was found to be 19.2% less than the model with just one outrigger level. By providing 2 outrigger levels, the lateral displacement reduced with a good margin without much increase in base force. The storey drift variation along the building height of the 2 outrigger level models to that of the single outrigger level.
V. CONCLUSIONS
The current investigation was carried out to analyse the effect of no. of outrigger systems. This attempt was made in order to understand the potential use and efficiency of outriggers in seismic zones. Based on the pushover analysis conducted and the observations made during the present investigation the following conclusions were drawn:
It was observed that the Pushover analysis was an efficient, simple method for seismic evaluation of structures
whose results are comparable to the other 2 methods of analysis.
It was concluded that the optimum level for providing outriggers is at 0.25h and 0.75h for the 2 outrigger level
case. 0 10 20 30 40 50 60 70 80 90 100
0 0.0005 0.001 0.0015 0.002
STORE Y H EIGH T DISPLACEMENT BF SW
OUTRIGGERS AT FLOOR 7 &15
OUTRIGGER AT FLOOR 7 & 22
OUTRIGGER AT FLOOR 7 & 30
OUTRIGGER AT FLOOR 15 &22
OUTRIGGERS AT FLOOR 15 & 30
OUTRIGGERS AT FLOOR 22 & 30
Provision of 2 outriggers in a structure gave reduced lateral displacement when compared to the single outrigger level case.
The hinge status and location has been noted down at the performance point obtained from static pushover
results and the overall performance levels for almost all the 30 storey building models were found lie in between Life safety to Collapse prevention range.
REFERENCES
[1] Sahana Ponnamma T.D., Santhosh D., R. Prabhakara, “Comparative Study of Pushover Analysis of the Conventional Slab System with
Outrigger and Flat Slab System with Outrigger”, International Journal of Innovative Research in Science, Engineering and Technology, ISSN: 2319-8753, Vol. 4, Issue 8, August 2015
[2] D. Santhosh, “Pushover analysis of RC frame structure using ETABS 9.7.1”, IOSR Journal of Mechanical and Civil Engineering, ISSN:
2278-1684, Volume 11, Issue 1 Ver. V, Feb. 2014.
[3] Kiran Kamath, N. Divya and Asha U. Rao, “A Study on Static and Dynamic Behaviour of Outrigger Structural System for Tall Buildings”,
Bonfring International Journal of Industrial Engineering and Management Science, Vol. 2, No. 4, December 2012.
[4] Po Seng Kian, “The use of outrigger and belt truss system For high-rise concrete buildings”, Dimensi Teknik Sipil, ISSN 1410-9530, Vol. 3,
No. 1, Maret 2001.
[5] Srividya, Kalayani Rao, Kavya and R. Prabhakara, “Cracking Load and Deflection of Infilled Frames Using Pushover Analyses”, Proceedings
of international conferences on advances in Architecture and civil engineering, Vol.1, Paper ID sam209, June 2012.
[6] Santhosh. D.and N. Jayaramappa, “Non linear static analysis of RC frame structures”, IOSR journal of mechanical and civil engineering, ISSN:
2278-1684Vol. 11, Issue 02, Ver 2., pp 78-89 March april-2014.
[7] N. Herath, N. Haritos, T. Ngo & P. Mendis, “Behaviour of Outrigger Beams in High rise Buildings under Earthquake Loads”, Australian Earthquake Engineering Society Conference, Civil & Environmental Engineering, University of Melbourne, Parkville, Victoria 3010, 2009. [8] Hi Sun Choi and Leonard Joseph, “Outrigger system deisgn considerations”, International journal of high-rise buildings, Vol. 1, No. 3,
september 2012.
[9] S. Fawzia and T. Fatima, “Deflection Control in Composite Building by Using Belt Truss and Outriggers Systems”, International Scholarly
and Scientific Research & Innovation, World Academy of Science, Engineering and Technology, Vol. 4, 2010-12-22, 2010.
[10] IS 1893 “Criteria for Earthquake Resistant Design of Structures, Part1: General Provisions and Buildings”, Bureau Of Indian