Copyright2000 by the Genetics Society of America
When Did the Human Population Size Start Increasing?
Jeffrey D. Wall* and Molly Przeworski
†,1*Department of Ecology and Evolution and†Committee on Evolutionary Biology, University of Chicago, Chicago, Illinois 60637 Manuscript received November 12, 1999
Accepted for publication April 21, 2000
ABSTRACT
We analyze the frequency spectra of all available human nuclear sequence data sets by using a model of constant population size followed by exponential growth. Parameters of growth (more extreme than or) comparable to what has been suggested from mtDNA data can be rejected for 6 out of the 10 largest data sets. When the data are separated into African and non-African samples, a constant size no-growth model can be rejected for 4 out of 8 non-African samples. Long-term growth (i.e., starting 50–100 kya) can be rejected for 2 out of 8 African samples and 5 out of 8 non-African ones. Under more complex demographic models, including a bottleneck or population subdivision, more of the data are compatible with long-term growth. One problem with the data used here is that a subset of loci may reflect the action of natural selection as well as of demography. It remains possible that the correct demographic model is one of constant population size followed by long-term growth but that at several loci the demographic signature has been obscured by balancing or diversifying selection. However, it is not clear that the data at these loci are consistent with a simple model of balancing selection; more complicated selective alternatives cannot be tested unless they are made explicit. An alternative explanation is that population size growth is more recent (e.g., upper Paleolithic) and that some of the loci have experienced recent directional selection. Given the available data, the latter hypothesis seems more likely.
W
ITH the world’s population now in excess of 6 intermediate frequency variants and positive D and D* values. The D and D* values for human mtDNA are billion, it is clear that the human population sizehas not remained constant over time. What is still uncer- sharply negative, as are the values for the Y chromosome
(Underhillet al. 1997;R. Thompson, J. K. Pritchard,
tain is when human populations started to expand in
size. Did this happen 50–100 thousand years ago (kya) P. Shen, P. J. OefnerandM. W. Feldman,unpublished results).
during the Upper Paleolithic (e.g., Rogers and
Har-pending1992;Di Rienzoet al. 1998;Stineret al. 1999) Nonetheless, mtDNA and the nonrecombining
por-tion of the Y chromosome are but two loci experiencing or only recently after the invention of agriculture
roughly 12 kya? little (Awadalla et al. 1999) or no recombination, so
the effects of demography are confounded with those The original arguments for earlier growth were based
on mtDNA data (Di RienzoandWilson1991;Rogers of natural selection and genetic drift. Recent positive
and Harpending 1992; Sherry et al. 1994). mtDNA selection at any one site could produce the observed
data show an excess of rare mutations over equilibrium excess of rare mutations at linked neutral sites (
Braver-neutral expectations, which could be a signature of re- manet al. 1995), as could selection against weakly delete-cent population growth (SlatkinandHudson1991). rious mutations (for evidence of purifying selection in Two standard test statistics, D (Tajima 1989a) and D* the mtDNA, see, e.g.,Nachman et al. 1996;Wise et al. (Fu andLi 1993), measure whether the observed fre- 1998). If these loci are indeed affected by selection then quencies of segregating mutations are compatible with it is unclear whether the observed D and D* tell us the frequencies expected under the standard null anything about past human population sizes. The effect model. Some departures from the null model (e.g., re- of natural selection and other confounding factors can cent increases in population size, linkage to a locus be controlled for if multiple independent nuclear loci under directional selection) lead to an excess of low are considered: selection affects only a small region frequency variants and negative D and D* values, while while the effects of demography are visible throughout others (e.g., population subdivision, linkage to a site the whole genome. There are now data available from under balancing selection) tend to cause an excess of a multitude of microsatellite loci (e.g., Di Rienzoet al. 1998;Kimmelet al. 1998;ReichandGoldstein1998), as well as a handful of nuclear sequence studies (e.g.,
Corresponding author: Jeffrey D. Wall, 2102 Biological Laboratories, Hardinget al. 1997;Clarket al. 1998;HarrisandHey
Harvard University, 16 Divinity Ave., Cambridge, MA 02138.
1999).
E-mail: [email protected]
Microsatellite studies generally find evidence for a
1Present address: Department of Statistics, Oxford University, 1 South
Parks Rd., Oxford OX1 3TG, United Kingdom. more ancient start to population growth, but they differ
on the estimates of the time of expansion and the groups its use in previous studies (e.g.,Hey1997;FayandWu
1999) and D* because simulations suggest that D* is involved. For example, Reichand Goldstein (1998)
find evidence for population growth in African popula- more effective than D in detecting recent population growth (see results). We focus on weak models of tions but not in non-African populations, whileKimmel
et al. (1998) conclude just the opposite. In addition, growth: a 10-fold or 100-fold increase in size, unlike the more than 150-fold growth ofRogersandHarpending
the studies consider different scenarios of population
growth.ReichandGoldstein(1998) consider a model (1992) or the more than 5000-fold estimated increase in census population size (cf.Weiss1984). We do so to of sudden population expansion (i.e., a small constant
size before some fixed time and a large constant size be conservative and to maximize the chance that the data are compatible with population growth. We also after this time) and suggest that the lack of a signal of
population expansion in non-African populations may discuss simulations of more complicated models that include a bottleneck or population subdivision. This have been caused by a bottleneck associated with their
initial migration from Africa. In contrast,Kimmelet al. discussion is merely qualitative, as distinguishing be-tween more parameter-rich models requires more than (1998) find support for a model of a bottleneck followed
by population growth (but not a model of constant size the simple analyses performed here (HeyandHarris
1999) and more consistently sampled data. followed by population growth), whileDi Rienzoet al.
(1998) examine the extreme scenario of rapid growth While clearly of interest, the relation of simple demo-graphic models to debates about human origins is un-from an initially monomorphic population (i.e., a star
phylogeny). In addition to these differences, there is clear. Indeed, theories of human evolution are often too complex or not specific enough to be testable. The some uncertainty in the estimates of mutation rates and
in the underlying mutation process, so the estimates of single origin model (e.g.,StringerandAndrews1988) often assumes explicitly that modern human popula-the time since popula-the start of growth might not be reliable.
For example, two recent studies conclude that the onset tions expanded in size as they replaced archaic popula-tions (e.g., Rogers and Harpending 1992). For this of growth could have been more recent (i.e., 10–20 kya;
Pritchardet al. 1999;Gonseret al. 2000). reason, evidence for long-term exponential growth from
mtDNA and microsatellites has been interpreted as sup-An additional source of information regarding past
population sizes comes from nuclear sequence studies. port for the single origin model (Harpending et al. 1998). However, the multiregional hypothesis (e.g., More than half of nuclear loci have positive Tajima’s D
values (Przeworskiet al. 2000), so they do not provide Wolpoffet al. 1984) is compatible with both an early or a late start for population growth. As this article and evidence for recent population growth (e.g.,Harding
et al. 1997;Hey1997;Zietkiewiczet al. 1998). On the others demonstrate, nucleotide polymorphism data can fruitfully be used to test specific demographic models. basis of three small data setsHey(1997) has shown that
the difference in D values between mitochondrial and However, no conclusions can be drawn about more gen-eral models of human evolution until these are better nuclear loci is larger than expected under either a
model of constant population size or a model of recent specified. exponential growth. It remains unknown whether the
positive Tajima’s D values at a larger set of nuclear loci
MATERIALS AND METHODS are compatible with the models of population growth
proposed from mtDNA and microsatellite data. In this We examine all human nuclear sequence data sets for which article, we test this question explicitly. We analyze all frequency data were available; the sample size (n) was at least available studies of human nuclear sequence variation. 10, and the number of segregating sites (S) was at least four. Some studies were excluded (e.g.,Hammeret al. 1997;Jinet We focus on whether data are consistent with the
pre-al. 1999;Petersonet al. 1999) because of biases in the process dicted effects of population growth and examine
of data collection (e.g., polymorphisms not uniformly assayed whether there are noticeable differences between
Afri-in all Afri-individuals). We also exclude all human major histocom-can and non-Afrihistocom-can samples. We do not use single patibility complex (MHC) loci, which are likely to be affected nucleotide polymorphism (SNP) data (e.g.,Cargillet by strong selection (either directly or at linked loci). Only biallelic mutations (both point mutations and indels) were al. 1999; Halushka et al. 1999) both because of the
included. The findings are essentially the same when overlap-high error rate involved in SNP detection when SNPs
ping mutations (e.g., in Pdha1, Harris and Hey 1999, or are not confirmed by sequencing (e.g.,Halushkaet al.
in Dys44,Zietkiewicz et al. 1998) are included (results not 1999) and because of possible biases in the frequency shown). Heterozygosity was calculated as, the (per-site) aver-spectrum recovered by variant detection arrays (cf. age frequency of pairwise differences (Tajima 1983). For Dys44, the frequencies of alleles were determined from a larger
Przeworskiet al. 2000).
sample (cf.Zietkiewiczet al. 1998), since data from the origi-We consider a model of constant population size
fol-nal ascertainment sample were not available. lowed by exponential growth (cf.Marjoramand
Don-We assume a neutral infinite-sites model for our simulations.
nelly 1994) and determine whether the observed D The P values for D and D* were determined directly from
(cf.Hudson1993). A total of 105replicates were run for each (“bottlenecks”) followed by exponential growth at time T. Stepwise changes in population sizes are straightforward to parameter combination described below. The simulations
re-quire some assumption about the population recombination implement in a coalescent setting (Tajima1989b). We con-sider a model of a constant ancestral population size of N⫽ rate C⫽4Nr (N is the effective population size and r is the
recombination rate per locus per generation). Assuming no 104, followed by a reduction in population size to N ⫽ 103 lasting 10 thousand years (kyr), followed by exponential recombination (C⫽0) is generally conservative for assessing
the significance levels of D and D* (Wall 1999), but this growth to a current population size of N⫽106. The time since the start of growth varies from T⫽0–100 kyr, and a generation assumption may not be appropriate; most nuclear data sets
show evidence of recombination (seediscussion). Since on time of 20 yr is assumed. We present only these limited simula-tions because our interest is in broad qualitative trends. the intragenic scale genetic maps based on pedigree data are
not very precise, we estimate recombination rates directly from the patterns in the sequence data. We assume a constant rate
of crossing over per base pair and no gene conversion. The RESULTS
estimator CHRMsummarizes the data using the estimated
mini-mum number of recombination events (RM; cf.Hudsonand Table 1 summarizes some general information about
Kaplan1985) and the observed number of distinct haplotypes
the loci considered. Levels of heterozygosity at the loci (H ) and returns the value of C that maximizes the likelihood
studied here are comparable with those reported from lik(C|H, RM) (seeWall2000 for more details). It is roughly
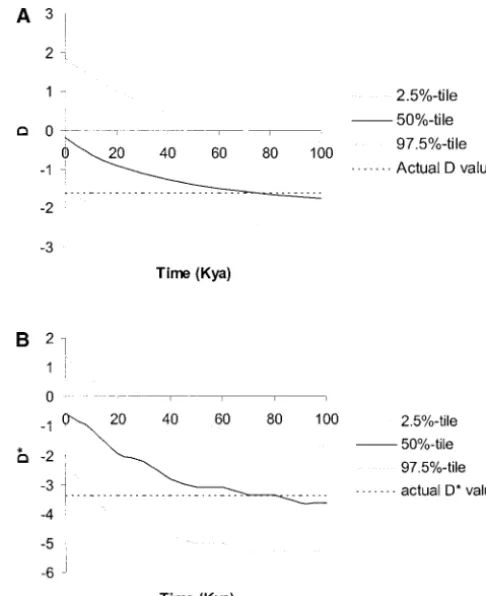
previous studies (e.g., Li and Sadler 1991). There is unbiased under a constant population size model, has
rela-tively low mean squared error, and can be calculated for large no clear trend in the frequency spectra: 7 out of 12 loci polymorphism data sets (Wall2000;J. D. Wall,unpublished have positive D values, while 4 out of 11 loci have positive results). We incorporate population growth (see below)
di-D* values. When the D values of the largest data sets rectly into the null simulations used to estimate C. CHRMcould
are compared with each other (cf.Hey1997), it is found not be calculated for Dys44, since haplotype data were not
that Xq13.3’s value differs significantly from those of available for that locus, or for Duffy and Dmd7, because the
sequence studied was not contiguous. We assume C⫽0 for Dys44, Pdha1, and-globin (results not shown). all simulations involving these three loci. To illustrate the effect of recent exponential growth
We model either a constant population size or a constant on the distribution of D and D*, we choose the largest population size followed by exponential growth (cf.Marjoram
locus with positive D and D* values (Lpl ) and the largest andDonnelly1994). For the latter, an equilibrium
popula-locus with negative D and D* values (Xq13.3). For these tion of size N⫽104starts at time T to grow at a constant rate
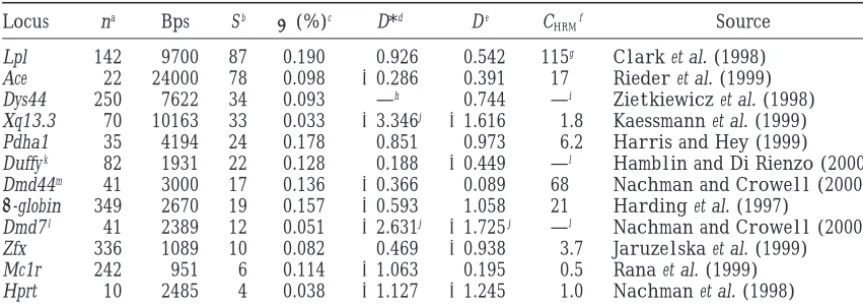
to a current population size of 105or 106. T, the date of the two loci, we run simulations where the population size onset of growth varies from 0 kya to 100 kya, assuming an is constant at N⫽ 104, then at time T starts growing average generation time of 20 yr. exponentially until it reaches N⫽ 106 at the present.
The recombination rate for each locus is estimated from
Figures 1 and 2 show the middle 95% of simulated D exponential growth simulations for the whole sample. We run
and D* values, as a function of T. Figure 1, A and B, simulations to estimate CHRMfor values of T that are multiples
of 5 kya and then use linear interpolation to estimate CHRM shows simulations of D and D*, respectively, for Lpl for other values of T. For Lpl and certain values of T, CHRM (assuming C⫽ 0), while Figure 2, A and B, illustrates could not be calculated because the estimated likelihood of D and D* for Xq13.3 (with C⫽0). The actual values of the data was 0. This might be because incomplete phase
infor-D and infor-D* are highlighted for comparison. As T in-mation was available, leading to an underestimate of the
num-creases, the expected values of D and D* decrease. Note ber of distinct haplotypes. When this happens, we estimate C
solely from the observed RM[i.e., we take the value of C that that the expected value of D* decreases more rapidly maximizes lik (C |RM)]. All simulations use the same growth than that of D; this suggests that D* is more effective for rates (for a given value of T ), except for a simple correction for detecting recent increases in population size. Further X-linked loci (which have 3/4 the population size of autosomal
simulations confirm this (results not shown). For T≈ loci under the standard neutral model). We consider
world-50–100 kya, as suggested byRogers andHarpending
wide samples as well as exclusively African and non-African
samples. Most simulations were run using modifications of (1992),Sherryet al. (1994), and others, the observed programs kindly provided by R. R. Hudson. values of D and D* for Lpl fall outside the 95% confi-In addition to simulations of a constant population size dence interval of simulated values; when realistic recom-followed by exponential growth, for Lpl we run simulations
bination rates are assumed, the discrepancy between of a symmetric island model of geographic subdivision. The
actual and simulated values is much greater (see below). model has four islands (meant to correspond loosely to
Afri-can, European, Asian, and Melanesian populations), and mi- The values for Xq13.3 are inside the 95% confidence gration rates are taken to correspond roughly to an FSTof 0.15 interval for any T (Figure 2A) or any T⬎10 kya (Figure (cf.Takahata1983; 4Nm⫽3.188, when N⫽104). Actual FST
2B) in the interval shown. However, if TⰇ100 kya, as values between continental populations are often less than
in models discussed byHawkset al. (2000), even the D this value (Cavalli-Sforzaet al. 1994), but we have opted to
and D* values for Xq13.3 are significantly too high (e.g., be conservative by maximizing the effect population structure
has on the distributions of D and D*. Each individual in the for T⫽2 mya and 600-fold growth, P⬍0.01 for both). sample is assigned to one of the four islands on the basis of We quantify the effect of T on D and D* for other their ethnicity. The numbers of sampled individuals from each loci by determining for which values of T the actual island are 48 (Africa), 94 (Europe), 0 (Asia), and 0
(Mel-values of D and D* lie within the middle 95% of simu-anesia). T is the same for all demes in simulations that include
lated D values. Unlike above, these simulations use a exponential growth.
TABLE 1
Polymorphism data for human data sets
Locus na Bps Sb (%)c D*d De C
HRMf Source
Lpl 142 9700 87 0.190 0.926 0.542 115g Clarket al. (1998)
Ace 22 24000 78 0.098 ⫺0.286 0.391 17 Riederet al. (1999)
Dys44 250 7622 34 0.093 —h 0.744 —i Zietkiewiczet al. (1998)
Xq13.3 70 10163 33 0.033 ⫺3.346j ⫺1.616 1.8 Kaessmannet al. (1999)
Pdha1 35 4194 24 0.178 0.851 0.973 6.2 HarrisandHey(1999)
Duffyk 82 1931 22 0.128 0.188 ⫺0.449 —l HamblinandDi Rienzo(2000)
Dmd44m 41 3000 17 0.136 ⫺0.366 0.089 68 NachmanandCrowell(2000)
-globin 349 2670 19 0.157 ⫺0.593 1.058 21 Hardinget al. (1997)
Dmd7l 41 2389 12 0.051 ⫺2.631j ⫺1.725j —l NachmanandCrowell(2000)
Zfx 336 1089 10 0.082 0.469 ⫺0.938 3.7 Jaruzelskaet al. (1999)
Mc1r 242 951 6 0.114 ⫺1.063 0.195 0.5 Ranaet al. (1999)
Hprt 10 2485 4 0.038 ⫺1.127 ⫺1.245 1.0 Nachmanet al. (1998)
aSample size.
bNumber of segregating sites.
cAverage number of pairwise differences per base pair, in percentage (cf.Tajima1983). dFromTajima(1989a).
eFromFuandLi(1993).
fSequence-based estimate of the rate of recombination per locus.
gThese values are probably underestimates since available phase information was incomplete. hCould not be calculated because the data from the original ascertainment sample are unavailable. iCould not be calculated because haplotype information is unavailable.
jP⬍0.05 (two tailed). Coalescent simulations with no recombination were used to assess significance levels. kIncludes both Duffy and the noncontiguous 5⬘region sequenced.
lSequence not contiguous.
mThis region is in the same intron as Dys44.
materials and methods). This is shown in Table 2, vs. non-African populations, other systematic
differ-ences seem more difficult to identify. The D values for for an ancestral population size of N⫽104and current
population sizes of N ⫽ 105 or N ⫽ 106. For 10-fold non-African samples are generally higher than the cor-responding D values for African samples (true for 6 out growth in population size, four loci are inconsistent with
exponential growth starting 50 kya. For 100-fold growth, of 8 loci), but perhaps more interesting is that four of the non-African samples (but none of the African six are inconsistent with T⫽50 kya and nine with T⫽
100 kya. In contrast, two loci are inconsistent with T⫽ samples) have significantly high D values even when there is no growth (i.e., T⫽0). The P values for these 0. (Note that we are not correcting for the use of two
test statistics. If we do, the qualitative conclusions are four data sets become vanishingly small under long-term exponential growth (i.e., T⫽50 kya). In contrast, unchanged.)
One of the main conclusions to emerge from studies there seems to be no systematic difference in D* values between African and non-African populations, and one of human variation is a greater variability in Africa (e.g.,
Cannet al. 1987;Bowcocket al. 1994;Halushkaet al. African and one non-African sample show the opposite pattern of significantly negative D values when T ⫽ 0. 1999). To determine whether there is a geographical
component to the patterns observed, we partition our Overall, five out of eight non-African and two out of eight African samples are inconsistent with a model of data sets into African and non-African samples. The
sampling scheme for non-Africans varies greatly, from 100-fold growth starting 50 kya.
A model of constant population size followed by expo-34 chromosomes from one population (Duffy) to one
or few individuals from dozens of populations (Xq13.3). nential growth is probably too simplistic. With the inclusion of additional features, such as a population All non-African samples include some Europeans;
Dys44, Xq13.3, Dmd44,-globin, and Dmd7 include Asian bottleneck or population subdivision, more data are compatible with an older onset of growth. We highlight populations as well. For each, we run the same
exponen-tial growth simulations as before. Table 3 summarizes this by examining how alternative demographic assump-tions affect the distribution of D and D* values for the the data sets and shows the results of these simulations
for the eight loci that provided geographic information total Lpl data set. Figure 3 shows the middle 95% of simulated D and D* values for a model of a population and satisfied minimal size requirements (n ⱖ 10 and
Figure 2.—D and D* vs. T, the time since the onset of
Figure 1.—D and D* vs. T, the time since the onset of
exponential growth, for Xq13.3. The population size is con-exponential growth, for Lpl. The population size is constant
stant at N⫽104before T, then grows exponentially to a current at N⫽104before T, then grows exponentially to a current
size of N⫽106. A generation time of 20 yr is assumed. A total size of N⫽106. A generation time of 20 yr is assumed. A total
of 105simulations are run for T⫽0–100 kya (increment 10 of 105simulations are run for T⫽0–100 kya (increment 10
kyr). A shows simulations for Tajima’s D (C ⫽ 0), while B kyr). A shows simulations for Tajima’s D (C ⫽ 0), while B
shows simulations for Fu and Li’s D* (with C⫽0). The simu-shows simulations for Fu and Li’s D* (with C⫽0). The
simu-lated 2.5% tile, 50% tile, and 97.5% tile are plotted, as well lated 2.5% tile, 50% tile, and 97.5% tile are plotted, as well
as the actual values of D and D*. as the actual values of D and D*.
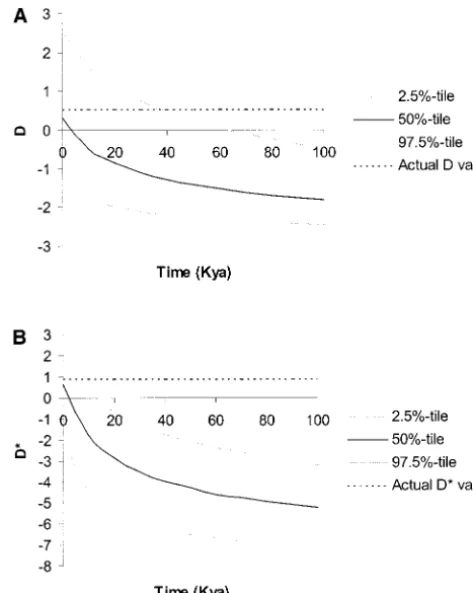
D* (Figure 4B) values for Lpl. As implemented,
geo-materials and methods). Figure 3A shows simulated
graphic subdivision has a relatively minor effect, despite Tajima’s D values, while Figure 3B shows simulated Fu
the low migration rate used (seematerials and
meth-and Li’s D* values. The actual values are highlighted
ods); the range of compatibility increases from 0–25 for comparison. The specific parameters used were
cho-kya in Figure 1A to 0–37 cho-kya in Figure 4A and from 0–3 sen to maximize the chance that the observed D and
kya in Figure 1B to 0–6 kya in Figure 4B. If an equilib-D* would be compatible with long-term exponential
rium island model with unequal island sizes is used (cf. growth. As can be seen by comparing Figure 1 with
RelethfordandHarpending1995;Relethfordand
Figure 3, the Lpl data set is now compatible with an
Jorde1999), the effect on D and D* is almost the same
older onset of growth (roughly 46 kya instead of 25 kya
(results not shown). for D and 7 kya instead of 3 kya for D*). If recent
population growth is assumed, then the effect of a bot-tleneck before the start of growth decreases as the
sam-DISCUSSION ple size increases (results not shown). Anatomically
modern humans are thought to have reached Australia Nuclear sequence data conflict with other genetic loci: In this article we examined the frequency spectrum of roughly 50–60 kya (Robertset al. 1994). If T⬎50 kya,
stronger bottlenecks will result in lower values of D and segregating mutations at nuclear loci in humans. mtDNA and Y chromosome data show a substantial ex-D* (results not shown).
The presence of population structure often leads to cess of rare mutations (i.e., D and D* are strongly nega-tive) over equilibrium neutral expectations (Cannet al. higher expected D and D* values. To test the magnitude
of this effect, we consider an island model of geographic 1987; Di Rienzo andWilson 1991; Underhill et al. 1997). Researchers have argued that the sharply nega-subdivision (see materials and methods). Figure 4
TABLE 2
Range ofTvalues consistent with the observed Tajima’sDvalues
Da D*b
Data set 10-fold growthc 100-fold growth 10-fold 100-fold
Lpl 0–4 0–3 0–2 0–1
Ace 0–100⫹ 0–97 0–100⫹ 0–66
Dys44d 0–20 0–11 —e —e
Xq13.3 3–100⫹ 2–100⫹ 14–100⫹ 9–100⫹
Pdha1 0–40 0–23 0–29 0–18
Duffy 0–100⫹ 0–100⫹ 0–100⫹ 0–32
Dmd44 0–100⫹ 0–70 0–100⫹ 0–92
-globin 0–5 0–3 0–100⫹ 0–14
Dmd7 4–100⫹ 3–100⫹ 2–100⫹ 1–100⫹
Zfx 0–100⫹ 0–100⫹ 0–100⫹ 0–11
Mc1r 0–100⫹ 0–100⫹ 0–100⫹ 0–80
Hprt 0–100⫹ 0–100⫹ 0–100⫹ 0–100⫹
Range of times since the onset of exponential growth are in kya. aFromTajima(1989a).
bFromFuandLi(1993).
cRange of T values for which the observed D falls within the middle 95% of simulated D values. Simulations use a value of C estimated from the data (seematerials and methods).
dWe take C⫽0 since haplotype data are unavailable.
eD* could not be calculated because data from the original ascertainment sample are unavailable.
TABLE 3
Comparison of Africanvs.non-African samples
D D*
Locus na Sb (%)c Dd D*e 10-foldf 100-fold 10-foldf 100-fold
Lpl Afr. 48 77 0.198 0.370 1.359 0–18 0–11 Noneg Noneg
Lpl non-Afr. 94 60 0.173 1.405 1.288 Noneg Noneg Noneh Noneh
Ace Afr. 10 70 0.108 0.228 ⫺0.090 0–100⫹ 0–100⫹ 0–100⫹ 0–100⫹
Ace non-Afr. 12 44 0.080 1.466 0.912 Noneg Noneg 0–24 0–19
Dys44 Afr. 115 32 0.099 0.776 —i 0–33 0–19 —i —i
Dys44 non-Afr. 135 21 0.085 1.950 —i Noneh Noneh —i —i
Xq13.3 Afr. 23 24 0.035 ⫺1.703 ⫺1.975 7–100⫹ 6–100⫹ 0–100⫹ 0–100⫹
Xq13.3 non-Afr. 47 17 0.031 ⫺0.556 ⫺1.674 0–100⫹ 0–100⫹ 0–100⫹ 0–100⫹
Duffy Afr. 48 9 0.052 ⫺0.695 ⫺0.607 0–100⫹ 0–100⫹ 0–100⫹ 0–100⫹
Duffy non-Afr. 34 15 0.158 0.849 1.141 0–100⫹ 0–70 0–39 0–25
Dmd44 Afr. 10 12 0.159 0.571 0.540 0–100⫹ 0–92 0–100⫹ 0–100⫹
Dmd44 non-Afr. 31 14 0.125 0.237 0.261 0–100⫹ 0–72 0–100⫹ 0–64
-globin Afr. 103 16 0.098 ⫺0.423 ⫺0.468 0–100⫹ 0–100⫹ 0–100⫹ 0–54 -globin non-Afr. 246 14 0.165 2.251 0.204 Noneg Noneg 0–100⫹ 0–15
Dmd7 Afr. 10 9 0.133 ⫺0.005 ⫺0.595 0–100⫹ 0–100⫹ 0–100⫹ 0–100⫹
Dmd7 non-Afr. 31 4 0.011 ⫺1.889 ⫺3.022 14–100⫹ 10–100⫹ 14–100⫹ 10–100⫹
aSample size.
bNumber of segregating sites.
cAverage number of pairwise differences per base pair, in percentage (cf.Tajima1983). dFromTajima(1989a).
eFromFuandLi(1993).
fRange of T values for which the observed D falls within the middle 95% of simulated D values. Simulations use a value of C estimated from the data (seematerials and methods).
gWhen T⫽0 (no growth), the observed D has two-tailed P⬍0.01. hWhen T⫽0 (no growth), the observed D has two-tailed P⬍0.05.
Figure 4.—D and D* vs. T, the time since the onset of
Figure3.—D and D* vs. T, the time since the end of the exponential growth, for Lpl with a symmetric island model. bottleneck and the onset of exponential growth, for Lpl. A The population size is constant at N⫽ 104 before T, then population size of N⫽104is reduced 10-fold for 10,000 years,
grows exponentially to a current size of N⫽106. A generation ending at time T. Then the population size increases exponen- time of 20 yr is assumed. A total of 105simulations are run tially to a current size of N⫽106. A generation time of 20 yr
for T⫽ 0–100 kya (increment 10 kyr). A shows simulations is assumed. A total of 105simulations are run for T⫽0–100
for Tajima’s D (C⫽0), while B shows simulations for Fu and kya (increment 10 kyr). A shows simulations for Tajima’s D Li’s D* (with C⫽0).
(C⫽0), while B shows simulations for Fu and Li’s D* (with C⫽0). We plot the actual values of D and D* as well as the simulated 2.5% tile, 50% tile, and 97.5% tile.
not support the long-term population growth model first suggested by mtDNA data. The discordance be-tween the data and a long-term growth model is even occurredⵑ50–100 kya (e.g.,RogersandHarpending
1992;Sherryet al. 1994;Rogers1995). If so, we would larger when previously proposed parameter values (i.e., growth rates and time since the start of growth) are expect to observe the effects of this expansion
through-out the genome (Hey1997). However, the nuclear data used (e.g., Rogers and Harpending1992; Kruglyak
1999). are not consistent with this scenario, even though our
most extreme model of growth (100-fold growth over Estimating the rate of recombination: One criticism of our conclusions is that significance levels are not the past 100 kyr) is still less extreme than has been
commonly proposed (e.g., Weiss 1984; Rogers and necessarily conservative when recombination rates are estimated from the data. However, there is no reason
Harpending 1992). While expansion should lead to
predominantly negative D and D* values, Tables 1 and to expect that CHRM consistently overestimates the true recombination rate, and our null simulations explicitly 3 show a roughly equal number of positive and negative
values. Since D and D* measure different (but related) incorporate the model of population growth that is tested. Constant-size coalescent simulations with fixed aspects of the data, we expect the ranges of compatible
T values for D and D* to be correlated but not identical values of C suggest that the median of the distribution of CHRMvalues is usually less than or equal to the actual in Tables 2 and 3. This is what we observe: For some
loci, the D and D* values are large enough such that they value of C (results not shown). In addition, some aspects of the data at many loci (in particular, the nonzero and are inconsistent with a model of exponential growth
starting⬎50 kya. This is the case for 6 out of 12 loci in sometimes large values of RM) are not consistent with low recombination rates (results not shown). We know Table 2, two out of eight African samples, and five out
might be problematic. In particular, it might not be the non-African sample;HamblinandDi Rienzo2000). Any model of human history should also include claims appropriate for researchers with nuclear sequence data
to assume that C ⫽ 0 and reconstruct a tree, since a of how and where natural selection has affected ob-served genetic variation. Below we examine two main post hoc pruning of the data (i.e, removing sites and
individuals that show evidence of recombination) might hypotheses for which loci and what types of selection have been operating.
bias the results. More important, even if we make the
unrealistic assumption that C⫽0, the qualitative results One possibility is that there has indeed been long-term population growth (e.g., T⬎50 kya). In this case, are the same: all of the loci in Tables 2 and 3 that are
inconsistent with 100-fold growth and T ⫽ 50 kya are the excess of rare variants in mtDNA, the Y chromo-some, Xq13.3, and Dmd7 reflects demography while the still inconsistent if we assume no recombination (results
not shown). high D and D* values at Lpl, Dys44, Pdha1, and-globin
reflect the action of balancing or diversifying selection.
Possible explanations:Even though nuclear sequence
data do not support a simple model of recent population The intermediate D and D* values at other loci such as Ace or Dmd44 could then be due to chance or to growth, we nonetheless know that a drastic population
expansion occurred at least 12 kya with the advent and demographic factors such as population structure or a bottleneck. (But note that these factors are still insuffi-spread of agriculture. Furthermore, archaeological
evi-dence suggests that human population sizes have ex- cient to account for the extremely high D values at some loci.) Although a simple model of balancing selection panded over the last 40–50 kyr or more (Klein1989).
So why the discrepancy between expectations and obser- (e.g.,HudsonandKaplan1988) leads to higher D and D* values (Fu1996), it also predicts a well-defined peak vations? Three nonexclusive possibilities are that our
mutational model is incorrect, that our demographic of polymorphism surrounding the selected site. There is neither a putative selected site nor an observable model is incorrect, or that the patterns of variation at
some of the loci have been affected (either directly or peak of polymorphism at Lpl, Dys44, Pdha1, or-globin. Theory predicts that it takes a substantial amount of indirectly) by natural selection.
All of our simulations have assumed an infinite-sites time for balancing selection to affect levels of phism or Tajima’s D values, so young balanced polymor-model, and some researchers have recently suggested
that multiple mutations at the same site might be fre- phisms (e.g., malaria resistance at-globin) should have little effect on levels of polymorphism. Note also that quent for human polymorphism data (Templeton et
al. 2000). However, this is likely to be a minor concern. there are few if any examples of balanced polymor-phisms in any species aside from MHC loci in mammals For example, for Lpl (the data set with the most
segregat-ing sites), the expected number of multiple hits at CpG and S-allele systems in plants. Even the canonical case of Adh in Drosophila melanogaster may not be a simple sites is less than two (taking the CpG mutation rate
estimated for Lpl inTempletonet al. 2000). The effect balanced polymorphism (Begun et al. 1999). Thus, it seems unlikely that balancing selection has led to higher that two multiple hits would have on D and D* is
negligi-ble (results not shown). The expected number of multi- D and D* values in multiple unlinked human nuclear loci. Other selective models, such as local adaptation, ple hits in smaller data sets is less than what it is for Lpl
(results not shown). might produce higher D and D* values; however, they
have not been well characterized theoretically. Although our simplistic demographic model is likely
to be incorrect, the relevant question is whether actual An alternative hypothesis is that the positive (and slightly negative ) D and D* values reflect demography, human demography differs from our assumptions in
ways that would lead to systematically higher D and while the significantly negative D and D* values for mtDNA, the Y chromosome, Xq13.3, and Dmd7 reflect D* values. We tested two possible alternative models in
Figure 3 (population bottleneck) and Figure 4 (popula- the recent effects of directional selection. It is an inter-esting coincidence that three out of four of these are tion structure). Although both models tend to produce
higher D and D* values (and thus greater concordance in areas of little or no recombination. The fourth locus, Dmd7, shows only an excess of rare variants outside of between our data and a model of recent population
growth), neither is a sufficient explanation for all of the Africa, so it cannot be taken as support for the simplest model of growth.Kaessmannet al. (1999) deliberately loci examined. Some loci (e.g., -globin) still have D
values that are too high. More generally, the low D and chose their region (Xq13.3) to be in an area of reduced recombination because data is easier to analyze when D* values at some loci (e.g., Xq13.3 and Dmd7) and the
high values at other loci (e.g., Lpl and-globin) are not recombination can be ignored. They suggest that loci like Xq13.3 are “ideally suited for unravelling the evolu-both consistent with any simple model of human
demog-raphy (see alsoHey1997). So it seems likely that selec- tionary history of the nuclear genome” (Kaessmannet al. 1999, p. 79). However, one consequence of their tion has influenced the patterns of variation at several
of the loci studied. One locus in particular (Duffy) is choice of location is that the patterns of variation at Xq13.3 (as with mtDNA and the nonrecombining region known to be influenced by natural selection (which may
Drosophila melanogaster an ancient balanced polymorphism? Mol.
effects of selection at linked loci. Positive selection at a
Biol. Evol. 16: 1816–1819.
linked locus (SmithandHaigh1974), possibly outside Bowcock, A. M., A. Ruiz-Linares, J. Tomfohrde, E. Minch, J. R. Kiddet al., 1994 High resolution of human evolutionary trees
the region examined, would lead to a reduction in
heter-with polymorphic microsatellites. Nature 368: 455–457.
ozygosity and a shift toward negative D values at Xq13.3
Braverman, J. M., R. R. Hudson, N. L. Kaplan, C. H. Langleyand
(Bravermanet al. 1995). There are many nearby candi- W. Stephan,1995 The hitchhiking effect on the site frequency
spectrum of DNA polymorphisms. Genetics 140: 783–796.
dates for selection. A Grail search (http://compbio.ornl.
Cann, R. L., M. StonekingandA. C. Wilson,1987 Mitochondrial
gov) revealed a putative gene (a purinergic receptor)
DNA and human evolution. Nature 325: 31–36.
⬍5 kb away (0.0007 cM) from the region sequenced by Cargill, M., D. Altshuler, J. Ireland, P. Sklar, K. Ardlieet al.,
1999 Characterization of single-nucleotide polymorphisms in
Kaessmann and colleagues. Given the available data and
coding regions of human genes. Nat. Genet. 22: 231–238.
the greater prevalence of directional selection
com-Cavalli-Sforza, L. L., P. MenozziandA. Piazza,1994 The History
pared with balancing selection in Drosophila (Hey and Geography of Human Genes. Princeton University Press,
Princeton, NJ.
1999), this hypothesis seems more plausible.
Clark, A. G., K. M. Weiss, D. A. Nickerson, S. L. Taylor, A.
Implications for models of human evolution: The
Buchananet al., 1998 Haplotype structure and population
ge-single origin model implicitly assumes that modern hu- netic inferences from nucleotide-sequence variation in human lipoprotein lipase. Am. J. Hum. Genet. 63: 595–612.
man populations expanded as they replaced more
ar-Di Rienzo, A.,andA. C. Wilson, 1991 Branching pattern in the
chaic hominids throughout the Old World (Harpend- evolutionary tree for human mitochondrial DNA. Proc. Natl. inget al. 1998). This expansion presumably happened Acad. Sci. USA 88: 1597–1601.
Di Rienzo, A., P. Donnelly, C. Toomajian, B. Sisk, A. Hillet al.,
before the colonization of Australia 50–60 kya (Roberts
1998 Heterogeneity of microsatellite mutations within and
be-et al. 1994). The challenge for proponents of the single tween loci, and implications for human demographic histories. origin model is to formulate a model that includes long- Genetics 148: 1269–1284.
Fay, J. C.,andC.-I. Wu,1999 A human population bottleneck can
term population growth and that can explain why
ob-account for the discordance between patterns of mitochondrial
served FST values are low and why there is no trend versus nuclear DNA variation. Mol. Biol. Evol. 16: 1003–1005. toward negative D and D* values in nuclear loci. Any Fu, Y.-X.,1996 New statistical tests of neutrality for DNA samples
from a population. Genetics 143: 557–570.
claim about the action of selection at certain loci should
Fu, Y.-X.,andW. H. Li,1993 Statistical test of neutrality of mutations.
be made explicit, considering the discussion of balanc- Genetics 133: 693–709.
ing selection above. As mentioned before, our results Gonser, R., P. Donnelly, G. NicholsonandA. Di Rienzo,2000 Microsatellite mutations and inferences about human
demogra-on the timing of recent populatidemogra-on expansidemogra-ons do not
phy. Genetics 154: 1793–1807.
directly impact the feasibility of the multiregional Halushka, M. K., J. B. Fan, K. Bentley, L. Hsie, N. Shenet al., 1999 model. However, it is still unclear whether an ancestral Patterns of single-nucleotide polymorphisms in candidate genes
for blood-pressure homeostasis. Nat. Genet. 22: 239–247.
effective population size of 104is consistent with a
con-Hamblin, M. T.,andA. Di Rienzo,2000 Detection of the signature
tinuous occupation of most of the Old World (see, e.g., of natural selection in humans: evidence from the Duffy blood
group locus. Am. J. Hum. Genet. 66: 1669–1679.
Harpendinget al. 1998). Perhaps a less polemic goal
Hammer, M. F., A. B. Spurdle, T. Karafet, M. R. Bonner, E. T. would be to construct a model that can account for the
Wood et al., 1997 The geographic distribution of human Y
differences between African and non-African samples. chromosome variation. Genetics 145: 787–805.
Harding, R. M., S. M. Fullerton, R. C. Griffiths, J. Bond, M. J. Cox Such a model would need to explain why diversity levels
et al., 1997 Archaic African and Asian lineages in the genetic
within Africa are consistently higher than outside of
ancestry of modern humans. Am. J. Hum. Genet. 60: 772–789.
Africa, and why the D values for non-African samples at Harpending, H. C., M. A. Batzer, M. Gurven, L. B. Jorde, A. R. Rogerset al., 1998 Genetic traces of ancient demography. Proc.
some loci are significantly positive. Further work focuses
Natl. Acad. Sci. USA 95: 1961–1967.
on whether nonequilibrium demographic models are
Harris, E. E.,andJ. Hey,1999 X chromosome evidence for ancient
more consistent with human nuclear sequence data. human histories. Proc. Natl. Acad. Sci. USA 96: 3320–3324.
Hawks, J., K. Hunley, S.-H. LeeandM. Wolpoff,2000 Population B. Payseur, C. Sing, and E. Zietkiewicz generously provided
unpub-bottlenecks and pleistocene human evolution. Mol. Biol. Evol. lished data, and A. Di Rienzo, M. Hamblin, R. Harding, M. Nachman, 17:2–22.
and J. Pritchard provided preprints of their work. Also, we thank P. Hey, J.,1997 Mitochondrial and nuclear genes present conflicting Andolfatto, A. Di Rienzo, R. Hudson, M. Nordborg, N. Takahata, and portraits of human origins. Mol. Biol. Evol. 14: 166–172. two anonymous reviewers for helpful discussions and comments on Hey, J.,1999 The neutralist, the fly and the selectionist. TREE 14:
35–38. earlier versions of this work. Part of this paper was completed when
Hey, J.,andE. Harris,1999 Population bottlenecks and patterns J.D.W. was at the Graduate University for Advanced Studies (Hayama,
of human polymorphism. Mol. Biol. Evol. 16: 1423–1426. Japan), supported by the Monbusho Summer Program in Japan.
Hudson, R. R.,1993 The how and why of generating gene genealo-J.D.W. was partially supported by National Institutes of Health grant
gies, pp. 23–36 in Mechanisms of Molecular Evolution, edited byN.
5R01H610847. TakahataandA. G. Clark.Sinauer, Sunderland, MA.
Hudson, R. R.,andN. L. Kaplan,1985 Statistical properties of the number of recombination events in the history of a sample of DNA sequences. Genetics 111: 147–164.
Hudson, R. R.,andN. L. Kaplan,1988 The coalescent process in
LITERATURE CITED
models with selection and recombination. Genetics 120: 831–840.
Awadalla, P., A. Eyre-Walkerand J. M. Smith,1999 Linkage Jaruzelska, J., E. Zietkiewicz, M. Batzer, D. E. C. Cole, J. P.
disequilibrium and recombination in hominid mitochondrial Moisonet al., 1999 Spatial and temporal distribution of the DNA. Science 286: 2524–2525. neutral polymorphisms in the last ZFX intron: analysis of the
Begun, D. J., A. J. Betancourt, C. H. LangleyandW. Stephan, haplotype structure and genealogy. Genetics 152: 1091–1101.
Jin, L., P. A. Underhill, V. Doctor, R. W. Davis, P. Shenet al.
1999 Distribution of haplotypes from a chromosome 21 region et al., 1994 The human colonisation of Australia: optical dates of 53,000 and 60,000 years bracket human arrival at Deaf Adder distinguishes multiple prehistoric human migrations. Proc. Natl.
Acad. Sci. USA 96: 3796–3800. Gorge, Northern Territory. Q. Sci. Rev. 13: 575–583.
Rogers, A. R.,1995 Genetic evidence for a Pleistocene population
Jorde, L. B., W. S. Watkins, M. J. Bamshad, M. E. Dixon, C. E.
Rickeret al., 2000 The distribution of human genetic diversity: explosion. Evolution 49: 608–615.
Rogers, A. R.,andH. Harpending,1992 Population growth makes a comparison of mitochondrial, autosomal and Y-chromosome
data. Am. J. Hum. Genet. 66: 979–988. waves in the distribution of pairwise genetic differences. Mol. Biol. Evol. 9: 552–569.
Kaessmann, H., F. Heißig, A. von HaeselerandS. Pa¨a¨bo,1999
DNA sequence variation in a non-coding region of low recombi- Sherry, S. T., A. R. Rogers, H. Harpending, H. Soodyall, T. Jen-kinset al., 1994 Mismatch distributions of mtDNA reveal recent nation on the human X chromosome. Nat. Genet. 22: 78–81.
Kimmel, M., R. Chakraborty, J. P. King, M. Bamshad, W. S. Watkins human population expansions. Hum. Biol. 66: 761–775.
Slatkin, M.,andR. R. Hudson,1991 Pairwise comparisons of
mito-et al., 1998 Signatures of population expansion in microsatellite
repeat data. Genetics 148: 1921–1930. chondrial DNA sequences in stable and exponentially growing populations. Genetics 129: 555–562.
Klein, R. G.,1989 The Human Career. University of Chicago Press,
Chicago. Smith, J. M.,andJ. Haigh,1974 The hitch-hiking effect of a favor-able gene. Genet. Res. Camb. 23: 23–35.
Kruglyak, L.,1999 Prospects for whole-genome linkage
disequilib-rium mapping of common disease genes. Nat. Genet. 22: 139–144. Stiner, M. C., N. D. Munro, T. A. Surovell, E. TchernovandO. Bar-Yosef, 1999 Paleolithic population growth pulses
evi-Li, W.-H.,andL. A. Sadler,1991 Low nucleotide diversity in man.
Genetics 129: 513–523. denced by small animal exploitation. Science 283: 190–194.
Stringer, C. B.,andP. Andrews,1988 Genetic and fossil evidence
Marjoram, P., and P. Donnelly, 1994 Pairwise comparisons of
mitochondrial DNA sequences in subdivided populations and for the origin of modern humans. Science 239: 1263–1268.
Tajima, F.,1983 Evolutionary relationships of DNA sequences in implications for early human evolution. Genetics 136: 673–683.
finite populations. Genetics 105: 437–460.
Nachman, M. W.,andS. L. Crowell,2000 Contrasting evolutionary
Tajima, F.,1989a Statistical method for testing the neutral mutation histories of two introns of the Duchenne muscular dystrophy
hypothesis by DNA polymorphism. Genetics 123: 585–595. gene, Dmd, in humans. Genetics 155(4) (in press).
Tajima, F.,1989b The effect of change in population size on DNA
Nachman, M. W., W. M. Brown, M. StonekingandC. F. Aquadro,
polymorphism. Genetics 123: 597–601. 1996 Nonneutral mitochondrial DNA variation in humans and
Takahata, N.,1983 Gene identity and genetic differentiation of chimpanzees. Genetics 142: 953–963.
populations in the finite island model. Genetics 104: 497–512.
Nachman, M. W., V. L. Bauer, S. L. CrowellandC. F. Aquadro,
Templeton, A. R., A. G. Clark, K. M. Weiss, D. A. Nickerson,
1998 DNA variability and recombination rates at X-linked loci
E. Boerwinkle et al., 2000 Recombinational and mutational in humans. Genetics 150: 1133–1141.
hotspots within the human Lipoprotein Lipase gene. Am. J. Hum.
Peterson, R. J., D. Goldman and J. C. Long,1999 Nucleotide
Genet. 66: 69–83. sequence diversity in non-coding regions of ALDH2 as revealed by
Underhill, P. A., J. Li, A. A. Lin, S. Qasim Mehdi, T. Jenkinset al.,
restriction enzyme and SSCP analysis. Hum. Genet. 104: 177–187.
1997 Delection of numerous Y chromosome biallelic
polymor-Pritchard, J. K., M. T. Seielstad, A. Perez-Lezaun and M. W.
phisms by denaturing high-performance liquid chromotography.
Feldman,1999 Population growth of human Y chromosomes:
Genome Res. 7: 996–1005. a study of Y chromosome microsatellites. Mol. Biol. Evol. 16:
Wall, J. D.,1999 Recombination and the power of statistical tests 1791–1798.
of neutrality. Genet. Res. Camb. 74: 65–79.
Przeworski, M., R. R. HudsonandA. Di Rienzo,2000 Adjusting
Wall, J. D.,2000 A comparison of estimators of the population the focus on human variation. Trends Genet. (in press).
recombination rate. Mol. Biol. Evol. 17: 156–163.
Rana, B. K., D. Hewett-Emmett, L. Jin, B. H. J. Chang, N.
Sambu-Weiss, K. M.,1984 On the number of members of the genus Homo
ughinet al., 1999 High polymorphism at the human
Melanocor-who have ever lived, and some implications. Hum. Biol. 56: 637– tin 1 receptor locus. Genetics 151: 1547–1557.
649.
Reich, D. E.,andD. B. Goldstein,1998 Genetic evidence for a Wise, C. A., M. SramlandS. Easteal,1998 Departure from neutral-Paleolithic human population expansion in Africa. Proc. Natl. ity at the mitochondrial NADH dehydrogenase subunit 2 gene Acad. Sci. USA 95: 8119–8123. in humans, but not in chimpanzees. Genetics 148: 409–421.
Relethford, J. H., andH. C. Harpending,1995 Ancient differ- Wolpoff, M. H., X. Wu andA. G. Thorne,1984 Modern Homo ences in population size can mimic a recent African origin of sapiens origins: a general theory of hominid evolution involving modern humans. Curr. Anthro. 36: 667–674. the fossil evidence from East Asia, pp. 411–483 in The Origins of
Relethford, J. H.,and L. B. Jorde,1999 Genetic evidence for Modern Humans: A World Survey of the Fossil Evidence. Liss, New larger African population size during recent human evolution. York.
Am. J. Phys. Anthropol. 108: 251–260. Zietkiewicz, E., V. Yotova, M. Jarnik, M. Korab-Laskowska, K. K.
Rieder, M. J., S. L. Taylor, A. G. ClarkandD. A. Nickerson,1999 Kiddet al., 1998 Genetic structure of the ancestral population Sequence variation in the human angiotensin converting enzyme. of modern humans. J. Mol. Evol. 47: 146–155.
Nat. Genet. 22: 59–62.