Realized Sampling Variances of Estimates of Genetic Parameters and the
Difference Between Genetic and Phenotypic Correlations
Kenneth R. Koots
and
JohnP. Gibson
Centre f o r Genetic Improvement of Livestock, University of Guelph, Guelph, Ontario NI G 2W1, Canada
Manuscript received August 22, 1995 Accepted for publication March 25, 1996
ABSTRACT
A data set of 1572 heritability estimates and 1015 pairs of genetic and phenotypic correlation estimates, constructed from a survey of published beef cattle genetic parameter estimates, provided a rare opportu- nity to study realized sampling variances of genetic parameter estimates. The distribution of both herita- bility estimates and genetic correlation estimates, when plotted against estimated accuracy, was consistent with random error variance being some three times the sampling variance predicted from standard formulae. This result was consistent with the observation that the variance of estimates of heritabilities and genetic correlations between populations were about four times the predicted sampling variance, suggesting few real differences in genetic parameters between populations. Except where there was a strong biological or statistical expectation of a difference, there was little evidence for differences between genetic and phenotypic correlations for most trait combinations or for differences in genetic correlations between populations. These results suggest that, even for controlled populations, estimating genetic
parameters specific to a given population is less useful than commonly believed. A serendipitous discovery was that, in the standard formula for theoretical standard error of a genetic correlation estimate, the heritabilities refer to the estimated values and not, as seems generally assumed, the true population values.
I
T is axiomatic in quantitative genetic theory that esti- mates of genetic parameters refer to the population in which they are estimated (MATHER and JINKS 1971; FALCONER 1989). In evolutionary studies genetic param- eters often cannot be estimated as information on ge- netic relationships among individuals is generally not available. Where genetic relationships are available, such as in livestock populations, genetic parameters, especially genetic correlations, are estimated with large standard errors, unless the data set is exceptionally large. In an extensive survey of the animal breeding literature (KOOTS et al. 1994a,b), estimates of heritabil- ity and genetic correlation for beef cattle traits were found to have observed between population variances about four times the estimated sampling variances. Such a large difference between the theoretical sam- pling variance and the observed variation in estimates indicates either gross underestimation of individual sampling variance, real differences in parameters among populations, or a combination of the two. Weighted least squares analyses suggested that some systematic (real) differences in genetic parameter esti- mates may exist among populations, but most variation remained unexplained (KOOTS et al. 1994a,b).In most fields of science it is usual to assume that parameters do not differ between groups unless this
Curresponding author: Kenneth R. Koots, Centre for Genetic Im- provement of Livestock, Department of Animal and Poultry Science, University of Guelph, Guelph, Ontario N l G 2W1, Canada. E-mail: [email protected]
Genetics 1 4 3 1409-1416 (July, 1996)
null hypothesis fails a suitable test. Since so much of the variation between estimates of genetic parameter estimates between populations remains unexplained (KOOTS et al. 1994a,b), it is appropriate to examine the null hypothesis that genetic parameters generally do not differ between populations. Indeed, it is surprising that this null hypothesis has not seriously been exam- ined by quantitative geneticists.
A study of the distribution of genetic correlation ma- trices obtained from the literature (CHEVERUD 1988) indicated that differences between genetic and pheno- typic correlations were mostly due to sampling error. Using 41 correlation matrices drawn primarily from mouse populations, it was shown that genetic and phe- notypic correlations were “strikingly similar”. In a sin- gle data set of morphological traits in the sand cricket, ROFF (1995) showed that estimates of phenotypic corre- lations were at least as good as estimates of genetic correlations for providing an estimate of the true ge- netic correlation. If genetic and phenotypic correla- tions are generally similar to one another, then pheno- typic estimates could be substituted for genetic estimates. This would also lead to one particular genetic interpretation of phenotypic evolutionary data. Use of phenotypic correlation estimates in place of genetic correlation estimates might also be desirable in many animal breeding applications, since phenotypic correla- tions are estimated with much higher precision.
1410 K. R. Koots and J. P. Gibson
both genetic and environmental components, such that
( e g , FALCONER 1989)
rp = rghlh
+ r,J(1
- h:)(l -g).
Hence the genetic and phenotypic correlations are in- terdependent. It is clear by t h e above equality, that the similarity of genetic and phenotypic correlations will increase as the heritabilities of the traits increase. Heri- tabilities are, however, generally <0.5 for the majority of traits (see, for example, KOOTS et al. 1994a). Pheno- typic correlations will also be similar to genetic correla- tions when the genetic correlation is similar to the envi- ronmental correlation. Genetic and environmental
correlations may be similar if they are produced by
similar variances of developmental pathways that in many cases seems quite likely (CHEVERUD 1984).
T h e specific objectives of this study were ( 1 ) to test the null hypothesis that most of variation in genetic parameter estimates (heritabilities and genetic correla- tions) between populations is due to errors of estima- tion and (2) to investigate the similarity of genetic and phenotypic correlation estimates. In the process of
these analyses it was discovered that in the classic for- mula for standard error of a genetic correlation esti- mate (REEVE 1955; ROBERTSON 1959), itwas not obvious what the parameters were. A small simulation presented here indicates that the heritabilities in this formula
should be the estimates of the heritability and not the true population values.
MATERIALS AND METHODS
Data: A data set of genetic parameters for beef cattle traits was constructed from a survey of the animal breeding litera- ture, many details of which are given in KOOTS et a[. (1994a). Briefly, all heritability estimates and phenotypic and genetic correlations involving 70 beef cattle traits and available be- tween 1940 and July 1991 were considered. Estimates had to come from data sets greater than a minimum size that de- pended on the estimation procedure used. All but 2% of estimates involved >250 recorded animals. The traits sur- veyed were those important in beef production and cover measurements of reproduction, growth and carcass quality. A
total of 1656 heritability estimates and 1176 pairs of pheno- typic and genetic correlations from 287 studies were obtained. In the present study we used those estimates for which it was possible to derive a standard error. There were 1572 heritabil- ities from 265 populations and 1015 genetic and phenotypic correlation pairs from 99 of these same populations compris- ing the data.
In much of the analysis that follows, theoretical standard errors of heritabilities and genetic correlations are required and these must first be estimated, since standard errors were not provided with all published estimates.
Derivation of standard errors for h2: The standard errors of heritabilities were derived as detailed in KOOTS et al. (1994a). Briefly, the standard errors for the heritability esti- mates were estimated according to standard formulae ( F L
CONER 1989). Heritabilities estimated from the correlation among half-sibs were the most prevalent, and standard errors were estimated as
SE;> =
k ( k - l ) ( s - 1) ' (1)
where t is the intraclass correlation, approximated by i?/4,
( E
is the weighted mean heritability from the literature for that trait); k is average number of offspring per sire; and s is number of sires. Use of the weighted mean heritability esti- mate for each trait when deriving tis consistent with the null hypothesis that most of the variation in heritability estimates reflects sampling variance, and that the t values (and hence h2) used in (1) should be the true values rather than the estimate (FALCONER 1989). This approach also removes the autocorrelation between an estimate of the heritability and its SE, which is expected theoretically when t = h'/4 is used in (1) and was shown to occur in practice by KOOTS et al(1994a). For heritabilities estimated from offspring-parent and offspring-midparent regressions, standard errors were es- timated as SEp = 2/\rNand SEg =
./2/N,
respectively ( N =number of offspring-parent pairs). Whenever they could be calculated, our estimates of standard errors were used in place of those originally reported. Where standard errors could not be estimated directly from the published information, the reported standard error was proportionally adjusted to the mean heritability
( E )
for that trait asThis process of deriving SE for use in our analyses was consis- tent with the null hypothesis of most variation among esti- mates not reflecting real differences and conveniently re- moved the autocorrelation between estimate and standard error. It also allows appropriate SE to be derived for estimates outside the parameter range. The standard errors computed for each heritability estimate here were similar in magnitude to standard errors reported with heritability estimates, the overall mean of our SE and the reported SE both being 0.11.
Derivation of standard errors for fg: The distributional properties of genetic correlation estimates are not well de- fined (BECKER 1975). The sampling variance of Pg is propor- tional to (1 -
ii),
which has a skewed sampling distribution (REEVE 1955). Estimates of the sampling variance of fK wouldbe affected by errors in estimating rr An approximate stan- dard error is given by REEVE (1955) and ROBERTSON (1959) as,
Neither REEVE (1955) nor ROBERTSON (1959) indicated whether the parameters rp h:, and h& appearing in the right side of (2), were the true values for that population or their estimates. By analogy with (1) it seems to be generally a s sumed that the true values are appropriate, but, as shown below, this does not seem to be the case for heritabilities.
Source
of
hy and @ It is standard practice to use the esti- mates of heritability in ( Z ) , since the true values are generally unknown. However, in the present study there is the option to use weighted mean heritabilities for each trait from the literature survey.from mean Deviation
heritability Correlation
Estimated
31
2.
1 .
0
- 1
-2
-31.
0.00 0.02 0.04 0.06 0.08 0.10 0.12 0.14 0.16 0.18 0.20
Geometric mean heritability
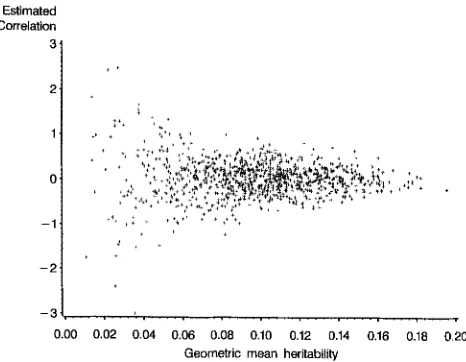
FIGURE 1.-Scatter plot of genetic correlation estimates against the geometric mean of the estimated heritabilities, taken from 1000 simulated populations of 1000 parent-off- spring pairs, each with an expected rR = 0 and h: = = 0.10.
One genetic correlation of 4.18, estimated at a geometric mean estimated heritability of 0.02, lies outside the range indicated and is therefore not shown in this figure.
estimates ( i e . ,
m)
in Figure 1. The heritability estimates had a large effect on the sampling variance of the genetic correlation estimate. When the geometric mean of the esti- mate of the two heritabilities is high, say 0.15, then one can see from Figure 1 that the sampling variance of rR is relatively small; 1 2 SD encompassing 95% of the observations would span the approximate interval -0.5 to +0.5. However, if the geometric mean of the two heritabilities is low, say 0.03, then a 95% confidence interval would be-
-2.5 to +2.5. The variance of the geometric mean estimated heritability is al- most all due to errors 01 estimation, since the 95% intervalfor the true geometric mean heritability in a population of this size and structure is 0.0917 to 0.1083. Since the variance of the correlation estimate is clearly more related to the esti- mated heritabilities than to their true underlying values, it is appropriate to use estimated heritabilities in (2).
Source of:,: It is clear that the value of rs in (2) cannot be
the estimated value, as values outside the range -1 to f 1
would give negative SE. Using an across data set, mean rg is, however, not an option here because, for most pairs of traits, there are few estimates of T~ Since the hypothesis in the pres- ent study is that rg and ,!Y are similar and rp is usually much more accurate that rK, qj was substituted in place of rR in (2).
Since q, is still subject to sampling error, the range of P!, was constrained to be between -0.9 and 0.9 to avoid artificially low SE due to Pp being close to -1 or 1.
In summary, the standard error of each genetic correlation estimate was estimated as
where P!, is the phenotypic correlation estimate; SEXY and SE,g are standard errors based on the population size and "true" (weighted mean) heritabilities; and are the heri- tabilities estimated in each population.
APPENDIX A gives, as an example, mean standard errors esti- mated using (2) and ( 3 ) for a sample set of genetic correla- tions. It is notable that standard errors from (3) are consider- ably larger than from (2) , due to the use of ?!, in place of PR and avoiding values of rf, close to 1 or -1 that would cause
0.5 '
0.0'
-0.5.
0 1000 2000 3000
Estimated Amount of Information
FIGURE 2.-Scatter plot of deviations from trait mean heri- tability against estimated amount of information. Lines are estimated 95% confidence interval assuming sampling vari- ance is equal to that predicted (- - -) and is three times that predicted (-).
very low estimated SE. Over the sample of trait combinations in APPENDIX A, the average sampling variance estimated using ( 3 ) is slightly more than double that using (2). As judged by the mean genetic correlations for each trait pair, only for the correlation between weaning weight and weaning gain, with an average of 0.97, would there be some doubt about setting the maximum value of Pp in (3) to be 0.9.
Analyses: Heritability: The sampling variance of heritability estimates was investigated by plotting heritability estimates, expressed as deviations from trait mean heritabilities ( h 2 ' ) ,
against the estimated amount of information (the square of the inverse of the estimated SEh2) in each heritability estimate (Figure 2). For illustrative purposes the amount of informa- tion in Figure 2 was truncated at 3000, and all observations exceeding this point were set equal to 3000. The resulting plot suggests that the distribution of points is determined from random sampling effect associated with the experiment size (as measured by the estimated amount of information), plus a constant variance not associated with experiment size. The variance of estimates independent of experiment size
bility estimates coming from relatively accurate experiments (estimated amount of information ~ 3 0 0 0 ) . Specifically, the constant variance ( o ~ ; , ~ ~ , ~ , ~ , ) was estimated as
(& h,,,,,,,,,) was estimated from the distribution of those herita-
~
~k:>>,\r*l>,
= 4 A l l j l , - ~~.'iooo'~
where o~z,,,,,,, is the mean theoretical sampling variance of
deviations with information 23000, and is the total variance of deviations with information 23000. The 95% con- fidence intervals were then determined from the total vari- ance that is estimated as
& - z2.
'+,,,,I - f l 4 , , , , \ t . < , , t + d l
for a range of theoretical sampling variances (and hence range of information values). The 95% confidence intervals were also derived assuming a threefold increase in the s m - pling variance as
&, = 62.
,<&XI ~ L , , , , , , , + 3 d
C,,",,,,,, -
~ k , , , , , "
- ~~:~.,ll,lll~where
1412 K. R. Koots and J. P. Gibson
Genetic correlation: The sampling variance of genetic correla- tions, as well as the similarity of genetic and phenotypic corre- lations, was investigated by plotting a measure of their agreement, ?: = fg - f p , against the estimated amount of information in the genetic correlation estimate.
The use of the relative amount of information, calculated as the inverse of the squared standard error, is used in place of the effective sample size used in CHEVERUD (1988). The standard error used here gives a better indication of the preci- sion of the experiment because more information is used (the individual correlation, the heritability of the traits, and the SE of the heritability estimates, which is derived from the number of parents and offspring represented in the data).
A 95% confidence interval was determined for / g following
a procedure similar to that developed for heritabilities above. Briefly, an estimate of an underlying constant variance inde- pendent of experiment size ( o & , ~ ~ ~ ~ ~ ) was derived from the observed variance of
I',
for information above 1500. The trun- cation at 1500 (rather than 3000 for h2) reflects the lower number of estimates for rg and the need to have a sufficient number for reasonable accuracy above the threshold. The variances due to sampling (0: and u ~ ~ , s o o ) cannot be deriveddirectly from the theoretical formulae, as in the case of herita- bilities, and an estimate based on simulation (APPENDIX B)
was used. As shown in APPENDIX B, observed variances of both
rg and
r',
in simulated populations were larger than the theo- retical values for rg predicted from the standard formula (Equations 2 and 3), especially for small data sets. Observed variances from the simulations, therefore, were used as an estimate of the sampling variance. Thus,- u$&&anl - - 0 ; p l s o o - u;~3000.
dpkd = u;pconstont
+
u;.A 95% confidence interval was then constructed as
Confidence intervals were also plotted for an assumed three- fold increase in the error variance of correlation estimates, as for the heritability estimates.
In an additional analysis, product moment correlation coef- ficients between paired genetic and phenotypic correlations were computed within matrices of such correlations and plot- ted against the average amount of information in the genetic correlation matrix (i.e., the mean inverse of squared standard errors of genetic correlation estimates) following CHEVERUD (1988).
RESULTS AND DISCUSSION
Heritability: The distribution of heritability esti-
mates, plotted as deviations from trait mean heritability, is given in Figure 2. The confidence interval represent- ing a threefold increase in the theoretical sampling vari- ance fits the distribution of points well. Although not shown here, the confidence interval representing a threefold increase in sampling variance appeared (by eye) to fit considerably better than a twofold increase and somewhat better than a fourfold increase. While there is necessarily some subjectivity involved, the result seems generally consistent with the observation that the variance of heritability estimates was about four times that predicted from theory (KOOTS et al. 1994a).
As indicated by our confidence intervals, the o b served variance of heritability estimates appears to be
comprised of an underlying variance not due to experi- ment size as well as a component related to experiment size. The source of the underlying constant variance cannot be determined from the data. This variance could be due to differences between populations in heritability and/or to an inherent error variance in the methods or models used to estimate heritability that is independent of sample size. It seems likely that the second factor plays a major role. Estimates are derived from statistical methods that are always simplistic repre- sentations of the real world. The effects of failure of only a few of the many assumptions in such estimation procedures are well documented. For example, the ex- pectation of estimates from half-sib analysis depend on the degree of selection of parents and selection in previ- ous generations for the trait under study (ROBERTSON 1977). ROBERTSON (1977) also pointed out that esti- mates of heritability from parent-offspring regression were not affected by mass selection of parents, but it can easily be shown that this is not true for other forms of selection. Estimates based on animal models can be shown to be unbiased by selection provided pedigrees trace back to an unselected base generation (SORENSEN and KENNEDY 1984; VAN DER WERF and DE BOER 1990). But such data is rarely available in practice, and it has recently been shown that animal model estimates are also subject to large and essentially unpredictable bias in such situations ( JEYARUBAN and GIBSON 1996). Given the widely varying data structure and selection history among populations, such factors likely explain much of the residual variation in estimates of heritability among populations that is unrelated to sample size.
Genetic correlations: The difference between ge-
netic and phenotypic correlation pairs is plotted against the predicted amount of information in the genetic correlation estimate in Figure 3. For illustrative pur- poses the amount of information is truncated at 1500, with the remaining observations plotted at 1500 (see also MATERIALS AND METHODS).
Confidence intervals shown in Figure 3 were esti- mated assuming the error variance of correlation esti- mates was equal to that predicted by (3) or three times that prediction. The distribution of differences between the pairs of genetic and phenotypic correlations were consistent with random sampling effects with variances about three times higher than those obtained from sim- ulation, which were higher than those theoretically pre- dicted from ( 3 ) , which were in turn about twice the more usual predictions based on (2) (see APPENDIX A ) .
Outliers in Figure 3 were mostly from five of the 99 experiments represented in the data set (three of which are illustrated as A, B and C) and dealt with traits where, on biological or statistical grounds, real differences be- tween rg and rp might be expected. In study A (KENNEDY
1
0
- 2 1
0 300 600 900 1200 1500
Estimated Amount of information in r,
FIGURE 3.-Scatter plot of the difference in paired esti- mates of genetic and phenotypic correlations against the esti- mated amount of information. Lines are estimated 95% con- fidence interval assuming sampling variance is equal to that predicted (-- -) and is three times that predicted (-). Outli- ers in this figure were mostly from five experiments, three of which are illustrated: (A) KENNEDY and HENDERSON (1975),
(B) KRIESE et al. (1991), and (C) SCHAEFFER and WILTON
(1981).
correlations may be low or negative due to the phenom- enon of compensatory gain. In study B (KRIESE et al. 1991), correlations were of direct with maternal effects where genetic correlation estimates may be negative due to statistical confounding (MEYER 1992). In study C (SCHAEFFER and WILTON 1981), correlations were of calving ease and body size where genetic correlations will likely be negative and environmental correlations positive on the assumption that calving ease is partly dependent on calf size relative to dam size.
Overall, Figure 3 suggests that the variance of ge- netic correlation estimates, like heritabilities, is com- prised of an underlying variance not associated with experiment size, plus a sampling variance at least three times that expected from the corrected standard for- mula (Equation 3) or more than six times that of a more usual formula (Equation
2).
While it is generally accepted that the approximate formula for the stan- dard error of a genetic correlation estimate ( i e . , REEVE1955; ROBERTSON 1959) yields a slight underestimate of the true value [e.g., ROFF and PREZIOSI (1994) showed a 10% underestimation], the present study in- dicates that underestimation is much larger than pre- viously thought.
The within matrix correlation between estimates of genetic and phenotypic correlations is plotted against the average amount of information in the genetic corre- lation matrix in Figure 4. Clearly, the genetic and phe- notypic correlations become more similar as the preci- sion of the genetic correlation estimates increases. The decrease in correlation between genetic and pheno- typic correlation estimates as the standard error in- creases (Figure 4) might be due to either autocorrela-
Correlation between estimated r, and r,
+
0.5.
+++;
+ + +
0.0
I
++
- 0.5,
+
+ + I +
+
+ +
A
- t o (
0 100 200 300 400 500
Amount of information
FIGURE 4.-Scatter plot of correlation between paired ge-
netic and phenotypic correlation estimates within populations against the average amount of information in each genetic
correlation matrix. The outlier in this figure (A) was from the study of WESE et al. (1991) that, as indicated in Figure 3 and in the text, involved traits where rg and rp might be expected to differ because of statistical confounding.
tion in the estimation of standard error using (3) above or a structural bias where traits with low correlations and heritabilities tend to come from small experiments. The latter possibility could arise because reproduction traits often have low heritabilities and low correlations with nonreproduction traits and are difficult to measure on a large scale. The possibility of this occuring in the present data set was investigated in KOOTS and GIBSON (1994). Briefly, the data set of genetic correlation esti- mates was split into quintiles based on a measure of experiment size independent of estimates of genetic correlation or heritability. The standard error of the heritabilities of the traits, estimated at a constant herita- bility for all traits, was taken as an indication of the experiment size. In general, there was no tendency for traits of low genetic correlation (or low heritability) to be estimated from small experiments (KOOTS and GIBSON 1994). Estimates of heritability did, however, tend to be higher in the smallest experiments (fifth quintile). This is consistent with a bias due to negative heritabilities not being published (which would occur more often in small data sets), as shown in KOOTS et al.
(1994a).
The only other studies found in the literature that compared published genetic and phenotypic correla- tion estimates (CHEVERUD 1988; ROFF 1996) also showed evidence that these correlations are generally similar. Using mean differences of squared correlation matrices, CHEVERUD (1988) concluded that genetic and phenotypic correlation estimates were “strikingly simi- lar”. It was also suggested that much of the apparent dissimilarity between them was due to the sampling er- ror of the genetic correlation estimate. CHEVERUD
1414 K. R. Koots and J. P. Gibson
matrix pairs, 17 of which were from a single mouse population at the University of Wisconsin. The present study confirms the observations of CHEVERUD (1988), using a much larger set of correlation pairs from a single species. Also, in the present study, only indepen- dent matrix pairs were considered. That is, genetic and phenotypic correlation pairs were only added to the data set if they were believed to be from populations completely independent of those already represented in the data. Furthermore, estimates of the standard er- rors on each genetic correlation were available in the present study, and these should give a better indication of the precision of each estimate, compared to the effec- tive population size used in CHEVERUD (1988).
In the study of ROFF (1996) literature estimates from 51 nondomestic species of plants and animals were ana- lyzed, and results consistent to those presented here were obtained. Following CHEVERUD (1988), ROFF
(1996) analyzed the distribution of the squared differ- ence between and fg and f p , as opposed to the distribu- tion of the difference, here. KOOTS (1994) found that the squared difference between fg and f p had unpleasant and largely undetermined distributional properties, which led us to adopt the approach presented here. Using a paired t-test, ROFF (1996) concluded that the difference between genetic and phenotypic correlation involving morphological traits was not different from the predicted sampling variance of rK Given that the predicted sampling variance of rP is shown here to be underestimated by a factor of -6, it is likely that the distribution of the squared difference for the remaining two groups of traits in ROFF (1996), life history and behavioral, are also not significantly different from er- rors of estimation.
Implications: When estimates of genetic parameters are required for genetic evaluation procedures, de- termining optimum selection indices, or in modelling breeding schemes, it is common practice to use esti- mates for the local population where available. The results here indicate that such practice is probably not appropriate. Better estimates can be obtained by com- bining literature estimates with local estimates. When allowance is made for the much larger errors affecting estimates than accounted for in standard estimates of sampling variance, the local estimate will generally have little weight when a body of published estimates for other populations already exists. However, since the current results do not rule out the possibility of some real differences between populations, the exact weighting given to local us. literature estimates remains a matter of personal judgement.
HILL and THOMPSON (1978) showed that the proba- bility that a matrix of estimated genetic correlations is not positive definite increases rapidly as the number of traits included in the analysis increases. The problem will be even worse when estimates have to be drawn from various sources because correlations exist among
parameter estimates from the same data set (KOOTS et
al. 1994a,b), and standard errors of estimates are shown here to be much larger than theoretical estimates. Where matrices are nonpositive definite, techniques based on no prior information, such as bending (HAXS
and
HILL
1981; FOULLEY and OLLMER 1986) or “rounding” (TAI 1989) may be used to force positive definiteness. The results here suggest that a better ap- proach to obtaining consistent and positive definite ma- trices would be by using phenotypic correlations in place of genetic correlations, unless there are strong aF o r i arguments why genetic and phenotypic correla- tions should differ for the given traits. Alternatively, if
bending of genetic correlation matrices is desired, then bending toward the phenotypic correlation matrix as opposed to regressing the correlations toward zero, as in HAYES and HILL (1981), would be more appropriate.
With such difficulties facing relatively large struc- tured livestock populations, the problem of obtaining useful estimates for population and evolutionary ge- netic analysis of wild populations is daunting. This is in addition to the problem suggested by HOULE (1991) that genetic correlations for some traits do not have ready biological interpretations.
Conclusions: A model is presented that adequately describes much of the variance of genetic parameter estimates. Furthermore, it is shown that the distribu- tion of estimates of both heritability and genetic corre- lation is consistent with random sampling effects with a variance about three times higher than theoretically predicted here. For genetic correlations, this relates to six times those predicted by the more usual formula. Since one would also expect considerable residual vari- ance independent of experiment size, due to failure of models to adequately explain the data, it is con- cluded that most of the variation in genetic parameter estimates between populations is likely due to error variation not accounted for in standard methods of estimating error variances and is not due to local popu- lation differences.
This indicates that obtaining local population esti- mates of genetic parameters is considerably less im- portant than generally believed when estimates from other populations already exist. At the very least esti- mates from other sources, and in the case of genetic correlations, estimates of phenotypic correlations, should be taken into account when constructing vari- ance/covariance matrixes for genetic evaluation or modelling selection schemes.
LITERATURE CITED
BECKER, W. A,, 1975 Manual of Quantitative Genetics. Washington State University Press, Pullman, WA.
CHEVERUD, J. M., 1984 Quantitative genetics and developmental
constraints on evolution by se1ection.J. Theoret. Biol. 110 155- 171.
CHEVERUD, J. M., 1988 A comparison of genetic and phenotypic
FALCONER, D. S., 1989 Introduction to Quantitative Genetics. Longman, London.
FOULLEY, J. L., and L. OI.LMER, 1986 A note on criteria of coher- ence for the parameters used to construct a selection index. J. Anim. Breed. Genet. 103: 81-86.
HAYES, J. F., and W. G. HILI,, 1981 Modification of estimates of parameters in the construction of genetic selection indices (‘bending’). Biometrics 37: 483-493.
HIIL, W. G., and R. THOMPSON, 1978 Probabilities of non-positive definite between group or genetic covariance matrices. Biomet-
HOUI.E, D., 1991 Genetic covariance of fitness correlates: what ge- netic correlations are made of and why it matters. Evolution 4 5
JFXARUBAN, M. G . , and J. P. GIBSON, 1996 Estimation of additive genetic variance in commercial layer poultv and simulated p o p ulations under selection. Theor. Appl. Genet. (in press).
KENNEDY, B. W., and C. R. HENDERSON, 1975 Genetic, environmen- tal and phenotypic correlations between growth traits of Here- ford and Aberdeen Angus calves. Can. J. Anim. Sci. 5 5 503-507.
KOOTS, K. R., 1994 Studies on the genetic and economic parameters required for beef cattle improvement. Ph.D. Dissertation, Univer-
sity of Guelph, Ontario, Canada.
KOOTS, K. R., and J. P. GIBSON, 1994 How precise are genetic corre- lation estimates? Proceedings of the 5th World Congress on Ge- netics Applied to Livestock Production 18: 353-356.
KOOTS, K. R., J. P. GIBSON, C. SMITH and J. W. WILTON, 1994a Analy- ses of published genetic parameter estimates for beef production traits. 1. Heritability. Anim. Breed. Abstr. 62: 309-337. KOOTS, K. R., J. P. GIBSON and J. W. WILTON, 1994b Analyses of
published genetic parameter estimates for beef production traits. 2. Phenotypic and genetic correlations. Anim. Breed. Abstr. 62:
825-853. rics 34: 429-439.
630-648.
KRIESE, L. A, J. K. BERTRAND and L. L. BENISHEK, 1991 Age adjust- ment factors, heritabilities and genetic correlations for scrotal circumference and related growth traits in Hereford and Bran- gus bulls. J. Anim. Sci. 69: 478-489.
MATHER, IC, and J. L.JINKS, 1971 Biometrical Gemtzcs. Chapman and Hall, London.
MEYER, K., 1992 Bias and sampling covariance of estimates of vari- ance components due to maternal effects. Genet. Sel. Evol. 2 4
REEVE, E. C. R., 1955 The variance of the genetic correlation coeffi- cient. Biometrics 11: 357-374.
ROBERTSON, A,, 1959 The sampling variance of the genetic correla- tion coefficient. Biometrics 15: 219-226.
ROBERTSON, A,, 1977 The effect of selection on the estimation of
genetic parameters. Zeitschrift fur Tierzuchtung 94: 131-135. ROFF, D. A,, 1995 The estimation of genetic correlations from phe-
notypic correlations: a test of Cheverud’s conjecture. Heredity
ROW, D. A,, 1996 The evolution of genetic correlations: an analysis of patterns. Evolution (in press).
Row, D. A,, and R. PREZIOSI, 1994 The estimation of the genetic correlation: the use of the jacknife. Heredity 73: 544-548. SCHAEFFER, L. R., and J. W. WILTON, 1981 Estimation of variances
and covariances for use in a multiple trait beef sire evaluation model. Can. J. Anim. Sci. 61: 531-538.
SORENSEN, D. A., and B. W. KENNEDY, 1984 Estimation of genetic variances from unselected and selected populations. J. h i m . Sci.
TAI, G. C. C., 1989 A proposal to improve the efficiency of index selection by “rounding”. Theoret. Appl. Genet. 7 8 798-800.
VAN DER WERF, J. H. J., and I. J. M. DEBOER, 1990 Estimation of Anim. Sci. 68: 3124-3132.
additive genetic variance when base populations are selected. J. 487-509.
74: 481-490.
59: 1213-1223.
Communicating editor: G. B. GOLDING
APPENDIX A
Observed and predicted variation in a series of genetic correlations
Correlation
No. of
estimates Mean SD - SE“ - S E b
Traits
BWD, CED 27 -0.71 0.29 0.03 0.18 BWD, PWG 43 0.35 0.21 0.15 0.18
BWD, WGD 31 0.36 0.35 0.16“ 0.27 BWD, WWD 77 0.47 0.24 0.14 0.20 BWD, YWD 37 0.48 0.23 0.13 0.17
CED, WWD 24 -0.16 0.17 0.53 0.57 CED, YWD 14 -0.29 0.12 0.69 0.76
PWG, WGD 37 0.39 0.31 0.13 0.16
PWG, WWD 66 0.39 0.34 0.17 0.22 PWG, YWD 58 0.81 0.22 0.05 0.10
WGD, WWD 37 0.97 0.18 0.03d 0.09
WGD, YWD 23 0.75 0.20 0.08 0.08
WWD, YWD 66 0.78 0.18 0.09 0.13
All 1490 0.28 0.51 0.14“ 0.20
From KOOTS et al. (1994b).
1416 K. R. Koots and J. P. Gibson
APPENDIX B
S u m m a r y of data sets simulated for empirical confidence intervals for the following true set of parameters: rg = rp = 0.32, h* = 0.25
Theoretical" No. of
matings replicates SEI ~ SE2, SE, SE, SET,,''
Observed No. of
100 200 300 500 750 1000 2000 6000 18000
1000 1000 1000 1000 1000 1000 500 200 200
0.359 0.254 0.207 0.161 0.131 0.114 0.080 0.046 0.027
0.511 0.326 0.245 0.174 0.138 0.118 0.082 0.047 0.027
1.052 0.503 0.304 0.195 0.155 0.130 0.087 0.052 0.033
0.088 0.063 0.049 0.039 0.032 0.027 0.020 0.01 1 0.007
1.038 0.501 0.298 0.189 0.151 0.127 0.085 0.051 0.032
Simulations involved the mating of a given number of unrelated parents, each mating resulting in one offspring. Populations were also simulated using different true genetic parameter values, but similar results were obtained and are therefore not presented here.
"SE1, = SE based on true parameters (Equation 2 in text); SE2, = SE based on estimates of h2 and rp (Equation 3 in text).
( I f