Copyright2000 by the Genetics Society of America
Identification of Heading Date Quantitative Trait Locus
Hd6
and Characterization of Its Epistatic Interactions With
Hd2
in Rice Using Advanced Backcross Progeny
Toshio Yamamoto,*
,1Hongxuan Lin,
†Takuji Sasaki
‡and Masahiro Yano
‡*Institute of the Society for Techno-innovation of Agriculture, Forestry and Fisheries, Tsukuba, Ibaraki 305-0854, Japan, †Bio-oriented Technology Research Advancement Institution, Omiya, Saitama 331-8537, Japan and‡Department
of Molecular Genetics, National Institute of Agrobiological Resources, Tsukuba, Ibaraki 305-8602, Japan Manuscript received July 6, 1999
Accepted for publication October 25, 1999
ABSTRACT
A backcrossed population (BC4F2) derived from a cross between a japonica rice variety, Nipponbare, as the recurrent parent and an indica rice variety, Kasalath, as the donor parent showed a long-range variation in days to heading. Quantitative trait loci (QTL) analysis revealed that two QTL, one on chromosome 3, designated Hd6, and another on chromosome 2, designated Hd7, were involved in this variation; and Hd6 was precisely mapped as a single Mendelian factor by using progeny testing (BC4F3). The nearly isogenic line with QTL (QTL-NIL) that carries the chromosomal segment from Kasalath for the Hd6 region in Nipponbare’s genetic background was developed by marker-assisted selection. In a day-length treatment test, the QTL-NIL for Hd6 prominently increased days to heading under a 13.5-hr day length compared with the recurrent parent, Nipponbare, suggesting that Hd6 controls photoperiod sensitivity. QTL analysis of the F2 population derived from a cross between the QTL-NILs revealed existence of an epistatic interaction between Hd2, which is one of the photoperiod sensitivity genes detected in a previous analysis, and Hd6. The day-length treatment tests of these QTL-NILs, including the line introgressing both Hd2 and Hd6, also indicated an epistatic interaction for photoperiod sensitivity between them.
T
HE genetic analysis of quantitative traits using DNA cal genetics and improvements in analytical software markers is a landmark feature in the field of plant have contributed to solving these problems (Tinkergenetics. Since the first application of DNA markers to andMather 1995;Chase et al. 1997;Nelson1997). quantitative trait loci (QTL) mapping in tomato was Several attempts to identify epistatic interactions reported (Paterson et al. 1988), numerous genetic among QTL have been made, including successful stud-studies of quantitative traits have been done in a large ies of soybean (Larket al. 1995) and rice (Liet al. 1997;
number of plant species. Some QTL were suggested to Yuet al. 1997). However, confidence in their detection be associated with some major genes previously identi- of interactions is low because of small population size fied by classical genetic analysis (Beaviset al. 1991;Yano or the use of primary segregating populations such as F2,
et al. 1997). Syntenic relationships in chromosomal con- F2-derived F3, or recombinant inbred lines that segregate
stitution involving QTL among plant species were also whole parental chromosomal segments simultaneously. suggested from the results of comparative linkage map- To improve confidence, different types of plant materi-ping among different plant species with common DNA als have been constructed. Series of chromosomal substi-markers (Patersonet al. 1995). tution lines or nearly isogenic lines (NILs) with QTL
Although QTL analysis gives us much information on (QTL-NILs) have been developed, and the gene actions plant genetics, it has inherent methodological prob- of QTL have been analyzed in detail (Dorweiler et lems, especially in QTL detection. First, it is difficult to
al. 1993;Doebleyet al. 1995;Eshed andZamir1996; distinguish two QTL that are tightly linked. Second,
Tanksleyet al. 1996;BernacchiandTanksley1997; which threshold should we use to detect QTL with
rela-H. X. Lin, T. Yamamoto, T. SasakiandM. Yano, un-tively small effect? Third, how do we detect a QTL
show-published results). Moreover, fine mapping of QTL has ing epistatic interaction with other QTL (Tanksley
been done by using QTL-NILs (Alpert and Tanksley
1993;YanoandSasaki1997)? Developments in
statisti-1996;Yamamotoet al. 1998) to clone them, which
sug-gests that some QTL can be dealt with as Mendelian factors.
Corresponding author: Masahiro Yano, Department of Molecular
Ge-netics, National Institute of Agrobiological Resources, 2-1-2 Kannon- Heading date is a critical trait for adaptation to
differ-dai, Tsukuba, Ibaraki 305-8602, Japan.
ent cultivation areas and cropping seasons. At present,
E-mail: [email protected]
23 major genes controlling heading date have been 1Present address: Orynova K. K., Toyoda, Iwata, Shizuoka 438-0802,
Japan. reported in rice, and 13 of them were determined for
886 T. Yamamoto et al.
were cultivated in the normal growing season according to localized chromosome (Ichitaniet al. 1998;Kinoshita
standard practice. The duration from seeding to heading was 1998). On the other hand, many reports of QTL
map-from April to August. The mean day lengths and mean temper-ping for heading date in rice by using DNA markers atures under natural conditions in Tsukuba are as follows: 12 have also increased in these 5 years (Liet al. 1995;H. X. hr, 56 min and 14.38 for April; 14 hr, 4 min and 18.78 for
May; 14 hr, 37 min and 19.88for June; 14 hr, 17 min and 23.58
Lin et al. 1995; Xiao et al. 1995, 1996, 1998; Lu et al.
for July; and 13 hr, 26 min and 25.28for August, respectively. 1997; Yano et al. 1997;Doi et al. 1998;S. Y. Lin et al.
Linkage mapping and QTL analysis:To make RFLP linkage 1998; Xiong et al. 1999). It is necessary to clarify the
maps for the heterozygous regions of BC4F1-37-7, 26 RFLP relationships among these major genes and QTL, and markers in these regions were selected from a high-density their biological functions—response to photoperiod linkage map constructed byHarushima et al. (1998). The genotypes of these loci in each BC4F2plant were determined and duration of basic vegetative growth.
by Southern hybridization analysis following the procedure
Yanoet al. (1997) has reported five QTL, designated
ofKurataet al. (1994).
Hd1–Hd5, controlling rice heading date in an F2popula- Mapmaker/EXP 3.0 (
Landeret al. 1987) was used for link-tion from a cross between a japonica variety, Nipponbare, age analyses based on the genotype data of each BC
4F2plant. and an indica variety, Kasalath. Another three QTL have The Kosambi function was used to calculate genetic distances. QTL for heading date were estimated by Mapmaker/QTL 1.1 been reported based on the analysis of backcross inbred
(Lincolnet al. 1993). Putative QTL were identified in regions lines derived from the same cross (Lin et al. 1998).
exceeding 3.0 LOD (log likelihood value). Fine mapping of These reports implied that the detected QTL could not
target QTL was done by using genotype data of target QTL explain all of the variation in days to heading. In this estimated in BC
4F3progeny testing.
study, an unpredictable long-range variation in days to Evaluation of gene action and confirmation of epistatic in-teraction of QTL:To evaluate the gene action of target QTL, heading was observed in a population derived from one
a day-length treatment test was done. A QTL-NIL in which a backcrossed plant homozygous for the Nipponbare
al-chromosomal region of the target QTL was homozygous for lele in seven of eight known QTL and heterozygous
the Kasalath allele was selected by marker-assisted selection in the other. To identify genetic factors involving this (MAS) from the segregants of a series of backcrossed progeny. variation, QTL analysis of heading date in this popula- This QTL-NIL, called NIL(target QTL), and Nipponbare as a control were cultivated under four day-length conditions tion was done. We then tried to confirm this newly
(10.5, 12.0, 13.5, and 14.5 hr) in growth chambers. The trial found QTL as a Mendelian factor by the method of fine
used a completely randomized design with two replications mapping used byYamamotoet al. (1998). Subsequently,
per block, seven plants per replication. Days to heading of a day-length treatment test was done by using some each plant were scored as in the field experiment.
combinations of QTL-NILs and their recurrent parent A preliminary experiment using some backcross progeny suggested that the response to photoperiod of Hd2, a photope-for estimating the gene action of this QTL. We discuss
riod sensitivity gene (H. X. Lin, T. Yamamoto, T. Sasakiand why we could detect this QTL in the backcrossed
popula-M. Yano,unpublished results), seemed to be affected by the tion but not in the F2population, and the possibility of genotype of the target QTL newly found in this study. To epistatic interaction among QTL controlling heading confirm the epistatic interaction of Hd2 and the target QTL,
date. self-pollinated progeny of an F1plant derived from a cross
between NIL(Hd2), developed by our group (H. X. Lin, T. Yamamoto, T. SasakiandM. Yano,unpublished results), and NIL(target QTL) were cultivated in the paddy field. Scoring MATERIALS AND METHODS
of days to heading and RFLP analysis were done for all segre-gants. The genotype of each QTL was assigned to the genotype Experimental materials:The process of developing
experi-of the marker locus nearest to it. Averages experi-of days to heading mental material followedYamamotoet al. (1998). An F1plant,
in each class of QTL combination were compared by SAS a cross between Nipponbare and Kasalath, was backcrossed
GLM Proc (SAS Institute1989). with Nipponbare as the male parent. By self-pollinating of
Selected lines of three kinds of QTL-NILs—NIL(Hd2), this BC1F1plant, several BC1F2 populations were produced.
NIL(target QTL), and NIL(Hd2/target QTL), in which both Suitable BC1F2plants, in which at least five QTL for heading
Hd2 and the target QTL are introgressed—and Nipponbare date (Hd1–Hd5;Yanoet al. 1997) were homozygous for the
were cultivated under three day-length conditions (10.5, 12.0, Nipponbare allele, were selected by whole-genome survey with
and 14.5 hr) in growth chambers. The days to heading in each restriction fragment length polymorphism (RFLP) markers
line were then compared among lines. The same experimental and crossed with Nipponbare again. Finally, we selected a
design as above was used. BC4F1 plant (BC4F1-37-7), in which there were introgressed
chromosomal segments of parts of chromosomes 2, 3, 6, and 8 from Kasalath (Figure 1).
Self-pollinated progeny (BC4F2) derived from BC4F1-37-7 RESULTS (n5100) were cultivated in an experimental paddy field at
Frequency distribution of days to heading and QTL
the National Institute of Agrobiological Resources, Tsukuba,
Japan. Scoring of days to heading (defined as duration from analysis in the BC4F2 population: The selected plant,
sowing to emergence of the first panicle) and RFLP analysis BC4F1-37-7 (Figure 1), was homozygous for the Nippon-for heterozygous chromosomal regions were done Nippon-for all se- bare alleles for five QTL (Hd1–Hd5) detected in the gregants. Then 50 BC4F3progeny of each BC4F2plant were
F2 population (Yano et al. 1997). This plant was also cultivated in the paddy field. The genotype of the target QTL
homozygous for two of three additional QTL detected in each BC4F2plant was determined from the segregation of
het-Figure1.—Graphical genotype of plant BC4F1-37-7. Black and white regions represent segments of the chromosomes derived from Kasalath and Nipponbare, respectively. Ellipses indicate approximate positions of QTL detected in the F2population (Yano et al. 1997); triangles indicate three additional QTL detected in a BC1F5population (Linet al. 1998).
erozygous for the other on chromosome 2 (Lin et al. some 3 (Table 1). Another QTL (tentatively designated
Hd7) showing a significant signal was near RFLP marker
1998). A self-pollinated progeny derived from this plant
showed a continuous variation of 22 days’ range (Figure C560 on chromosome 2 (Table 1). We thus identified a QTL, Hd6, that had escaped from the QTL detection 2). This variation seemed to be later than the variation
in Nipponbare. QTL analysis with genotype data of the in a previous F2-based analysis byYanoet al. (1997) and confirmed another, Hd7, which is likely to be the QTL heterozygous regions of BC4F1-37-7 revealed that the
most significant QTL (tentatively designated Hd6) was detected byLinet al. (1998).
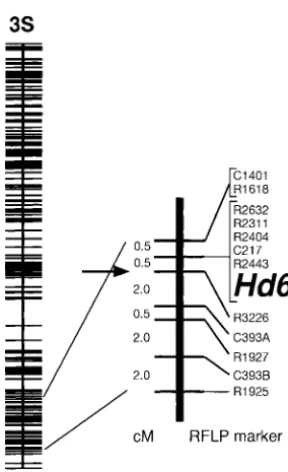
Fine mapping ofHd6:In BC4F3progeny testing, three near RFLP marker R3226 on the long arm of
chromo-apparent phenotypes of heading were clearly visible: fixed lines of early heading (20 lines), segregating lines from early to late (52), and fixed lines of late heading (28). These values fit the ratio of single Mendelian segre-gation (x2 5 1.44). The three phenotypes were likely caused by the differences in the Hd6 genotypes, based on the comparison of explained variances between Hd6 and Hd7, although these two QTL segregated simultane-ously in this population. Thus, early fixed lines are likely to be homozygous for the Nipponbare allele at Hd6, segregating lines are likely to be heterozygous, and late fixed lines are likely to be homozygous for the Kasalath allele. No recombinant was observed between Hd6 and
Figure 2.—Frequency distribution of days to heading in five RFLP markers, R2443, C217, R2404, R2311, and self-pollinated progeny derived from BC4F1-37-7. Three
geno-R2632 (Figure 3). This position was slightly different type classes of Hd6, (h) heterozygous, (j) homozygous for
from the LOD peak of the QTL analysis (R3226). Kasalath allele, and ( ) homozygous for Nipponbare allele,
888 T. Yamamoto et al.
TABLE 1
QTL controlling heading date detected in a self-pollinated population derived from BC4F1-37-7
Effects on the phenotype
QTL Chromosome NML LOD a d d/a PVE
Hd6 3 R3226 19.2 4.8 2.5 0.52 58.7
Hd7 2 C560 3.2 2.4 0.1 0.04 13.8
NML, nearest marker locus to the QTL; LOD, log likelihood value calculated by MAPMAKER/QTL vers. 1.1 in the condition of unconstrained genetics; a, additive effect on the Kasalath allele on days to heading; d, dominant effect of the Kasalath allele; d/a, degree of dominance; PVE, percentage of total phenotypic variance explained by the QTL.
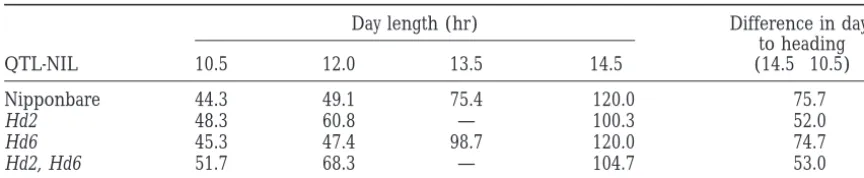
genotype of NIL(Hd6). Table 2 shows days to heading in of both Hd2 and Hd6 influenced this variation (data NIL(Hd6) and Nipponbare under different day lengths. not shown). Figure 5 shows differences among mean There was a significant difference in photoperiod sensi- values of days to heading for nine genotype classes. tivity between NIL(Hd6) and Nipponbare at 13.5-hr day Under field conditions, a phenotypic difference caused length, suggesting that Hd6 was the locus controlling by the genotype of Hd6 was observed when the genotype photoperiod sensitivity and that the Kasalath allele en- of Hd2 was homozygous for Nipponbare or heterozy-hanced photoperiod sensitivity. gous, but not when the genotype of Hd2 was
homozy-Evidence for epistatic interaction between Hd2and gous for Kasalath. This result suggests that Hd2 is
epi-Hd6:An F1hybrid of NIL(Hd2) (Figure 4B) and NIL(Hd6) static to Hd6 in the field.
was developed to confirm an epistatic interaction between To further confirm the epistatic interaction between
Hd2 and Hd6. A self-pollinated population (n596) of these two QTL, a day-length treatment test in a growth this F1plant showed 27 days’ variation in range in days chamber was done with three QTL-NILs: NIL(Hd2), to heading. QTL analysis showed that the segregation NIL(Hd6), and NIL(Hd2/Hd6), which is a QTL-NIL for both Hd2 and Hd6 (Figure 4C). Table 2 summarizes the responses of days to heading. NIL(Hd6) showed responses different from those of Nipponbare (ex-plained in the previous section) and remained un-headed at 14.5-hr day length. Thus, the effect of the Kasalath allele of Hd6, increasing days to heading under long day length, was observed in plants homozygous for the Nipponbare allele at Hd2 but not in those homozy-gous for the Kasalath allele. These results clearly support an epistatic interaction between Hd2 and Hd6.
DISCUSSION
Yanoet al. (1997) indicated that five QTL (Hd1–Hd5)
cause variation in rice heading date in crosses between Nipponbare and Kasalath. However, they could not ex-plain all of the variation by these five QTL, and discussed the possibilities of both imprecise estimation of gene interaction among them and failure to detect additional QTL. Our study found two additional QTL controlling rice heading date in a population derived from progeny
Figure 3.—Linkage map of chromosome 3, showing the backcrossed between the same parents (Table 1). The location of Hd6. The left vertical bar indicates an RFLP linkage
larger one, Hd6, is new; the smaller one, Hd7, is likely map constructed from the F2population of Nipponbare and
to be the same as one of three QTL reported byLinet
Kasalath (Harushimaet al. 1998). The right vertical bar
repre-sents the linkage map constructed in this study. Map distances al. (1998). Judging from its estimated gene effect, Hd6
(cM) were calculated by the Kosambi function and are shown might account for all of the previously unexplained on the left of the bar. Names of markers and QTL are shown
phenotypic variation in the F2population described by on the right. The arrow shows the nearest marker loci, which
Yano et al. (1997). Fine mapping revealed that Hd6
were estimated by Mapmaker/QTL from analysis of the BC4F2
Figure5.—Differences in mean values for days to heading in nine genotype classes of F2segregants derived from the cross combination between NIL(Hd2) and NIL(Hd6) under field conditions. Each genotype is represented by the two nearest marker loci (C728 for Hd2 and R2311 for Hd6). N, H, and K indicate homozygosity for the Nipponbare allele, heterozygosity, and homozygosity for the Kasalath allele, re-spectively.
Mendelian factor (Figure 3). It will be possible to use map-based cloning to identify Hd6.
Relationship between Hd6 and previously reported
genes (QTL and classical mutants) controlling heading
date: Some QTL on rice chromosome 3 controlling
heading date have already been reported (Liet al. 1995;
H. X.Linet al. 1995;Xiaoet al. 1995, 1996, 1998; S. Y.
Linet al. 1998;Xionget al. 1999). Most were identified
by using RFLP markers developed at Cornell University (Causseet al. 1994).Harushimaet al. (1998) clarified
the direction of the chromosome arms in a high-density linkage map from the Japanese Rice Genome Research Program by using RFLP markers that had been used to define the direction in the Cornell linkage map (Singh
et al. 1996). Based on the comparison of these two
link-age maps, Hd6 might be at the same locus as both
dth3-2 and dth3.1 reported byXiaoet al. (1995, 1998).
To confirm this possibility, common molecular markers must be used to map both QTL. Including the major photoperiod sensitivity gene reported previously, there are now no more reported genes on the long arm of chromosome 3.
Gene action ofHd6:At 13.5-hr day length in the growth chamber, the difference in days to heading between NIL(Hd6) and Nipponbare wasz23 days (Table 2). Based on the comparison of days to heading in three genotypes of Hd6 when Hd2 was homozygous for Nipponbare
(pho-Figure 4.—Graphical genotypes of three QTL-NILs.
toperiod-sensitive allele), the effect of increasing days to NIL(Hd6) (A) and NIL(Hd2/Hd6) (C) were developed in this
heading wasz9 days in the field (Figure 5). These facts study. NIL(Hd2) (B) was developed in our group (H. X. Lin,
T. Yamamoto, T. SasakiandM. Yano,unpublished results). suggest that Hd6 was itself the gene with strong photope-Ellipses and triangles are as in Figure 1. riod sensitivity, even though it had not been detected in
890 T. Yamamoto et al.
TABLE 2
Comparison of days to heading of three QTL-NILs and the recurrent parent, Nipponbare, under different day-length conditions
Day length (hr) Difference in days
to heading
QTL-NIL 10.5 12.0 13.5 14.5 (14.5210.5)
Nipponbare 44.3 49.1 75.4 .120.0 .75.7
Hd2 48.3 60.8 — 100.3 52.0
Hd6 45.3 47.4 98.7 .120.0 .74.7
Hd2, Hd6 51.7 68.3 — 104.7 53.0
All plant materials were grown in growth chambers at 288for 12 hr and 248for 12 hr.
Why was a QTL having a large gene effect not de- 1992), tomato (De VicenteandTanksley1993),
soy-bean (Larket al. 1995), sorghum ( Y. R.Linet al. 1995), tected in a primary population? In the F2 population,
the LOD score of the RFLP marker near Hd6 was 0.75 and rice (Xiao et al. 1995; Li et al. 1997; Yano et al.
1997;Yuet al. 1997)—but successful examples of
detec-(M.Yano, unpublished data). With a score this low, it is
difficult to predict the existence of a QTL; the empirical tion seem to be relatively few. The more the number of contributing QTL increases, the more difficult it is threshold level in many reports is 2.0–3.0. Although the
F2study and this study used the same parents, Nippon- to detect significant differences to distinguish individual QTL, except by using a huge population size.Yano et
bare and Kasalath, why did the results differ?
Consider-ing our day-length treatment test of some combinations al. (1997) predicted an interaction between Hd1 and Hd2, the two largest QTL. But the existence of Hd6 and
of QTL-NILs, epistatic interaction might be an
explana-tion. In the field, days to heading of the segregants its interaction could not be detected in their analysis population (F2). They suggested that many epistatic in-homozygous for the Kasalath allele of Hd2 were not
affected by the genotype of Hd6 (Figure 5). This suggests teractions could exist in so-called minor QTL that are not detected in the primary population.
that Hd6 might influence the expression of photoperiod
sensitivity caused by Hd2. In the QTL analysis of 186 F2 Thus it is necessary to develop new experimental ma-terials, such as chromosomal substitution lines or NILs, plants byYanoet al. (1997), the phenotypic difference
caused by segregation of the chromosomal region, for better understanding of quantitative genetics. As in the cases ofDoebleyet al. (1995) with teosinte,Eshed
where Hd6 is located, was surveyed under the situation
of simultaneous segregation of two major photoperiod- andZamir(1996) orBernacchiandTanksley(1997) with tomato, and this study with rice, we can understand sensitive QTL, Hd1 and Hd2. This situation could not
secure a large enough population to detect the gene epistatic interactions among QTL three ways: by con-structing QTL-NILs for each detected QTL by MAS effect of Hd6, which shows epistatic interaction. As a
result, the variance due to the difference in genotypes based on the results of primary QTL analysis, by combin-ing QTL by crosscombin-ing all QTL-NILs, and by comparcombin-ing might not be distinguishable from the variance due to
the segregation of other QTL and environmental error. each phenotype with each combining QTL genotype. We have used this strategy and suggest that three photo-In summary, in QTL analysis of a population in which
a QTL with a large effect will segregate, a putative gene period-sensitive QTL, Hd1, Hd2, and Hd3, interacted with each other. In this sense, it will be necessary to effect of an epistatic QTL can be recognized only as a
small effect, even if its actual gene effect is large.Tanks- investigate epistatic interactions between Hd6 and the other photoperiod-sensitive loci, Hd1 and Hd3 (H. X. ley(1993) has discussed this type of risk, where a
popu-lation size is small. Lin, T. Yamamoto, T. SasakiandM. Yano,unpublished results).
The importance of evaluation of gene action by
QTL-NILs:We have clearly shown that Hd6 shows epistatic We thank Drs. Kouichi Hasegawa and Naoto Nitta for advice and interaction with another photoperiod sensitivity gene, encouragement. We also thank the staff of the Farm Management Division of the National Institute of Agrobiological Resources for their
Hd2 (Figure 5; Table 2). It is generally thought that
support on rice plant cultivation. This work was supported by funds
epistatic interaction should be involved in quantitative
from the Ministry of Agriculture, Forestry, and Fisheries of Japan; the
inheritance. However, because ordinal QTL analyses Japan Racing Association; and the Program for Promotion of Basic were done with populations segregating the whole ge- Research Activities for Innovative Biosciences (PROBRAIN).
nome simultaneously, it has been difficult to detect an interaction in a specific combination of QTL genotypes.
To our knowledge, some researchers have tried to detect LITERATURE CITED
epistatic interactions by using primary populations— Alpert, K. B.,andS. D. Tanksley,1996 High-resolution mapping
and isolation of a yeast artificial chromosome contig containing
fw2.2: a major fruit weight quantitative trait locus in tomato. Proc. Lin, Y. R., K. F. SchertzandA. H. Paterson,1995 Comparative analysis of QTLs affecting plant height and maturity across the Natl. Acad. Sci. USA 93: 15503–15507.
Beavis, W. D., D. Grant, M. Albertsen and R. Fincher, Poaceae, in reference to an interspecific sorghum population. Genetics 141: 391–411.
1991 Quantitative trait loci for plant height in four maize
popu-lations and their associations with qualitative loci. Theor. Appl. Lincoln, S., M. DalyandE. S. Lander,1993 Mapping genes con-trolling quantitative traits with Mapmaker/QTL 1.1, Whitehead Genet. 83: 141–145.
Bernacchi, D.,andS. D. Tanksley,1997 An interspecific backcross Institute Technical Report, Ed. 2, Whitehead Institue, Cam-bridge, MA.
of Lycopersicon esculentum3L. hirsutum: linkage analysis and a QTL
study of sexual compatibility factors and floral traits. Genetics 147: Lu, C., L. Shen, Z. Tan, Y. Xu, P. He et al., 1997 Comparative mapping of QTLs for agronomic traits of rice across environments 861–877.
Causse, M. A., T. M. Fulton, Y. G. Cho, S. N. Ahn, J. Chunwongse using a doubled-haploid population. Theor. Appl. Genet. 94: 145–150.
et al., 1994 Saturated molecular map of the rice genome based
on an interspecific backcross population. Genetics 138: 1251– Nelson, J. C., 1997 QGENE: software for marker-based genomic analysis and breeding. Mol. Breed. 3: 239–245.
1274.
Chase, K., F. R. AdlerandK. G. Lark,1997 Epistat: a computer Paterson, A. H., E. S. Lander, J. D. Hewitt, S. Peterson, S. E. Lincolnet al., 1988 Resolution of quantitative traits into Men-program for identifying and testing interactions between pairs
of quantitative trait loci. Theor. Appl. Genet. 94: 724–730. delian factors by using a complete map of restriction fragment length polymorphisms. Nature 335: 721–726.
De Vicente, M. C., andS. D. Tanksley,1993 QTL analysis of
trans-gressive segregation in an interspecific tomato cross. Genetics Paterson, A. H., Y. R. Lin, Z. Li, K. F. Schertz, J. F. Doebleyet al.,
1995 Convergence of domestication of cereal crops by
indepen-134:585–596.
Doebley, J., A. StecandC. Gustus,1995 Teosinte branched1 and dent mutations at corresponding genetic loci. Science 269: 1714– 1718.
the origin of maize: evidence for epistasis and the evolution of
dominance. Genetics 141: 333–346. SAS Institute,1989 SAS/STAT User’s Guide; Vers. 6, Vol. 2, Ed. 4.
SAS Institute, Cary, NC.
Doi, K., A. YoshimuraandN. Iwata, 1998 RFLP mapping and
QTL analysis of heading date and pollen sterility using backcross Singh, K., T. Ishii, A. Parco, N. Huang, D. S. Braret al., 1996 Cen-tromere mapping and orientation of the molecular linkage map-population between Oryza sativa L. and Oryza glaberrima Steud.
Breed. Sci. 48: 395–399. ping of rice. Proc. Natl. Acad. Sci. USA 93: 6163–6168.
Stuber, C. W., S. E. Lincoln, D. W. Wolff, T. Helentjaris and
Dorweiler, J., A. Stec, J. KermicleandJ. Doebley,1993 Teosinte
glume architecture 1: a genetic locus controlling a key step in maize E. S. Lander, 1992 Identification of genetic factors contributing to heterosis in a hybrid from two elite maize inbred lines using evolution. Science 262: 233–235.
Edwards, M. D., C. W. StuberandJ. F. Wendel,1987 Molecular- molecular markers. Genetics 132: 823–839.
Tanksley, S. D.,1993 Mapping polygenes. Annu. Rev. Genet. 27: marker-facilitated investigations of quantitative trait loci in maize.
I. Numbers, genomic distribution and types of gene action. Genet- 205–233.
Tanksley, S. D., S. Grandillo, T. M. Fulton, D. Zamir, Y. Eshed
ics 116: 113–125.
Eshed, Y.,andD. Zamir,1996 Less-than-additive epistatic interac- et al., 1996 Advanced backcross QTL analysis in a cross between an elite processing line of tomato and its wild relative L. pimpinelli-tion of quantitative trait loci in tomato. Genetics 143: 1807–1817.
Harushima, Y., M. Yano, A. Shomura, M. Sato, T. Shimanoet al., folium. Theor. Appl. Genet. 92: 213–224.
Tinker, N. A.,andD. E. Mather,1995 MQTL: software for simpli-1998 A high-density rice genetic linkage map with 2275 markers
using a single F2population. Genetics 148: 479–494. fied composite interval mapping of QTL in multiple
environ-ments. J. Quant. Trait Loci http://probe.nalusda.gov:8000/
Ichitani, K., Y. OkumotoandT. Tanisaka,1998 Genetic analyses
of low photoperiod sensitivity of rice cultivars from the northern- otherdocs/jqtl/jqtl1995-02/jqtl16r2.html
Xiao, J., J. Li, L. YuanandS. D. Tanksley,1995 Dominance is the most regions of Japan. Plant Breed. 117: 543–547.
Kinoshita, T.,1998 Report of the committee on gene symboliza- major genetic basis of heterosis in rice as revealed by QTL analysis using molecular markers. Genetics 140: 745–754.
tion, nomenclature and linkage groups. II. Linkage mapping
using mutant genes in rice. Rice Genet. Newsl. 15: 13–74. Xiao, J., J. Li, L. YuanandS. D. Tanksley,1996 Identification of QTLs affecting traits of agronomic importance in a recombinant
Kurata, N., Y. Nagamura, K. Yamamoto, Y. Harushima, N. Sueet
al., 1994 A 300 kilobase interval genetic map of rice including inbred population derived from a subspecific rice cross. Theor. Appl. Genet. 92: 230–244.
883 expressed sequences. Nat. Genet. 8: 365–372.
Lander, E. S., P. Green, J. Abrahamson, A. Barlow, M. J. Daley Xiao, J., J. Li, S. Grandillo, S. N. Ahn, L. Yuanet al., 1998 Identifi-cation of trait-improving quantitative trait loci alleles from a wild
et al., 1987 Mapmaker: an interactive computer package for
constructing primary genetic linkage maps of experimental and rice relative, Oryza rufipogon. Genetics 150: 899–909.
Xiong, L. Z., K. D. Liu, X. K. Dai, C. G. XuandQ. Zhang,1999 natural populations. Genomics 1: 174–181.
Lark, K. G., K. Chase, F. Adler, L. M. MansurandJ. H. Orf,1995 Identification of genetic factors controlling domestication-related traits of rice using an F2population of a cross between
Interactions between quantitative trait loci in soybean in which
trait variation at one locus is conditional upon a specific allele Oryza sativa and O. rufipogon. Theor. Appl. Genet. 98: 243–251.
Yamamoto, T., Y. Kuboki, S. Y. Lin, T. SasakiandM. Yano,1998 at another. Proc. Natl. Acad. Sci. USA 92: 4656–4660.
Li, Z., S. R. M. Pinson, J. W. StanselandW. D. Park,1995 Identifi- Fine mapping of quantitative trait loci, Hd-1, Hd-2 and Hd-3, controlling heading date of rice as single Mendelian factors. cation of quantitative trait loci (QTLs) for heading date and plant
height in cultivated rice (Oryza sativa L.). Theor. Appl. Genet. Theor. Appl. Genet. 97: 37–44.
91:374–381. Yano, M.,andT. Sasaki,1997 Genetic and molecular dissection of
Li, Z., S. R. M. Pinson, W. D. Park, A. H. PatersonandJ. W. Stansel, quantitative traits in rice. Plant. Mol. Biol. 35: 145–153. 1997 Epistasis for three grain yield components in rice (Oryza Yano, M., Y. Harushima, Y. Nagamura, N. Kurata, Y. Minobeet al.,
sativa L.). Genetics 145: 453–465. 1997 Identification of quantitative trait loci controlling heading
Lin, H. X., H. R. Qian, J. Y. Zhuang, J. Lu, Z. M. Xionget al., 1995 date of rice using a high-density linkage map. Theor. Appl. Genet. RFLP mapping of major and minor genes for heading date in 95:1025–1032.
rice. Rice Genet. Newsl. 12: 253–255. Yu, S. B., J. X. Li, C. G. Xu, Y. F. Tan, Y. J. Gaoet al., 1997 Importance
Lin, S. Y., T. SasakiandM. Yano,1998 Mapping quantitative trait of epistasis as the genetic basis of heterosis in an elite rice hybrid. loci controlling seed dormancy and heading date in rice, Oryza Proc. Natl. Acad. Sci. USA 94: 9226–9231.
sativa L., using backcross inbred lines. Theor. Appl. Genet. 96: