_____________________________________________________________________________________________________ *Corresponding author: E-mail: [email protected];
(Past name: British Journal of Medicine and Medical Research, Past ISSN: 2231-0614, NLM ID: 101570965)
Computer Technologies in Spectral Analysis of
Uzbek Speech on the Steps of Development of
Speech Audiometry for Children
V. S. H. Khamrayeva
1*, S. A. Khasanov
2and B. Videke
31Department of Pediatric Otorhinolaryngology, Tash PMI, 100140 Tashkent, Yunusabad,
Bogishamol St., 223, Uzbekistan. 2
Department of Pediatric Otorhinolaryngology and Dentistry, Tash PMI, 100140 Tashkent, Yunusabad, Bogishamol str., 223, Uzbekistan. 3Department of Information Technology, Tashkent University of Information Technologies (TUIT),
Uzbekistan.
Authors’ contributions
This work was carried out in collaboration among all authors. All authors read and approved the final manuscript.
Article Information
DOI: 10.9734/JAMMR/2020/v32i530416 Editor(s): (1) Dr. Sinan Ince, University of Afyon Kocatepe, Turkey. Reviewers: (1) Chidi Ugwuoke, Bayero University Kano, Nigeria. (2)Francesco Pepe, University of Naples Federico II, Italy. (3)Vijaya Krishnan, Mahatma Gandhi Mission's College of Engineering and Technology, India. Complete Peer review History:http://www.sdiarticle4.com/review-history/51823
Received 10 August 2019 Accepted 14 October 2019 Published 15 April 2020
ABSTRACT
The presented article is devoted to the stages of development of speech audiometry in the Uzbek language. The capabilities of Praat computer technology made it possible to conduct a frequency-spectral analysis of Uzbek speech, which formed the basis of speech tables and used in assessing the quality of hearing of school-age children with various hearing impairments. Accordance with the spectral analysis there was revealed: The male voice for the given parameters of sound strength was characterized by the main tone within 80-100 Hz, while the female voice when pronouncing the same words and phrases amounted to 160-175 Hz. Consequently, this fact confirmed that the main tone of the Uzbek language is characterized by a lower basic tone than the Romance and Slavic languages. A qualitative assessment of hearing at the children according to developed speech audiometry in the Uzbek language showed that in cases of sensorineural and conductive,
as well as with mixed hearing loss, the influence of the speaker’s gender on speech intelligibility is noted. So, when tested with a male voice, it reaches 100% of the result, but when tested with a female voice in children with III degrees of hearing impairment of 100%, the intelligibility threshold is not observed.
Keywords: Speech audiometry; spectral analysis of speech; hearing loss; phonemes; hearing impairment in children.
1. INTRODUCTION
There is a close connection between the state of hearing and the development of speech and therefore any and even more severe, hearing impairment in the form of hearing loss and deafness in children hav e a great influence on their general and mental development [1].
Over the past 20 years, the frequency of hearing damage has doubled and amounts to 6%; in the structure of hearing loss, sensorineural hearing damage reaches 75-95% [2,3].
Of particular note is hearing impairment in children, both at an early and older age. Because it is precisely in these periods that children develop the formation of individual intellectually significant features necessary for its further socialization and integration into society. Today, modern pediatric audiology is represented by a rich set of audio logical tests of objective audiometry, such as ZVOEE, PIOAE, KSVP, etc [4-6]. However, these widely used methods provide more information purely about the electrophysiological picture of the auditory analyzer, while the level of "natural" or so-called social hearing is not displayed. This explains that in developed countries, when determining the quality of a child’s hearing speech audiometry remains t he most relevant a n d informative, which i s improved and modified every year.
Moreover, the developed speech tables are widely used in assessing the quality of hearing prosthetics and in free sound field audiometry for children after cochlear implantation.
The effectiveness of the use of speech tests largely depends on their quality selection. Studies of the leading experts in the field of phonetics have found that the main parameters of the speech signal depend not only on age but also on the gender of the person [6,7]. It is undeniable that the main parameters of a speech signal are determined by a person’s belonging to a particular language group.
To obtain accurate quantitative indicators of intelligibility, special tests are used - phonetically balanced word tables. Unlike conventional tones, speech signals have a more complex structure. They have a multicomponent structure, the absence of at least one of them in the signal or its incorrect perception will certainly lead to distortions or a complete failure in the process of recognizing speech information [8].
Currently, various types of articulation tables have been proposed for speech audiometry: Syllabic (composed of sounds without meaning), verbal and phrasal.
In particular, the first domestic research on the development of articulation tables in the The Uzbek language was carried out in 1952 by Agzamov S.K., who developed and introduced into the practical work of the otolaryngologist a method for hearing research using whispering and speaking in the Uzbek language. The author, as a method of spectral analysis, used x-ray monitoring of the state of the elements of the tongue about certain areas of the hard and lower palate. But the developed speech tables were based on the subjective method and were aimed mainly at the adult continent. The era of computer technology today allows for more accurate, specific and objective spectral analysis of speech. Thus, speech tests for speech audiometry are developed in English, Russian, German, Finnish, Swedish, French, Italian, Georgian, Turkmen and some other languages. This approach is quite logical since it affects the quality, information content and value of the method [9-11]. Therefore, in speech audiometry for each language group, its speech tests should be applied, which would fully take into account the peculiarities of national speech.
harmony, characteristic of most Turkic languages, lies in the fact that a word can contain either only vowels of the front row or only vowels of the back row. In modern Uzbek, the common Turkic vowels o and ö correspond to the same sound “o”, in spelling - ў (Cyrillic) or oʻ (Latin); u and ü - like Russian. "Y"; ı and i - as Russian. "and". Thus, the Uzbek language is distinguished by several features, of which, first of all, the richness of the consonant system in comparison with the vowels should be noted. Despite the similarities with the Russian alphabet, the phoneme of the Uzbek language, there are several phonemes absent in the Russian language [12,13].
The purpose of the study: to modify speech audiometry for children in the Uzbek language based on a spectral-frequency analysis of Uzbek speech and to assess the quality of hearing in various forms and degrees of hearing loss.
2. MATERIALS AND METHODS
Based on TashPMI, in collaboration with the TUIT Institute, for the analysis and research of speech signals, studio audio recordings of speech signals in an extended frequency range that wa s not compressed by any encoders were used. The studies were conducted using
audio recordings by speakers of various sexes and age of speech signals in the Uzbek language. For control, similar records were used in Romance, Slavic languages. For the analysis of speech audio signals, the Praat program developed at the Institute of Phonetic Sciences of the University of Amsterdam was used. This program is constantly being updated by its authors, Paul Bersma (Paul Boersma) and David Wenick (David Weenink). Even though it is mainly used in practice for phonetic research, this program includes excellent tools for visualizing the parameters of a speech audio signal with the output of their values in terms of the time it takes, which allows you to use it for in-depth analysis of speech signals.
The program in general consists of three modules (Fig. 1). The control module allows you to start recording audio signals (New) using the built-in audio recorder (Fig. 2), play (Play), download (Read) and manipulate (Edit) the studied audio files, which are then visually displayed in the corresponding analyzer module.
Two types of audio signals, short audio signals (Sound) and long audio recordings (Long Sound) can be loaded into the program. Both are loaded in uncompressed “WAV” format. Standard file operations will also be performed here.
The words were recorded on a disk in the television and radio company of the Republic of Uzbekistan in male and female voices (announcers - Yusupov Shokir, Murodova Muslim). (Contract number No. 49 \ K).
3. RESULTS AND DISCUSSION
Analysis of speech signals according to the structure of speech elements revealed some features depending on the language. vocals (a, e, i, o and, y, a, b, ti) are characterized by pronounced formants of all levels with sound
amplification within the frequency ranges due to resonance; consonant consonants (j, 1, m, n, g, v, w) are presented in the form of harmonious sounds at the level of the fundamental frequency; effervescent sounds (c, s, sch, x, z) and dissonant consonants (f, s, l) are high-frequency sounds, and are often identified only as noises; loud sounds (h, d) are poorly identified due to low sound strength and high frequency; pulsed sounds (p, b, t, d, k, g) are characterized by high sound power and low frequency.
Of particular importance in the identification of speech, signals are the values of formants and their location in the general frequency range. Formants are understood as frequency ranges in which phonemes cause a particularly pronounced signal amplification. Therefore, formants are clearly expressed by extreme values in the complex spectrum of a speech signal (Fig. 1) format 4 t drop the format »cho level% format 2 level main frequency formant level 1.
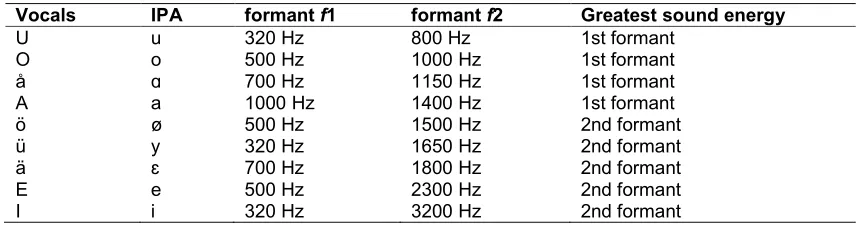
So, already by the formants of the first (/}) and second (f2) level, all phonemes can be distinguished from each other. Even though the linguistic affiliation, gender and age of the speaker, loudness of pronunciation, the location of phonemes in syllables and words, places of stress and several other circumstances, for example, in Romance languages such as German, the following average indicators can be distinguished (Table 1).
As a comparison, Slavic speech, for example, Russian, can be used (Table 2).
Fig. 1. The analysis of the speech signal
Table 1. Averaged indicators of formants for German speech
Vocals IPA formant f1 formant f2 Greatest sound energy
U u 320 Hz 800 Hz 1st formant
O o 500 Hz 1000 Hz 1st formant
å ɑ 700 Hz 1150 Hz 1st formant
A a 1000 Hz 1400 Hz 1st formant
ö ø 500 Hz 1500 Hz 2nd formant
ü y 320 Hz 1650 Hz 2nd formant
ä ɛ 700 Hz 1800 Hz 2nd formant
E e 500 Hz 2300 Hz 2nd formant
Table 2. Averaged indicators of formants for Russian speech
Vocals IPA Formant Formant f2 Greatest sound energy
i I 300 Hz 600 Hz 2nd formant
O О 500 Hz 900 Hz 2nd formant
А А 700 Hz 1500 Hz 2nd formant
U Y 400 Hz 1700 Hz 2nd formant
Е Е 350 Hz 2300 Hz 2nd formant
I I 300 Hz 2800 Hz 2nd formant
Table 3. Averaged indicators of formants for Uzbek speech
Vocals IPA Formant Formant А Greatest sound energy
I I 190 Hz 600 Hz 2nd formant
О О 300 Hz 900 Hz 2nd formant
А А 700 Hz 1400 Hz 2nd formant
И Y 300 Hz 1300 Hz 2nd formant
Е Е 300 Hz 2100 Hz 2nd formant
I I 300 Hz 2200 Hz 2nd formant
For Uzbek speech, the following averaged indicators of speech formants are identified.
With certain words and phrases, also, it was revealed that the frequency range of the first formant is located below the frequency of the main background. This circumstance in the Romance and Slavic languages occurs, as a rule, only when singing sopranos.
The decrease in the basic tone in the Uzbek language was also accompanied by similar decreases in the frequency ranges according to formants. If, when pronouncing vocal “a” in Romance languages, the first formant averaged 1000 Hz, then in Uzbek speech it ranged from 700-800 Hz depending on the degree of stress. According to the second formant, no significant differences between speakers of different language affiliation were found. However, such discrepancies were not revealed in other vocals: for example, with vocals “o”, full correspondence was recorded for all the studied language groups. The specific sounds “y” and “I” in terms of parameters corresponded to the umlauts of the German speech “y” and “a”, while the umlaut “b”, due to its phonetic features, has no analogues.
It is believed that the formants of the third (s) and fourth (s) level are insignificant for the perception of speech itself. They characterize the speaker’s speech anatomy to a greater extent, his features of articulation, as well as the timbre of his speech and can vary greatly depending on the speaker. They are an important factor, however, when identifying the speaker’s personality directly, for
example, in forensic science or biometric devices.
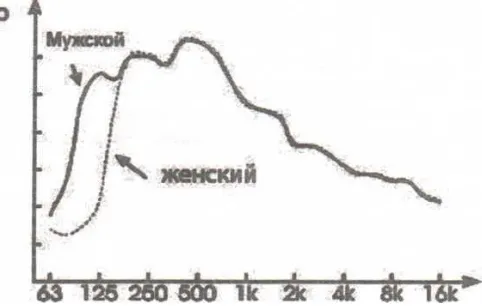
For speech recognition and speaker identification, the main tone of speech, the width of the frequency band and the frequency spectrum also play a role. The main tone of the male voice averages about 130 Hz, the female voice averages 240 Hz. In the speech signal, however, a significant deviation of the male voice is observed only in the frequency range from 60 to 250 Hz. (Fig. 2).
In the course of the spectral analysis, the following indicators were revealed: The male voice with the given parameters of sound strength was characterized by the main tone within 80-100 Hz, while the female voice when pronouncing the same words and phrases was 160-175 Hz.
The main tone of the Uzbek language, thus, is characterized by a lower main tone than the Romance and Slavic languages (Table 4).
The first formant was recorded in the frequency range 900 - 1600 Hz, the second formant in the range 1300 - 3200 Hz, the third in the range 3000 - 4700 Hz, and the fourth in the frequency range 4500 - 5100 Hz. At the same time, hissing sounds are characterized by such a feature that all formants are in harmonic oscillation during the sounding of a speech signal. For all other categories of speech signals for all four formants, various combinations of increasing, decreasing, and almost constant frequency changes were recorded during the sound of the signal. Moreover, in the course of studies, it was revealed that the frequency structure and combinations of formant changes were fundamentally the same for the speakers of both men and women (Table 5).
An analysis of the formants showed that according to the formants of the third and fourth levels, which are usually designated in the literature as an element characterizing the speaker’s personality significant differences were recorded between the signals of all the speakers.
The formant of the second level, together with the formant of the first level, was characterized by the greatest dynamic values depending on the age and gender of the announcer in Uzbek speech.
A special role in Uzbek speech is played by the intensity of sound, a variation of which in speech puts the appropriate emphasis on the pronunciation of speech signals. The studied
Fig. 2. The frequency spectrum of the speech signal depending on the floor of the speaker
Table 4. Frequency of male and female voice in a different language
Language Male voice, Hz Female voice, Hz
Romance 110-130 220-240
Slavik 90-110 180-210
Uzbek 80-100 160-175
Speaker 1: Speaker 2:
61
Table 5. Analysis of formants and the main tone of the speech signal among speakers of different sexes
Speakers F1 F2 F3 F4 F0 I, dB
Male 2159,5±92,38 5660,1±141,18 9428,13±106,2 12407,0±114,85 507,1±94,29 70,56±0,45
Female 2740,12±119,36*** 6842,0±141,98** 10382±98,93** 13447,5±94,1** 1861,4±201,41*** 73,3±0,39***
speech signals were recorded in an adapted voice. The emphasis is expressed by changes in sound intensity in the range from 35 to 90 dB. The results of the analysis of Uzbek speech at the same time show that, regardless of the age and gender of the speaker, the factor components of speech signals are constructed completely identically (Fig. 3).
When studying the acoustic characteristics of vowels and consonants, a high and low tonal- frequency characteristic of each sound individually and a change in these characteristics in the composition of the word, to pronunciation by various speakers with different dictations, which we took into account when compiling the speech tables, as the sound composition of the language, are established is of great importance for his auditory perception.
Without taking into account the speed of speech, which, accordingly, to speaker 1, led to some stretching or compression of the histogram along the time axis, graphic visualization, as well as fixed numerical values of the parameters, show that the same speech signal is characterized by the same construction and behaviour of the components of the speech signal.
This circumstance confirms the earlier assumption that for the identification and recognition of speech signals, it is in principle possible to use audio files of both male and female voices. At the same time, all parameters are not a fixed value, but all values vary in the context of the time of sounding of the speech signal, which allows us to conclude that with certain deviations any speech signal, regardless of the specific speaker, has some figurative, unique character.
In general, in the course of the research, it was concluded that both speech perception and recognition of speech signals require a differentiated approach, taking into account the peculiarities of their language affiliation.
It is known that the results of speech audiometry are largely determined by whether monosyllabic and polysyllabic words are used as test verbal signals. This factor is associated with the level of mental development, education and other characteristics of the subjects. In this regard, it is not equally manifested about adults and children.
Also, it has a different severity with different age groups. We also took this into account when compiling speech tables.
Thus, taking into account all the above, we have compiled speech tables for children from 6 to 15 years old according to the following criteria:
Speech tests contain the maximum number of phonemes, one-two-syllable words, phrases and numerals. Audio files are recorded by the voices of speakers of various sexes.
Words correspond to the age of children and the level of the vocabulary of communication and are easily perceived;
To reduce the time of hearing testing in children from 6-11 years old, 3 groups from;
10 groups of 6 verbal tests were selected, for children from 12-15 years old - 3 groups consisted of 10 verbal and numeral tests.
To exclude adaptation of speech tests, a variation of speech tests was conducted.
The table for children from b to 11 years old consisted of 12 monosyllabic words and 12 two-syllable words, also of 24 phrases and 12 numerals (Table 6).
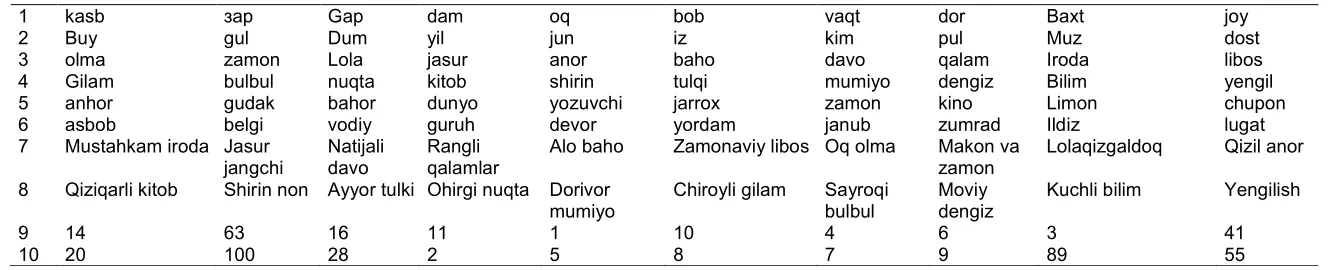
The table for children from 12 to 15 years old consists of 20 monosyllabics, 40 two-syllable, 20 phrases and 20 numerators (Table 7).
As a result of preliminary testing of the proposed tests in the corresponding age group of children with normal hearing, the acoustic equivalence of individual groups of words was achieved. The age norms of perception and intelligibility of sounds of Uzbek speech are established with increasing intensity of speech signals in school-aged children with normal hearing.
Before each study, we set the control level of the audiometer per tone of 1000 Hz. We have identified the main intelligibility thresholds - the initial threshold for speech perception (hearing threshold), 50% and 100% speech intelligibility threshold.
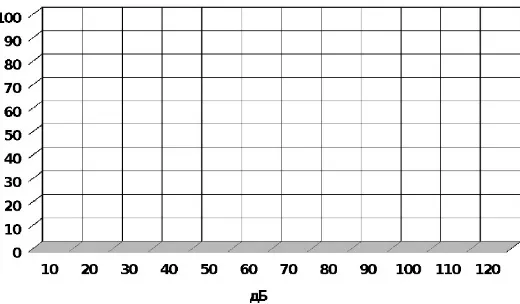
The obtained data in average values were recorded on speech audiograms in the form of speech intelligibility curves. The speech audiogram indicates signal intensity along the horizontal axis (in decibels) and speech intelligibility (in per cent) along the vertical axis.
speech intelligibility thresholds of the above detectable levels in 20 children from 6 to 11 years old (20 children) and in 20 - from 12 to 15 years old, then we analyzed all these indicators in 107 children with hearing impairment (Table 8).
The perception of speech at a distance in children in the control group corresponded to the normative values of hearing research, so in a whispering speech, the distance averaged 5.85 ± 0.1 m. and in a conversation - 6.1 ± 0.1 m. Tonal threshold audiometry for air conduction in the average was 6.0 ± 0.4 Hz.
As the data show, the threshold of speech intelligibility in healthy children was achieved in 100% of cases. The auditory threshold for a male voice averaged 10.7 ± 0.6 dB, for a female - 10.5 ± 0.48 dB. The 50% intelligibility threshold in children in the control group was 20.8 ± 0.64, and 23.5 ± 0.75 dB, respectively. At a 100% intelligibility threshold in children of the control group, the average values were 31 ± 0.7 dB for a male voice and 31.1 ± 0.65 dB for a female voice.
But still, I want to note that despite the homogeneity of the obtained data of speech intelligibility with male and female voices, most children noted discomfort or difficulty in perceiving the proposed words, voiced by the announcer of the female gender.
Thus, as a result of preliminary testing of the proposed speech tests for the corresponding age group of children with normal hearing, the acoustic equivalence of individual groups of words was achieved and the age norms of perception and intelligibility of speech sounds were established.
The data of the averaged intensity values of different threshold levels of speech intelligibility in children with normal hearing did not fundamentally differ from those in the study of hearing in Russian in Russian-speaking children of a similar age.
The results obtained in the study of speech intelligibility in children with sensorineural hearing loss are shown in Table 9.
From the obtained data it is seen that the sensitivity threshold in children aged 6-11 years with sensorineural hearing loss, depending on the male and female voices, has a slight difference in intensity at all degrees of hearing impairment.
An insignificant effect of male and female voices on a 50% intelligibility threshold in children with sensorineural hearing loss of I and II degree (45.3 ± 3.6 and 52.5 ± 4.2 dB and 61.0 ± 2.7 against 68, is also recorded, 8 ± 3.6 dB, respectively), while with grade III a significant
difference is noticeable: for male voice 73.3 ± 2.3, CB, for female 85.0 ± 2.4 dB (P <0.01).
In children with sensorineural hearing loss of I and II degree, there is also an unreliable effect of male and female voices on 100% intelligibility threshold (56.9 ± 4.5 and 65.6 ± 4.8 dB and 78.0 ± 4.7 against 81, 0 ± 2.3 dB, respectively). The intensity of the 100% intelligibility threshold in children with a third-degree of sensorineural hearing loss is significantly affected by the gender of the announcer, so if with a male voice it was 86.7 ± 2.6 dB, then with a female voice, 100% of the intelligibility threshold was not reached (p <0.001).
Table 6. Speech table for children from 6 to 11 years old
1 ari oq raqs vaqt lab Qor
2 gul dum yil ip kuch Non
3 archa varraq chana laylak tramvay baliq
4 bulut ormon qulqop kitob gilam yengil
5 Ari
uyasi Oq kema Milli raqs Oppoq qor Lab buyog“i Kechki vaqt
6 Atir
gul Uzun dum Birinchi yil Kok ip Shirin non Kuchli shamol
7 Archa
bayrami Varrak uchirmoq Kuldagi laylak Chana uchmoq Tramvay bekati Ilon baliq 8 Bulutli
osmon Qurqinchli urmon Charim qulqop Alifbe kitobi Chiroyli gilam Yengil misol
9 6 8 63 48 90 82
64
Table 7. The table for children from 12 to 15 years old consists of 20 monosyllables, 40 two- syllables, 20 phrases and 20 numerators
1 kasb зар Gap dam oq bob vaqt dor Baxt joy
2 Buy gul Dum yil jun iz kim pul Muz dost
3 olma zamon Lola jasur anor baho davo qalam Iroda libos
4 Gilam bulbul nuqta kitob shirin tulqi mumiyo dengiz Bilim yengil
5 anhor gudak bahor dunyo yozuvchi jarrox zamon kino Limon chupon
6 asbob belgi vodiy guruh devor yordam janub zumrad Ildiz lugat
7 Mustahkam iroda Jasur jangchi
Natijali davo
Rangli qalamlar
Alo baho Zamonaviy libos Oq olma Makon va zamon
Lolaqizgaldoq Qizil anor
8 Qiziqarli kitob Shirin non Ayyor tulki Ohirgi nuqta Dorivor mumiyo
Chiroyli gilam Sayroqi bulbul
Moviy dengiz
Kuchli bilim Yengilish
9 14 63 16 11 1 10 4 6 3 41
Table 8. Table of speech intelligibility thresholds in children
Speech recognition thresholds Control group
Male voice Female voice 6-11 aged children
Sensitivity threshold 10,9*0,64 10,5*0,48
50% intelligibility threshold 20,9±0,64 25,4±0,47
100% Legibility threshold 30,9±0,64 31,1±0,64
12-15 aged children
intelligibility threshold 10,6±0,58 10,6±0,58
50%Legibility threshold 20,6±0,59 21,6±0,9
100%Legibility threshold 31,1±0,8 31,11±0,7
Table 9. Comparison of the degree of hearing impairment with speech intelligibility in children with sensorineural hearing loss
Speech recognition thresholds
Hearing impairment
I degree II degree III degree Male
voice
Female voice
Male voice
Female voice
Male voice
Female voice 6-11 years old children
Sensitivity threshold
32,2±2,8 33,1±3,5 43,3±2,1 45,8±2,9 57,5±3,9 62,5±5,6
50% legibility threshold
45,3±3,6 52,5±4D 61,0±2,7 68,8±3,6 73,3±2,3 85,0±2,4**
100% legibility threshold
56,9±4,5 65,6±4,8 78,0±4,7 81,0±2,3 86,7±2,6
12-15 years old children
Sensitivity threshold
35,0±3,5 36,0±2,7 42,5±1,9 48,7±2,9 64,3±2,5 67,5±2,7
50% legibility threshold
51,0±5,4 59,0±6,2 56,6±3,5 69,1±2,5** 82,8±2,2 91,0±1,6**
100% legibility threshold
68,0±б,5 78,0±6,5 ОО СО Ey
88,8±2,3** 86,7±1,6
note: * - reliability of data between male and female voices (** - P <0.01)
Table 10. Comparison of the degree of hearing impairment with speech intelligibility in children with conductive hearing loss
Speech understanding threshold Hearing impairment
I degree II degree
Male voice Female voice Male voice Female voice 6-11 years old children
Sensitivity threshold 27,1±1,4 28,5±1,7 42,0±1,4 44,9±0,1*
50% Understanding Threshold 40,0±1,5 44,2±2,4 60,0±1,1 68,0±2,2** 100% Understanding Threshold 54,8±2,4 58,8±2,3 74,Oil,1 84,0±1,1***
12-15 years old children
Sensitivity threshold 31,2±2,0 31,5±1,9 44,5±4,8 45,0±4,3
50% Understanding Threshold 43,3±2,7 47,0±2,4 58,5±5,9 63,0±6,5
100% Understanding Threshold 56,5±2,5 60,3±2,3 70,5±3,5 81,0±3,7*
Note; * - reliability of data between male and female voices (* - P <0.05; ** - P <0.01; *** - P <0.001)
Analysis of the threshold sensitivity in children aged 12-15 years with sensorineural hearing loss
Table 11. Comparison of the degree of hearing impairment with speech intelligibility in children with mixed hearing loss
Legibility threshold of speech
Hearing impairment
I degree II degree III degree Male voice Female voice Male voice Female voice Male voice Female voice Sensitivity threshold
32,5± 3,1 34,5±4,8 43,3±1,3 44,3±!,3 59,0±1,1 60,0±1,7
50% legibility threshold
44,0± V 53,5±5,4 56,5±1,6 63,7±1,9** 77,0±3,7 83,0±5,5
100% legibility threshold
62,5± 5,3 69,0±5,4 70,8±2,4 82,3±2,3** 90,0±2,5 -
Note: * - the reliability of the data between male and female voices (** - P <0.01)
Whereas when analyzing the intelligibility threshold, the influence of the speaker’s gender on the intensity of indicators was noticeable both at the threshold of 50% intelligibility and at 100%, the reliability of indicators, unlike children in the younger age group, was recorded already at the II degree of sensorineural hearing loss and amounted to: 56.6 ± 3.5 dB in the male voice versus 69.1 ± 2.5 dB in the female voice (p <0.01) and 75.6 ± 3.8 dB against 88.8 ± 2.3 dB, respectively.
A particularly pronounced effect of the male voice over the female is recorded in children with a third-degree of sensorineural hearing loss: 82.8 ± 2.2 dB, respectively, against 91.0 ± 1.6 dB (p<0.001) at a 50% intelligibility threshold and 86.7 ± 1, 6 dB at a 100% threshold for intelligibility, given that these children did not achieve this threshold for intelligibility with a female voice. The data obtained are also confirmed by analyzing the quantitative ratio of children with sensorineural hearing loss reaching 50% and 100% of the sensitivity threshold depending on the gender of the speaker. So, at the age of 6-11 years, a 50% threshold of intelligibility was found in 100% of children, when tested with both male and female voices, regardless of the degree of hearing damage.
In all children (100%) with I and II degree of sensorineural hearing loss at the age of 12-15 years, achievement of 50% of the threshold of intelligibility is also recorded regardless of the gender of the announcer, while in children with III degrees of hearing impairment, this indicator was 100% when examining with a male voice and for women 71.4%.
When studying the achievement of a 100% intelligibility threshold in children aged 6-11 years, the influence of the speaker’s gender was
found. So, when tested in a male voice, this indicator was 50%, and in a female child, legibility was not achieved in any child. In children aged 12-15 years, the influence of the speaker’s gender was already noticeable in the II degree of hearing impairment, so with a male voice this figure was 100% and for a female - 75%. With III degrees, with a male voice, it amounted to 21.4% and women's intelligibility was not achieved.
Thus, in the analysis of speech intelligibility, we revealed the influence of the speaker’s gender on the 50% and 100% intelligibility threshold, both on qualitative and quantitative indicators, regardless of the age of the child with sensorineural hearing loss with varying degrees of hearing impairment. Given the foregoing, there is a tendency for a child to perceive a male voice better than a female one.
Hearing studies in children with sensorineural hearing loss have shown that in patients of this category, the difference ratio between individual threshold levels and the range of speech intelligibility increases. Often 100% intelligibility is absent. This means that in these patients, in addition to speech perception, the intelligibility of speech sounds is disturbed. The curves of speech intelligibility, in this case, have a different shape. So, if the averaged threshold of perception for pure tones in air and bone conduction in the speech zone does not exceed 40 dB, then 100% speech intelligibility is achieved, which was observed in children with grade I sensorineural hearing loss. Moreover, the shape of the curve for increasing speech intelligibility has a slightly flat form (Fig. 4).
absence of FUNG, intelligibility is broken, but 100% intelligibility is usually achieved at high levels of speech signal intensity (90-100 dB), which is typical for P degree of hearing the loss in children. The shape of the curve of intelligibility increases in this case to a gentle form (Fig. 5).
With an increase in the perception threshold for pure tones during bone and air conduction in the speech zone above 50 dB, the intelligibility
growth curve has a gentle shape, often there is no 100% speech intelligibility, despite the increase in the intensity of speech sounds to large numbers (90-100 dB), which occurs in children with a third-degree of hearing loss (Fig. 6).
When analyzing intelligibility curves depending on the speaker’s gender, it can be seen that with a female voice the curve has a more gentle appearance.
Fig. 4. The shape of the curve of increasing speech intelligibility in children with sensorineural hearing loss of I degree
Fig. 6. The curve shape of speech intelligibility in children with sensorineural hearing loss, grade III
Fig. 7. The shape of the curve of increasing speech intelligibility in children with conductive hearing loss of I degree
The data obtained with speech intelligibility in children with conductive hearing loss are shown in Table 10.
As can be seen from the table, speech intelligibility in children with conductive hearing loss in a gender speaker has a significant effect, which is especially pronounced in children with a second degree, both aged 6-11 years and 12-15 years.
Auditory function in children with conductive hearing loss was investigated with increasing order of changes in the intensity of speech signals. The study revealed a predominant lesion of the sound-conducting apparatus, while the difference between the individual threshold levels did not differ from those in normal-hearing children. Therefore, the curve of increasing speech intelligibility in them takes the same shape and direction. The only difference is that the curve of increasing speech intelligibility in children with a predominant lesion of the sound-conducting apparatus is shifted along the abscess axis to the right compared to the norm by the average value of tonal hearing loss in dB in the area of speech frequencies. This shows that when a sound- conducting apparatus is damaged, as in normal, the mechanism of speech intelligibility is not violated. When analyzing intelligibility curves depending on the speaker’s gender, it can be seen that with a female voice the curve has a more gentle form. Only the perception of sounds is disturbed, which in this category of children was more marked with the female voice of the speaker (Fig. 7).
A study of the data showed that, like in children with sensorineural and conductive hearing loss, when mixed, the speaker’s gender affects speech intelligibility, so when tested with a male voice, it reaches 100% of the result, while a female in children with II degree of hearing impairment 100% the threshold of intelligibility is not observed.
A comparative analysis of the indicators of tonal and speech audiometry in normal and with various forms of hearing the loss in children allows us to make the following conclusion; The value of the auditory threshold is often equated to the average value of tonal audiometry in the area of speech frequencies, less often it exceeds it by 5-10 dB, regardless of the form of hearing loss.
A mixed form of hearing loss was found mainly in children with chronic purulent otitis media (13;
65%). In speech audiometry, in this category of children, along with a violation of perception, various degrees of speech intelligibility were found. Therefore, the curve of increasing speech intelligibility, depending on the gender of the speaker, took on a slightly flat form (Fig. 8.).
4. CONCLUSION
Thus, studies of speech intelligibility using the speech tests we have developed in the Uzbek language in children with normal hearing and with various forms of hearing loss provide information on speech intelligibility as components of a qualitative hearing characteristic in a child.
CONSENT
It is not applicable.
ETHICAL APPROVAL
As per international standard or university standard written ethical permission has been collected and preserved by the author(s).
COMPETING INTERESTS
Authors have declared that no competing interests exist.
REFERENCES
1. Volodin NN, Medvedev MI, Rogatkin SO. Actual problems of modern perinatal neurology. Zhurnal nevrologii i psikhiatrii imeni SS Korsakova. 2001;101(7):4. 2. Tavartkiladze AG, Simoniia GV, Kolbaia
DT, Shalashvili AG, Petriashvili TG. Biochemical, pharmacological and clinical aspects of influencing methioninc, tryptophan, pyridoxine (vitamin B6), Ca2+ and high-calorie food on the synthesis and intensity of the secretion of melatonin. Georgian Medical News. 2006;132:121-123.
3. McArdle RA, Wilson RH. Homogeneity of the 18 QuickSIN™ lists. Journal of the American Academy of Audiology. 2006;17(3):157-167.
5. Korotkov YUV. Recheviyetechnologii v audiologicheskoypraktike [The speech technology in audiological practice], Aftoref,. Na soisk…k and. med. Nauk. 2008;35.
6. Anweiler AK, Verhey J. Spectral loudness summation for short and long signals as a function of level. - J. Acoust. Soc. Am. 2006;119:2919-2928.
7. Carstensen (Ed.) Computerlinguistik und Sprachtechnologie, Eine Einfiihnmg, Heidelberg, Berlin: Spektmm; 2001. 8. Kollmeier B, Brand Т, Meyer B. Perception
of speech and sound. Handbook of Speech Processing, Springer, Berlin. 2008;61-82.
9. Lori Lame, Jean-Luc Gauvin. Speech recognition. In: Mitkov, R. (Hrsg.) The Oxford Handbook of Computational Linguistics, Oxford: University Press; 2003. 10. Mafra NV, Ribas A, Moretti C, Zeigelboim BS, Fonseca VR, Borburema RM.
Comparing individuals through the speech recognition test applied to regional live voice and recorded speeches from Paraná State in Five Brazilian Counties. Int Arch Otorhinolaryngol. 2019;23(3):e256-e261. DOI: 10.1055/s-0038-1668127
[Epub: 2018 Oct 24] [PMID: 31360243]
11. Nissen SL, Harris RW, Jennings LJ, Eggett DL, Buck H. Psychometrically equivalent Mandarin bisyllabic speech discrimination materials spoken by male and female talkers. Int J Audiol. 2005;44(7):379-90. 12. Panday S, Kathard H, Pillay M, Wilson
WS. The internal and external consistency of a speech reception threshold test for isiZulu speakers with normal hearing sensitivity. Afr J Commun Disord. 2018;65(1):e1-e8.
13. Wiedeke B, Payasov M, Hamrayeva W. Untersuchung usbekischer Sprachsignale im erweiterten. DAGA. 2011;283.
_________________________________________________________________________________
© 2020 Khamrayeva et al.; This is an Open Access article distributed under the terms of the Creative Commons Attribution License (http://creativecommons.org/licenses/by/4.0), which permits unrestricted use, distribution, and reproduction in any medium, provided the original work is properly cited.
Peer-review history: