Evaluation of Main Causes of Consumers’
Dissatisfaction with Electric Power Supply in
Nigeria using Fault Tree Analysis: a case
study of Asaba 33kV Feeder
Obi Patrick 1, Nwabueze Christopher 2, Iloh John Paul 3, Benjamin Ezekiel 4
Senior Lecturer, Dept. of Electrical/Electronic Engineering, Chukwuemeka Odumegwu Ojukwu University, Uli,
Nigeria1, 2
Lecturer, Dept. of Electrical/Electronic Engineering, Chukwuemeka Odumegwu Ojukwu University, Uli, Nigeria3
P.G. Student, Dept. of Electrical/Electronic Engineering, Chukwuemeka Odumegwu Ojukwu University, Uli, Nigeria4
ABSTRACT: Electricity networks are, and will continue to be a critical part of Nigeria’s energy infrastructure with the assurance of consistent maintenance. It therefore becomes necessary to evaluate the causes of electric power consumers’ dissatisfaction using Asaba 33kV feeder as a case study. The objective of this project is to evaluate and develop a framework for reliability analysis of Asaba 33kV feeder using Fault Tree Analysis (FTA) employing OpenFTA software. Data used were collected from daily fault logbook of Benin Electricity Distribution Company Asaba Business District for a period of five years, as well as from the Regulatory Agency. The OpenFTA simulation results show the number of primary fault events deduced to be twenty-four however, only four of these twenty-four primary fault events account for over 80% of the total network failures (Consumers’ Dissatisfaction). The validity of the results indicates the appropriateness of FTA on electricity distribution networks..
KEYWORDS:Consumers’ dissatisfaction, OpenFTA, Reliability, Maintenance and Fault tree
I. INTRODUCTION
As the fulcrum of sustainable socio-economic growth and development, the power sector is a critical element in the progress of modern societies [1]. Energy is a vital factor that affects virtually all facets of human endeavour. A range of human activities depends largely on access to energy such as in Manufacturing, Agriculture, Computing, Transportation, Communication, Health, Construction, Domestic and Social services. Amongst different forms of energy, electrical energy is sometimes considered the most useful form of energy because of easy of conversion.
In order to meet electrical energy demand of Nigeria, the Federal Government of Nigeria had in the past years launched many intervention funds for the development of the Electric Power Sector. In Asaba in particular, efforts to improve power supply was intensified by the building of an intelligent step-down substation at Ibusa [5]. However, the electricity supply situation has continued to deteriorate as a result of the inability to evaluate and plan proper distribution network solution.
The area under study is Asaba which is the capital of oil rich Delta State of Nigeria and is strategically located on a hill at the western edge of the majestic River Niger. Asaba forms a connector between western, eastern and northern Nigeria through the River Niger from the north and via the Asaba Niger Bridge, an east west link and a Nigeria landmark. Asaba lies approximately 6 degrees north of the equator and about the same distance east of the meridian [6].
II. OVERVIEW OF RELIABILITY AND AVAILABILITY OF ELECTRIC SUPPLY
A part of the roles of the Distribution Companies is to Provide connection and deliver electric Energy to the Users in accordance with applicable Laws, its licence and the Distribution Code in accordance with the technical and safety parameters specified in NERC’s Distribution Code and other industry regulations [7], at a level of service quality consistent with the applicable Standards of Performance Code [8].
The nominal Frequency of the Nigeria power system shall be 50Hz. The National Control Centre will endeavour to control the System Frequency within a narrow operating band of +/- 0.5% from 50Hz (49.75 – 50.25 Hz), but under System Stress the Frequency on the Power System could experience variations within the limits of 50 Hz +/- 2.5% (48.75 – 51.25 Hz) [9]. All equipment and apparatus connected directly or indirectly to the National Grid must operate at 50Hz frequency mode. Under extreme system fault conditions all Generating Units are permitted to disconnect unless otherwise agreed in writing with the System Operator.
The System Operator shall endeavour to control the different bus bar voltages to be within the Voltage Control ranges with basic specified tolerance of ±5% of rated voltage. Any supply quality level outside of the boundaries with tolerable range, results in Consumers’ Dissatisfaction.
A. Abnormal Supply Conditions
There are four basic conditions at which Consumers’ Dissatisfaction occur, namely:
Outage: This is the condition where the feeder is de-energized. Consumers seek for alternative power source, otherwise, they are forced to suspend their operations.
Loss of Phase (lofph): This is the condition where one or two phase(s) is de-energized in a 3-phase distribution system.
High Voltage (xhv): This is the condition where the distribution voltage is above the normal operating voltage boundary, i.e. above 34.65kV for 33kV.
Low Voltage (xlv): This is the condition where the distribution voltage level is below the normal operating boundary i.e. below 31kV for 33kV.
B. Overview of Fault Tree Analysis (FTA)
The deductive analysis begins with a general conclusion, then attempts to determine the specific causes of the conclusion by constructing a logic diagram called a fault tree. This is also known as taking a top-down approach [12].
The main purpose of the fault tree analysis is to help identify potential causes of system failures before the failures actually occur. FTA is in use in the Aerospace, Medical and Nuclear sectors, however in this work, FTA is applied to Electricity Distribution Network Analysis using OpenFTA Software for simulation. The validity of the results indicates the appropriateness of FTA on electricity distribution networks.
C. Overview of OpenFTA Software
OpenFTA is an advanced tool for fault tree analysis (Formal Software Construction Limited 2005). It has an intuitive front-end which allows the user to construct, modify or analyze fault trees [13]. OpenFTA has been designed to gain wide international acceptance for fault tree analysis, particularly in the aerospace, nuclear, medical equipment and defense fields [14]
III. COLLATIONOFDATA
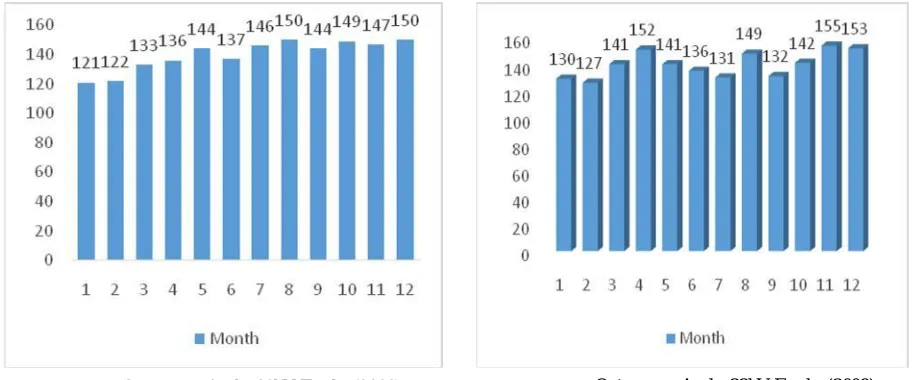
The data collected from the Utility Company’s logbooks were not readily understandable. Hence, the data were collated and represented in bar charts to enable quantitative analysis.
Figures 1 and 2 show charts for the number of outages on Asaba 33kV Feeder recorded on daily basis from January to December for the years 2008 and 2009 respectively.
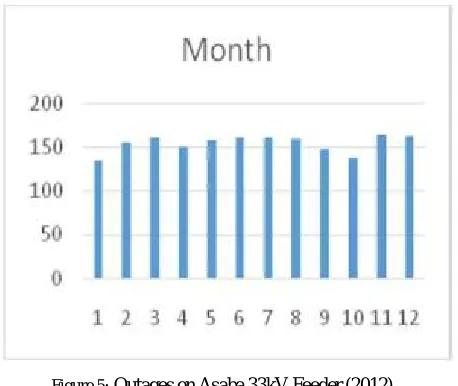
Figures 3, 4 and 5 show the number of outages on Asaba 33kV feeder recorded on daily basis from January to December for years 2010, 2011 and 2012 respectively.
IV. CONSTRUCTIONOFFAULTTREE
Symbols are used to represent logic gates and events in the construction of Fault Trees, which requires a good knowledge of logic gates, and their symbols.
The primary events are: Air, Animal, Arching, Armoured-shunt, Lightning Arrester-failure, Breakers blade-error, Dew, Feeder-Z, Pole Collapsed (Fp), Low Gas-pressure, Loss of phase on Grid (Grid- lofph), High Vegetation (Hveg), Induced High Voltage, Insulator leaking, Lightning and Thunder Strikes, Load Shedding, Over frequency, Breaker over loading, Line over loading, Offline outage (Req-off), Sub-station Protection failure (S/s fail), SOS, Under-frequency, and Broken Cross arm (X- arms).
Figure 3: Outages on Asaba 33kV Feeder (2010) Figure 4: Outages on Asaba 33kV Feeder (2011)
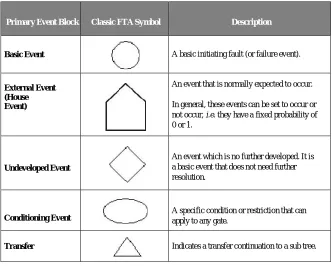
Events and Symbols: The gates in a fault tree are the logic symbols that interconnect contributory events and conditions. An event (or a condition) block in a fault tree can have a probability of occurrence (or a distribution function). However, where a single graphical representation is utilized to represent the block (or event), fault trees use several graphical block representations as shown in Table 1.
As stated in section IIA., there are four abnormal conditions that can lead to “consumers’ dissatisfaction”. An OR gate connects these four abnormal supply conditions (intermediate events) to the top-event. These four events are results of lower events, and the tree continues to the initiating events called the primary events.
These primary events are connected to the top-event through some intermediate events as shown in figure 6. Primary Event Block Classic FTA Symbol Description
Basic Event A basic initiating fault (or failure event).
External Event (House Event)
An event that is normally expected to occur.
In general, these events can be set to occur or not occur, i.e. they have a fixed probability of 0 or 1.
Undeveloped Event
An event which is no further developed. It is a basic event that does not need further resolution.
Conditioning Event A specific condition or restriction that can apply to any gate.
Transfer Indicates a transfer continuation to a sub tree. Table 1: Events and Symbols
Note that figure 7 is a sub-tree of the main tree in figure 6.
V. STATISTICALANALYSIS
A. Computation of Failure Rate (λ)
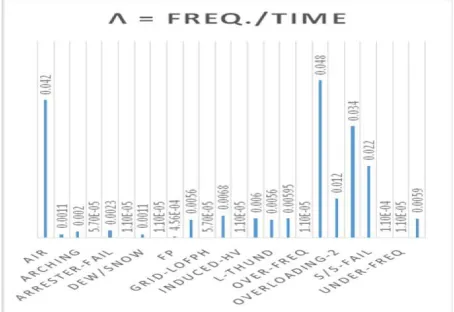
The failure rate (λ) of each primary event was calculated using the formula
λ= No of failures/Hrs operated (1)
Example for primary event “Air” Failure rate (λ) = 1841/43848
λ. = 0.042
The failure rate for other primary events was obtained employing the same formula and procedure. The values are shown in figure 8 and Table 2 shows the statistical data used for the subsequent calculations that follow.
Figure 7: Fault Sub-Tree
X
Frequency
(f)
Cum
Frequency
Fx X2f
2 2 2 4 8
3 470 472 1410 4230
4 337 809 1348 5392
5 673 1482 3365 16825
6 91 1573 546 3276
7 254 1827 1774 12446
sum 1827 8451 42177
Table 2: Statistical Data
B. Mean of Outages/Day: The mean is a measure of Central Tendency used to level off all the values in a set of data. The mean is equal to the sum of all the values in the data set divided by the number of values in the data set.
The mean outages/day is derived using the formula
Mean (µ ) (2)
Where, µ = mean outages/day, x =number of outages/day,
f = frequency of x. From table 2, Mean (µ) = , µ = 4.63; µ 5 outages/day
C. Standard Deviation (σ)The Standard Deviation is a measure of the spread of values within a set of data. In this case, it is a measure of the spread of the number of outages-per-day from the mean outages-per-day. The standard deviation (σ)
of the set of data in bar charts 1 - 5 as computed from table 2 is
Standard deviation (σ) (3)
Where, n = number of observations and µ = mean outages/day
x = number of outages/day, f = frequency of x. Thus,
Standard deviation (σ)
D. Mode: The mode in a set of data is the most frequent value in that set. It also represents the value that is most likely to be sampled in a data set. From table 2, the mode of the data is 5 outages/day
E. Median: The median is the middle value for a set of data that has been arranged in order of magnitude. Outliers and skewed data have less effect on the mode when compared to other measures of central tendency. The median from the cumulative frequency table is in a position
This implies; median = 5
F. Feeder Reliability: The reliability (R) of the feeder per unit time (per hour) can be computed using the formula
R (4)
Where λ = failure rate and t = time operated
R =
Therefore, R = 0.8250 or 82.50%
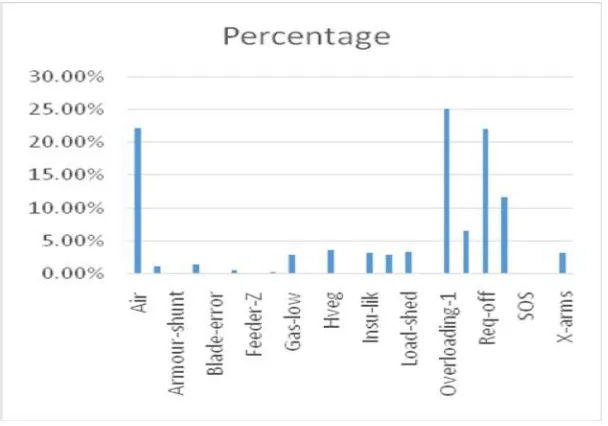
VI. SIMULATION AND RESULTS
10000 tests were simulated, with 10000 system failures recorded.
The simulation results show that the Probability of top event = 1.922960E-001 (+/- 1.922960E-003 ). This is approximately 4 to 5 failures per day. The contribution/importance of each primary event to the overall customer’s dissatisfaction is summarized in fig. 9.
A. Validation of Results: The overall result of the feeder’s failure rate obtained from OpenFTA simulation is approximately equal to the feeder’s actual failure rate obtained from Utility Company’s logbook.
Feeder’s Actual Failure Rate
Failure rate (5)
= 0.19273399
Simulation’s Failure Rate
Probability of top event (failure rate) = 0. 1922960 (+/- 1.922960E-003)
B. Summary of Results: A look at the fault tree shows that failure in any of the primary events will lead to “Consumers’ Dissatisfaction” This implies that no two or more events are compulsory to experience the top event. The connecting logic in the fault tree is “OR” gates.
case where the mean, mode and median are numerically equal. The standard deviation of the fault data is 1.28, and it shows that 79.94% of faults/day is from 3 to 6.
The month of January for any given year has relatively low number of outages. This must be as a result of the impact of industrial load on the feeder. Some industries shut down their production plants between Christmas and early January for annual maintenance, thereby reducing the overall load on the feeder.
The overall reliability of the feeder per hour is 82.50%. This figure is very poor for consumers in aerospace, chemical, medical and other industries where high reliability in power supply is a necessity. Some recommendations that can improve the reliability of the feeder per hour to at least 99.9% are presented.
VII. CONCLUSSION AND RECOMMENDATIONS
Only four of twenty-four primary events account for over 80% of the total failures (Consumer’s Dissatisfaction) namely:-
(i) Over-loading with respect to breaker's calibration (ii) Outage for offline operations on the feeder (iii) Ionization of air between poly-phase conductors (iv) Failure in adjoining substations' protection schemes. Eliminating the above mentioned four primary events, will improve the reliability of the feeder by 80% hence, to improve the reliability of Asaba 33kV feeder, the following recommendations are presented:-
Construction of at least two additional 33kV feeders will minimize tripping on Over-load with respect to breaker's calibration.
The Utility Company should supplement its manual line-isolators with line-breakers as well as upgrade its electricity network in support of Hot Line operations. This will minimize the number of outages needed for offline operations on the feeder.
The Utility Company should replace all sub-standard cross-arms with standards nine feet cross- arms, as well as adopt standard clearance for conductor above or below its feeders. These will minimize the effects of ionization of air between conductors.
The Utility Company should adopt standards in the protection schemes on all its distribution substations. This will minimize the number of faults that bye-pass its protection schemes.
The Utility Company should upgrade its recording system from manual to computer aided systems. This will improve accuracy in its network analysis.
REFERENCES
[1] Obi, Peter. “Powering and Lighting-up Nigeria” New Telegraph Jan. 28. Pp. 56. 2015.
[2] Dorji, T. “Reliability Assessment of Distribution Systems: -Including a case study on Wangdue Distribution System in Bhutan”. (Student paper). Norges teknisk-naturvitenskapelige universitet Institutt for elkraftteknikk. Pp.10-11, 2009.
[3] Wikipedia.“Nigeria Vision 2020” www.en.wikipedia.org/wiki/NV20:2020, 2013.
[4] Egeruoh Chigoziri. “Long Term Transmission Expansion Planning For Nigerian Deregulated Power System” Pp32-34. 2012. [5] Obe, E. “TCN stalls Power Distribution in Delta Substation” The Punch Newspapers, July 2, 2014.
[6] Wikipedia: en.wikipedia.org/wiki/Asaba_Delta.
[7] www.nercng.org Nigerian Electricity Regulatory Commission – Codes.
[8] Nigerian E l e c t r i c i t y R e g u l a t i o n C o m m i s s i o n ( NERC), “Goals and Objectives”
http://www.nercng.org/index.php/about-us/goals-and-objectives, 2013.
[9] Obi, P. I. “Improving Electric Power Quality in Nigeria Existing 330kV 28 bus Electric Power System Using Static Var Compensator System” International Journal of Engineering Research and Technology (IJERT). Vol. 2, Issue 8, pp 1060 – 1066, 2013.
[10] Weibull. “Fault Tree Analysis” www.weibull.com/basics/fault-tree/index.htm, 2013.
[11] Benner, Ludwig. “Accident Theory and Accident Investigation”. Proceedings of the Society of Air Safety Investigators Annual Seminar, 1975.
[12] Simha Pilot. “What is fault tree analysis? asq.org/.../what -is-a-fault, 2002.