Seismic Reliability Evaluation of Electrical Power Transmission Systems and its
Effect on Core Damage Frequency
Tetsukuni OIKAWA1), Sei’ichiro FUKUSHIMA2), Hidekazu TAKASE2), Tomoaki UCHIYAMA 1), and Ken MURAMATSU1)
1) Japan Atomic Energy Research Institute, Safety Analysis Laboratory, Tokai-mura, Ibaraki-ken 319-1195, Japan 2) Tokyo Electric Power Services Co., Ltd., 3-3 Higashi-Ueno, 3-Chome, Taito-ku, Tokyo 110-0015, Japan
ABSTRACT
This paper presents the results of seismic capacity evaluation of electrical transmission equipment in substations using the damage records in the case of the Southern Hyogo Prefecture earthquake in 1995, the seismic reliability of electrical power transmission systems and its influence on core damage frequency of a nuclear power plant. Since damages of electrical equipment in substations were found mostly in those manufactured before a revision of seismic design guideline in 1980, seismic capacity of electrical equipment was separately evaluated for those manufactured before and after the revision. The failure probability of electrical power transmission systems was higher than the occurrence probability of loss of offsite power due to failures of ceramic insulators in the site switchyard and its effect on the core damage frequency of the nuclear power plant was not significant.
1. INTRODUCTION
The results of many seismic probabilistic safety assessments (PSAs) of nuclear power plants (NPPs) to date showed that the most dominant initiating event was a loss of offsite power (LOSP). However, many seismic PSAs assumed that seismic LOSP was most likely to be caused by failure of ceramic insulators in the site switchyard. Similarly, in the seismic PSA of the BWR Model Plant performed at the Japan Atomic Energy Research Institute (JAERI) [1, 2], it was assumed that the failure of startup transformer with ceramic tube, which represented ceramic insulators in the site switchyard, was the cause for a LOSP. It has been recognized important to consider the effect of reliability of electrical power transmission systems under earthquakes loading, which may cause LOSP to the NPPs. Ang et al. evaluated fragilities of electrical transmission equipment and the seismic reliability of electrical power transmission systems on the basis of available data such as test data and damage records in the case of the 1989 Loma Prieta earthquake that occurred in San Francisco Bay area [3, 4].
After summarizing damage records in the case of the Southern Hyogo Prefecture earthquake, the so-called Kobe earthquake in 1995, this paper presents the seismic capacity evaluation of electrical transmission equipment using the damage records, the seismic reliability analysis of electrical power transmission systems and its effect on core damage frequency (CDF) of an NPP.
2. SUMMARY OF DAMAGES OF ELECTRICAL EQUIPMENT IN THE CASE OF KOBE EARTHQUAKE
In the case of the Kobe earthquake, many thermal power plants, substations, and transmission and distribution facilities near the epicenter suffered various types of damages from the earthquake. The headquarter office and the Kobe Branch of the Kansai Electric Power Company (KEPCO), which owns these facilities, published Restoration Record and Equipment Damage Record, respectively, after the earthquake [5, 6]. Here, a summary of damages of electrical equipment was provided from these reports.
2.1 Damages in Substations and Switchyards
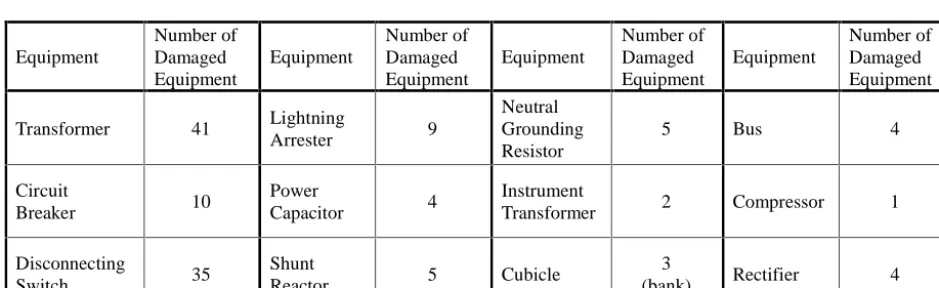
According to the Restoration Record, 50 of 861 substations and switchyards owned by the KEPCO sustained damages including minor one in the Kobe earthquake. The Equipment Damage Record summarized the number of damages of each electrical equipment in the hardest-hit area, Kobe as shown in Table 1. It also showed the analysis results of damages by failure modes, manufacturing year and voltage class. Figure 1 shows those of transformer as an example. This figure clearly shows that many of damaged transformers were manufactured before 1979. This trend was observed in damages of the other equipment. The Equipment Damage Record determined the reason for this trend as the revision of the Guideline for Aseismic Measures in Electrical Facilities of Substations and Others, JEAG-5003 [7] in 1980 according to the Miyagi-Prefecture Offshore Earthquake in 1978.
2.2 Damages in Transmission Towers
There were totally 3,417 transmission towers within the jurisdiction of the Kobe Branch. Of those, 686 towers suffered damages including minor ones. Table 2 shows critical damages of transmission towers in each seismic intensity scale
SMiRT 16, Washington DC, August 2001 Paper # 1569
defined by the Japan Meteorological Agency (JMA). Since the height of transmission towers increases as the voltage class of the power lines increases, seismic capacity of transmission towers may vary in their voltage class. However, failure modes of transmission towers were dominated by soil deformation in the Kobe earthquake. Therefore, seismic capacity of transmission towers depending on the voltage class and manufacturing year could not be evaluated in this study.
2.3 Selection of Electrical Equipment and Failure Mode for Seismic Capacity Evaluation
In this study, the following electrical equipment which caused failure of power supply were selected for seismic capacity evaluation: transformer, circuit breaker, disconnecting switch, instrument transformer, lightning arrester, power capacitor, shunt reactor, neutral grounding resistor and transmission tower. Failure modes of each equipment were categorized into three damage classes in the Equipment Damage Record depending on severity of damage: (A) cause for losing function, (B) need of repairing for long use, and (C) minor damage not affecting long use. Basically, the KEPCO determined failure modes in damage classes B and C in the light of power supply and did not include mechanical or structural failures in these damage classes. However, some failure modes categorized into damage classes B and C caused failure of power supply and needed some recovery action by operator for restoration of power supply. Therefore, the authors selected failure modes in damage classes A and B for evaluating capacity. One exception is the failure of plate releasing internal pressure of transformer, which is originally investment protection in case of internal pressure rise. Although the internal pressure of transformer did not increase, many failures of the plates occurred and caused failures of power supply in the Kobe earthquake. The KEPCO categorized it into damage class C because this failure mode can be easily reset by operators or engineers. However, the authors included this failure mode for capacity evaluation because there are some unmanned substations and switchyards and access route of engineers might be hampered by damages due to earthquake.
As for transmission towers, failure modes such as collapse of steel tower due to soil deformation, damages to insulators and melting of transmission line were selected as critical failures for capacity evaluation.
3. SESIMIC CAPACITY EVALUATION OF ELECTRICAL EQUIPMENT
3.1 Procedures of Seismic Capacity Evaluation
Seismic capacity of electrical equipment including transmission towers was evaluated by the following procedures. However, since the number of damages of instrument transformers was not enough to evaluate its seismic capacity by the following procedures, it was to be determined by the analogy of equipment designed similarly, lightning arrester. Moreover, since the total number of some equipment such as power capacitor and shunt reactor for voltage higher than 187 kV were not determined from the KEPCO’s reports, the seismic capacity of those for voltage lower than 187 kV were evaluated and these values were assumed to be the same for voltage higher than 187 kV.
(1) Determination of acceleration level for each substation
Peak ground accelerations (PGAs) of some substations were determined from seismograph records at these substations but the others were estimated from their location in the acceleration map provided in the Restoration Record.
(2) Calculation of damage ratio of each type of electrical equipment in each substation
Damage ratio was calculated as the number of failed equipments divided by the total number of equipments of the same type in each substation.
(3) Determination of uncertainty due to randomness, βr
The authors considered the following four factors as source of uncertainty due to randomness for equipment in substations: seismic ground motion, soil material, material property and ductility. Estimating the value of each factor from publicly available literatures including [8,9], the total of βr was calculated to be 0.29 by the Square Root of the Sum of the Squares method (SRSS). This value was applied to all equipment. As for the transmission tower, the following three factors were considered as source of βr, seismic ground motion, elastic coefficient of soil and viscosity of soil, and the total of βr was calculated to be 0.32 by the SRSS.
(4) Calculation of median value of each type of electrical equipment in each substation
Using the values of PGA, damage ratio and βr, median value of each type of electrical equipment in each substation was calculated by the following equation.
(
)
β Φ =
r M A ln
p (1)
where p is damage ratio, A is PGA, M is median capacity and Φ is the standard normal cumulative distribution function. However, the equation (1) does not provide a meaningful result for damage ratio 1 or 0. Thus, the authors regarded damage ratio 1 as 0.95 and 0 as 0.05 for substations whose PGAs were greater than the lowest PGA in the substations that suffered damages and one substation whose PGA was lower than but the nearest to that as shown in the parentheses in Tables 2 and 3.
(5) Calculation of representative median values and its logarithmic standard deviation.
median values and its logarithmic standard deviation were calculated. (6) Determination of uncertainty due to lack of knowledge, βu
The value of uβ was determined by the logarithmic standard deviation calculated in the previous step and engineering judgment.
Table 3 shows the damage ratio and estimated median capacity of transformers for voltage higher than 187 kV manufactured before 1979 in each substation.
3.2 Seismic Capacity of Electrical Equipment
Table 4 summarizes the results of median capacities and logarithmic standard deviations of electrical equipment for two voltage classes, higher than 187 kV and lower than 187 kV, manufactured before 1979. As shown in Table 4, the seismic capacity of equipment for lower voltage class is larger than that for higher voltage class. This fact may be related to the trend that the size of equipment for lower voltage class is generally smaller than that for higher voltage class.
3.3 Determination of Seismic Capacity of Electrical Equipment Manufactured after 1980
Since damages of electrical equipment were found mostly in those manufactured before 1979 as described in section 2.1, the procedures of seismic capacity evaluation based on damage ratio could not be applied for those manufactured after 1980 except that damages of disconnecting switches manufactured after 1980 were observed in the Shin-Kobe substation. Since the damage data were not enough for calculating damage ratios, the authors introduced a multiplier to represent the increase in capacity due to the change in the design guideline to obtain the median capacity of electrical equipment manufactured after 1980. The authors examined the following two points to determine the multiplier.
According to the revision of JEAG-5003 in 1980, seismic design method and its input motion were changed from static 0.5G to dynamic 0.5G (3 periods of resonant sinusoidal wave) for bushings and dynamic 0.3G (3 periods of resonant sinusoidal wave) for insulators and their related components. An amplification ratio defined as the ratio of the peak response acceleration to the peak acceleration of input motion due to these changes of seismic design method and its input motion was calculated to be 6 for bushings and 3.6 for insulators and their related components, respectively. Thus, theoretically, it was thought that the strength of each part was increased by the factor of 6 or 3.6.
On the other hand, using damage record of disconnecting switches in the Shin-Kobe Substation, which included the failure modes categorized into damage class A defined by the KEPCO, seismic capacity of disconnecting switch manufactured after 1980 was calculated based on damage ratio of 0.2 and compared with that manufactured before 1979 recalculated using damage ratio for the same failure modes categorized into damage class A. As a result, the median capacity of disconnecting switch manufactured after 1980 was 1.6 times larger than that manufactured before 1979.
The authors adopted a factor of 2 as the multiplier to he median capacity of equipment manufactured before 1979 in order to obtain the capacity for those manufactured after 1980 based on engineering judgment in addition to studies mentioned above. This multiplier of 2 was applied to all equipment regardless of their types and voltage classes in our study. The multiplier for calculating the median seismic capacity of equipment manufactured after 1980 in this study should be further examined after accumulating damage record due to earthquakes.
3.4 Comparison with Seismic Capacity Evaluated in USA
The evaluated seismic capacities of electrical equipment were compared with those estimated by Ang et al. They showed fragility curves of live tank circuit breakers for some voltage classes, a circuit breaker (SF6) and a disconnecting switch in Fig 5 in their paper [4]. However, since a live tank circuit breaker was not used in Japan, the comparison of fragility curves of two types of electrical equipment designed similarly, disconnecting switch and circuit breaker for higher than 187 kV, was made as shown in Fig. 2. The median capacities of both equipment manufactured before 1979 evaluated in this study were about a half of those estimated in the study by Ang et al. This is because our study includes minor failure modes for capacity evaluation as described in the section 2.3. However, the median capacities of equipment manufactured after 1980 were almost the same as those in USA. Moreover, the logarithmic standard deviations estimated in both studies are similar to each other. Although the absolute values of these data were more or less different from each other, the similar trend was observed, for example, seismic capacities of electrical equipment for lower voltage class were larger than those for higher voltage class.
4. EVALUATION OF SEISMIC RELIABILITY OF ELECTRICAL POWER TRANSMISSION SYSTEMS
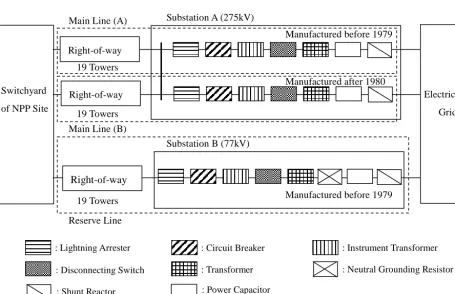
4.1 Model Construction of Electrical Power Transmission Systems to NPP Site
equipment instead of the set. As for the manufacturing year of electrical equipment in substations, the authors assumed that those in the main line A and the reserve line were manufactured before 1979 and those in the main line B were manufactured after 1980. As for the voltage class of equipment, the authors assumed that those in substation A were 275 kV and those in substation B were 77 kV. Moreover, the authors assumed that total length of each right-of-way was 10 km, each of which consists of 19 transmission steel towers standing at 500 meter intervals. Using the simple model, the reliability of electrical power transmission systems was assessed through Monte Carlo Simulations, where the number of trials in each acceleration level was 1,000. Since the amplification of response acceleration in surface soil was offset against the effect of soil-structure interaction, the authors assumed that accelerations at ground surface for calculating fragility of electrical power transmission systems were the same as those at bedrock for calculating a CDF. The attenuation of seismic wave for substations and each transmission tower was not considered because the analyzed area in limited to about 10 km2 in this study.
Figure 4 shows the fragility curves of the parts of substation A related to the main transmission line A and B, respectively, the substation B for the reserve transmission line, the right-of-way and the main transmission line A as a combination of the fragility curves of the electrical equipment in substations and the right-of-way. Comparing the three fragility curves of the parts of substation A related to the main lines A and B, respectively, and the substation B for the reserve transmission line with each other, the failure probability of the part of substation A related to main line A is highest and that of the substation B for the reserve line is second reflecting the differences in the median capacity of electrical equipment which depend on the voltage class and manufacturing year. Here, the fragility curves of the parts of substations A and B are similarly dominated by those of transformers. Since the fragility curves of the right-of-way of main lines A, B and reserve line are the same because of the same model and capacity data and those are similar to the fragility curve of the substation B, the failure probability of main line A is highest and that of reserve line is second. Since the right-of-way and the electrical equipment in substations were modeled as a series system and any one of their failures cause a loss of power, the failure probability of the main line A sharply increases at acceleration level of about 300 Gals. Since the failures of transmission towers and electrical equipment in substations were assumed to be independent in our analysis, the failure probability of electrical power transmission system would be decreased if the correlation among the failures, especially of transmission towers, was assumed to be strong.
Figure 5 shows the fragility curves of electrical power transmission systems as the logical product of that for main lines A and B and reserve line, the occurrence probability curve of LOSP calculated in the seismic PSA of the BWR Model Plant as the failure probability curve of the startup transformer with ceramic tube and a combination of those. The occurrence probability of LOSP is larger than the failure probability of electrical power transmission systems at the low acceleration level and the latter is larger than the former beyond about 350 Gals.
4.2 Reassessment of Core Damage Frequency Taking into Account Seismic Reliability of Power Transmission Systems
Taking into account the reliability of electrical power transmission systems, the CDF of the BWR Model Plant was reassessed and a sensitivity study was performed in order to examine the effect of the numbers of transmission lines and rights-of-way to the NPP site. The increase of the CDF including the contribution of electrical power transmission systems was about 15% for the base case where the number of transmission lines was three. When the number of transmission lines was changed from three to two, the increase of the CDF is about 25% even if it was assumed to be the worst case where electrical power transmission systems were assumed to be consisted of the main route A and the reserve line. The results show that the effect of electrical power transmission systems on the CDF is not so significant for the present case.
5. SUMMARY AND CONCLUDING REMARKS
In this study, seismic capacity of electrical equipment in substation and transmission tower was evaluated using damage records in the case of Kobe earthquake. Reflecting the revision in 1980 of seismic design guideline for equipment in substations, damages were found mostly in those manufactured before the revision. Therefore, the authors performed a seismic capacity evaluation of equipment manufactured before 1979 using damage record directly and determined a multiplier of 2 in order to obtain capacity values for those manufactured after 1980 based on engineering judgment. The evaluated seismic capacity of electrical equipment manufactured before 1979 was more or less conservative because some of minor damages that might be recoverable within short period were included. These results were similar to the seismic capacities evaluated in USA.
The seismic reliability of electrical power transmission systems to NPP site was calculated by the Monte Carlo Simulation using the capacity data evaluated in the previous step and the simplified models for substations and transmission lines. As a result, the occurrence probability of LOSP as the failure probability of the startup transformer with ceramic tube is larger than the failure probability of electrical power transmission systems at the low acceleration level and the latter is larger than the former beyond about 350 Gals. The results show that the effect of electrical power transmission systems on the CDF was not so significant. Similar results were also provided by the sensitivity analysis where the numbers of transmission lines and rights-of-way were changed from three to two.
further studies on LOSP scenarios of NPPs. Since an NPP has a seismic trigger system and there are many multi-unit sites in Japan, simultaneous scrams due to large seismic motion of all reactors in the multi-unit site may affect the reliability of the total electrical grid. The seismic reliability of the total electrical grid and its effect on CDF should be analyzed using some model extended from one developed in this study. Such analysis should take into account the seismic trigger system.
REFERENCES
1. Risk Analysis Laboratory, JAERI, “Summary Report of Seismic PSA of BWR Model Plant,” JAERI-Research 99-035, May 1999 (in Japanese).
2. OIKAWA, T., KONDO, M. and WATANABE, Y., ”Insights from the Seismic PSA of the BWR Model Plant at JAERI,” Proceeding of the International Topical Meeting on Probabilistic Safety Assessment (PSA’99), pp 77-84, Washington, DC, August 1999.
3. Ang, A.H.-S., Pires, J.A. and Villaverde, R., “A Model for the Seismic Reliability Assessment of Electric Power Transmission Systems,” Reliability Engineering and System Safety, Vol.51, 1996, pp.7-22.
4. Pires, J.A., Ang, A.H.-S. and Villaverde, R., “Seismic Reliability of Electrical Power Transmission Systems,” Nuclear Engineering and Design, Vol.160, 1996, pp.427-439.
5. The headquarter office of the Kansai Electric Power Company (KEPCO), “Restoration Record in the Case of the Kobe Earthquake,” June 1995(in Japanese).
6. The Kobe Branch of the Kansai Electric Power Company (KEPCO), “Equipment Damage Record in the Case of the Kobe Earthquake,” Main Report and 8 Appendices, March 1996(in Japanese).
7. The Japan Electric Association, Guideline for Aseismic Measures in Electrical Facilities of Substations and Others, JEAG 5003-1980, May 1995(in Japanese).
8. Fukushima, S., Yashiro, K. and Kai, Y., “Estimation of Response Variability Based on Observation Records,” Proceedings of the 14th International Conference on Structural Mechanics in Reactor Technology (SMiRT-14), pp 135-142, August 1997.
9. Katayama, I., Nishimura, Y. and Seshimo, Y., “Seismic Reliability of Slope Stability Considering Spatial Variability of Soil Properties,” Proceedings of the 13th International Conference on Structural Mechanics in Reactor Technology (SMiRT-13), pp 759-764, August 1995.
Table 1 Summary of Damaged Equipment in Substations within the Jurisdiction Area of the KEPCO Kobe Branch
Equipment
Number of Damaged Equipment
Equipment
Number of Damaged Equipment
Equipment
Number of Damaged Equipment
Equipment
Number of Damaged Equipment
Transformer 41 Lightning
Arrester 9
Neutral Grounding Resistor
5 Bus 4
Circuit
Breaker 10
Power
Capacitor 4
Instrument
Transformer 2 Compressor 1
Disconnecting
Switch 35
Shunt
Reactor 5 Cubicle
3
(bank) Rectifier 4
Table 2 Summary of Damaged Transmission Towers and their Capacity Evaluation
Seismic Intensity Scale Defined by the Japan
Meteorological Agency
Number of Transmission Towers
Number of Damaged Towers
Damage Ratio
Estimated Peak Ground Acceleration
Estimated Median Capacity
[Gal]
VII 53 0 (0.05) 800 1,354
VI 2,462 35 0.0142 400 807
V 94 0 (0.05) 250 423
Representative Median Capacity [Gal] 733
Logarithmic Standard Deviation 0.48
Table 3 Damage Ratio and Estimated Median Capacity of Transformer for Voltage Higher than 187kV Manufactured before 1979 in Each Substation
Name of Substation Observed or Estimated Peak
Ground Acceleration [Gal] Damage Ratio
Estimated Median Capacity [Gal]
Shin-Kobe 584 (0.95) 362
Itami 550 0.5 550
Nisi-Kobe 350 0.25 426
Yodogawa 300 (0.05) 483
Kobe 275 0.5 275
Kita-Toyonaka 250 (0.05) 403
Seidan 175 0.333 198
Nishi-Kyoto 129 (0.05) 208
Representative Median Capacity [Gal] 342
Logarithmic Standard Deviation 0.357
Note: Damage ratio in the parentheses, 0.95 or 0.05,was regarded from original value, 1 or 0.
Table 4 Seismic Capacity of Electrical Equipment in Substations Manufactured before 1979
Higher than 187kV All Voltage
Class
Transformer Circuit Breaker
Disconnecting Switch
Lightning Arrester
Instrument Transformer
Power Capacitor
Shunt Reactor
Transmission Tower Median
[Gal] 340 620 480 550 550 790 610 770
βr 0.29 0.29 0.29 0.29 0.29 0.29 0.29 0.32
βu 0.36 0.19 0.20 0.13 0.13 0.11 0.32 0.20
βc 0.46 0.35 0.35 0.32 0.32 0.31 0.43 0.38
Lower than 187kV
Transformer Circuit Breaker
Disconnecting Switch
Lightning Arrester
Instrument Transformer
Power Capacitor
Shunt Reactor
Neutral Grounding Resistor Median
[Gal] 500 1010 780 830 830 790 610 600
βr 0.29 0.29 0.29 0.29 0.29 0.29 0.29 0.29
βu 0.20 0.16 0.38 0.13 0.13 0.11 0.32 0.20
βc 0.35 0.31 0.48 0.32 0.32 0.31 0.43 0.35
Figure 1 Analysis Results of Damaged Transformers by the Manufacturing Year
Distribution of Damaged Transformers by Manufacturing Year in Five Year Interval
All Voltage Class Voltage Class
Numbe
r of
D
a
ma
g
e
0 5 10 15 20
2 1 4 2
11
8 13
0 1960 1965 1970 1975 1980 1985 1990 1995
Manufacturing year Class A Failure
Revision of Seismic Design Guideline
3 7
(a)D isco nnecting S w itch 0.0
0.1 0.2 0.3 0.4 0.5 0.6 0.7 0.8 0.9 1.0
0 300 6 00 9 00 1,20 0 1,500
P eak G ro und A ccelera tio n [G al]
P
ro
b
ab
ility
o
f F
ailu
re
by A ng et al.
T his stu dy(befo re 1 97 9) T his stu dy(after 1 98 0)
(b)C ircu it B reaker 0.0
0.1 0.2 0.3 0.4 0.5 0.6 0.7 0.8 0.9 1.0
0 300 6 00 90 0 1 ,200 1 ,5 00
P eak G ro u nd A cceleratio n [G al]
P
ro
b
ab
ility
o
f F
ailu
re
by A ng et al.
T his stud y(befo re 19 79 ) T his stud y(after 1 98 0)
Figure 2 Comparison of Fragility Curves Evaluated by Ang et al. and in This Study
Figure 3 Model of Electrical Transmission Systems to NPP Site : Disconnecting Switch
: Lightning Arrester
: Shunt Reactor : Power Capacitor : Circuit Breaker
: Transformer
: Instrument Transformer
: Neutral Grounding Resistor Substation A (275kV)
Substation B (77kV) Right-of-way
Right-of-way
Right-of-way Switchyard
of NPP Site
Electrical
Grid 19 Towers
19 Towers
19 Towers
Manufactured before 1979
Manufactured after 1980
Manufactured before 1979 Main Line (A)
Main Line (B)
0
0.1
0.2
0.3
0.4
0.5
0.6
0.7
0.8
0.9
1
0
300
600
900
1200
1500
Peak Ground Acceleration (Gal)
Probability of Failure
Part of Substation A Related to Main Line A
Part of Substation A Related to Main Line B
Substation B
Right-of-way
Main Transmission Line A
0
0.1
0.2
0.3
0.4
0.5
0.6
0.7
0.8
0.9
1
0
300
600
900
1200
1500
Peak Acceleration at Bedrock (Gal)
Occurrence Probability of Initiating Event
LOSP(Failure Probability of Startup Transformer
with Ceramic Tube)
Loss of Power in Electric Power Transmission
Systems (Main Lines A and B and Reserve Line)
LOSP Including Contribution of Electric Power
Transmission Systems
Figure 4 Fragility Curves of Substations, Right-of-way and Transmission Line