Performance Analysis of Classification of
Cardiotocograms Using Support Vector Machine
based Classifier
Jagannathan D,
M.Phil. (PG Scholar)
Dept of Computer Science, Dr. C. V. Raman University, Chhattisgarh – 495113, India
A bstract:
Fetal heart rate (FHR) and uterine contractions (UC) are simultaneously recorded by Cardiotocography (CTG). The CTG, which is one of the most common diagnostic techniques used to evaluate maternal and etal well-being during pregnancy and before delivery. By observing the Cardiotocography trace patterns doctors can understand the state of the fetus. There are several signal processing and computer programming based techniques for interpreting a typical Cardiotocography data. Even few decades after the introduction of cardiotocography into clinical practice, the predictive capacity of these methods remains controversial and still inaccurate. In this research work I propose an integrated methodology for CTG analysis and classification. A novel set of features, derived from the time and frequency domains, is used to feed the new powerful tool for pattern classification, named Support Vector Machines (SVMs). We used Accuracy, Specificity, NPV, Precision, Recall and ROC as the metric to evaluate the performance. The arrived results prove that, even though the traditional clustering methods can identify the Normal CTG patterns, they were incapable of Suspicious and Pathologic patterns. It was found that, the Support Vector Machines based classifier was capable of identifying Normal, Suspicious and Pathologic condition, from the nature of CTG data with very good accuracy..
Keywords
CTG, Data mining, Classification, fetal heart rate, uterine contractions and Support Vector Machines (SVMs)
1.
Introduction
Papers presented in NCIICT-2017 Conference can be accessed from
decision-making and practitioner reflection . The mainobjective of clinical data mining is to haul new and previously unknown clinical solutions and patterns to aid the clinicians in diagnosis, prognosis and therapy. Moreover application of software solutions to store patient records in an electronic form is expected to make mining knowledge from clinical data less stressful.
Cardiotocography (CTG)
Since the 1960’s, obstetricians are using the Cardiotocography, an electronic method for recording (graphy) the fetal heartbeat (cardio) and uterine contractions (toco) during pregnancy, by means of a Cardiotocograph or an electronic fetal monitor (EFM ). Fig. 1 illustrates a typical Cardiotocogram (CTG).
Figure 1. A t y p ical CT G [4]
The continuous monitoring by using CTG requires qualitative and quantitative interpretations of several parameters described as follows [3]:
Uterine activity (contractions):
Frequency: Number of contraction in a standard interval.
Duration: The amount of time from the start of a contraction to the end of the same contraction.
Intensity: A measure of how strong a contraction is.
Resting tone: A measure of how relaxed the uterus is between contractions.
Interval: The amount of time between the end of one contraction to the beginning of the next contraction.
Uterine activity may be defined as:
Normal- less than or equal to 5 contractions in 10 minutes, averaged over a 30-minu te window.
Tachysystole- more than 5 contractions in 10 minutes, averaged over a 30-minute window.
Baseline fetal heart rate (FHR), which is determined by approximating the mean FHR rounded to increments of five beats per minute during a 10-minute window, excluding accelerations and decelerations and periods of marked FHR variability.
Baseline FHR less than 110 beats per minute and symptoms are termed as Bradycardia.
Baseline FHR greater than 160 beats per minute and symptoms are termed as tachycardia.
Baseline FHR variability, which is determined in a 10-minute window, excluding accelerations and decelerations. Baseline FHR variability is defined as fluctuations in the baseline FHR that are irregular in amplitude and frequency. The fluctuations are visually quantified as the amplitude of the peak-to-trough in bpm (beat per minute).
Absent
Minimal
Moderate
Marked
Presence of accelerations: Visually apparent abrupt increase in FHR. An abrupt increase is an increase from an onset of acceleration to the peak in less than or equal to 30 seconds (to be considered as acceleration, the peak must be greater than or equal to 15 bpm).
Periodic or episodic decelerations
Periodic: Refers to decelerations that are associated with contractions.
Episodic: Refers to those not associated with contractions
There are four types of decelerations:
Early deceleration: It is related to a gradual decrease in the FHR with an onset of deceleration to a nadir (more than 30 seconds) where the nadir occurs with the peak of a contraction.
deceleration to a nadir (more than 30 seconds).
Variable deceleration: It is related to an abrupt decrease in the FHR (more than 15 bpm) that was measured from the most recently baseline where from the deceleration’s onset to nadir is less than 30 seconds and the deceleration lasts (more than 15 seconds).
Prolonged deceleration: It is present when there is a visually apparent decrease in FHR from the baseline that is greater than or equal to 15 bpm, lasting greater than or equal to 2 minutes, but less than 10 minutes. A deceleration that lasts greater than or equal to 10 minutes is a baseline change.
Changes or trends of FHR patterns over time:
Category I (Normal): Baseline rate 110-160 bpm, Moderate variability, Absence of late, or variable decelerations, and early decelerations and accelerations may or may not be present.
Category II (Indeterminate): Tracing is not predictive of abnormal fetal acid-base status, but evaluation and continued surveillance and revaluations are indicated.
Category III (Abnormal): Absence of baseline variability with recurrent late or variable decelerations or Bradycardia; or sinusoidal fetal heart rate
2.
Related Work
The International Federation of Obstetrics and Gynaecology (FIGO) guidelines [5] were introduced as an attempt to standardize the use of electronic monitoring of FHR. The first work of automatic CTG analysis following FIGO guidelines consists in describing and extracting the CTG morphological features [6]. Bernades [7] developed SisPorto, a system for automatic analysis of CTG tracings, based on an improvement of the morphological feature extraction introduced in [6].
Artificial Neural Networks (ANNs) were used as a classifier [8] to detect FHR acceleration and deceleration patterns and to estimate the FHR baseline and variability. ANNs were used to classify deceleration patterns into episodic and periodic decelerations [9] according to FIGO guidelines and based on the relationship between the parameters of
the deceleration and the associated uterine contraction. ANNs with Radial Basis Functions (RBF) and MultiLayer Perceptrons (MLP) were the best performing classifiers.
Support Vector Machines (SVM) have been used for FHR signal analysis. Georgoulas et al. [10] used discrete wavelet transformation to extract scale-dependent features of the FHR signal and SVM for their classification. Georgoulas et al. [11] used SVM with RBF and polynomial kernels to identify fetal and neonatal compromise, namely metabolic acidosis [12]. The RBF kernel machines outperformed the polynomial machines and both of them outperformed the conventional methods of k-nearest neighbor (k-NN), linear and quadratic discriminant classifiers.
Chudáček et al. [13] used SVM, naïve Bayes, and a decision tree (C4.5 algorithm) with a polynomial kernel to analyze FHR signals based on linear features (e.g. Description of the FHR baseline using mean) and nonlinear features (e.g. Fractal dimension of waveform). They used three FS methods: Principal Component Analysis, Information Gain, and Group of Adaptive Models Evolution (GAME).
Krupa et al. [14] proposed a new method for FHR signal analysis based on Empirical Mode Decomposition (EMD) for feature extraction and SVM with RBF for classification of FHR recordings. Georgoulas et al. [15] proposed a FS method based on bPSO (binary Particle Swarm Optimizatio n ) for FHR signal analysis using SVM and k-NN.
Hybrid methods have been also considered for automated FHR signal analysis. Fontenla-Romero et al. [16] proposed several approaches for the recognition of acceleration and deceleration patterns in FHR signals, including rule-based approach, ANNs, and a neuro-fuzzy approach.
Papers presented in NCIICT-2017 Conference can be accessed from
been adapted worldwide. Baseline estimation incomputer analysis of cardiotocographs , which is currently no consensus on the best methodology. More than 30 years after the introduction of antepartum cardiotocography into clinical practice, the predictive capacity of the method remains controversial. In a review of lot of articles published on this subject, it was found that its reported sensitivity varies between 2 and 100%, and its specificity between 37 and 100% [19]. So, in this work, we are going to evaluate Naive Bayes clustering algorithms for clustering CTG data.
4.
Material and Methodology
4.1.
Dataset Description
The Cardiotocography data set used in this study is publicly available at The Data Mining Repository of University of California Irvine (UCI). By using 21 given attributes data can be classified according to FHR pattern class or fetal state class code. In this study, fetal state class code is used as target attribute instead of FHR pattern class code and each sample is classified into one of three groups Normal, Suspicious or Pathologic. The dataset includes a total of 2126 samples of which is 1655 normal, 295 suspicious and 176 pathologic samples which indicate the existing of fetal distress.
Attribute information is given as: LB—FHR baseline (beats per minute) AC—# of accelerations per second FM—# of fetal movements per second UC—# of uterine contractions per second DL—# of light decelerations per second DS—# of severe decelerations per second DP—# of prolongued decelerations per second ASTV—percentage of time with abnormal short term variability
MSTV—mean value of short term variability ALTV—percentage of time with abnormal long term variability
MLTV—mean value of long term variability Width—width of FHR histogram
Min—minimum of FHR histogram Max—Maximu m of FHR histogram Nmax—# of histogram peaks Nzeros—# of histogram zeros Mode—histogram mode Mean—histogram mean Median—histogram median
Variance—histogram variance Tendency—histogram tendency
CLASS—FHR pattern class code (1 to 10)
NSP—fetal state class code (N = normal; S = suspect; P = pathologic)
4.2.
Cl assification
Classification process may be applied in different areas of research and practice, e.g., farms , military, medicine, Earth remote sensing. The classical classification techniques use statistical approach, which typically assumes the normal multidimension al distribution of probability in the experimental data set. Data classification may be supervised and unsupervised.
The supervised classification method requires the presence of training data set typically defined by the expert-the teacher. Each class of objects is characterised by the basic statistical parameters (mean values vector, covariance matrix), which are values vector, covariance matrix), which are computed fro m the training set. These parameters guide the discrimination process. The Bayesian classifiers are typical representatives (Bayes classifier, Fisher, Wald sequential). The unsupervised classification is also known as classification without the teacher. This classification uses, in most cases, the methods of cluster analysis. The device that performs the function ofclassification is called classifier. The classifier is the system containing several inputs that are transported with signals carrying information about the objects. The system generates information about the competence of objects into a particular class on the output.
4.3.
The
Medical
Background
Of
Cardiotocography (CTG)
specific amount of dilation has taken place. The external tests, a pair of sensory nodes are affixed to the mother's stomach. The CTG trace generally shows two lines. The fetal heart rate is recorded by the upper line in beats per minute and the uterine contractions are recording by the lower line from the TOCO.
Baseline Heart Rate
The baseline heart rate helps to evaluate the healthy functioning of the cardiovascular system. The baseline fetal heart rate is determined by approximating the mean FHR rounded to increments of 5 beats per minute (bpm) during a 10-minu te window, excluding accelerations and decelerations and periods of marked FHR variability (greater than 25 bpm. Abnormal baseline is termed bradycardia and tachycardia. The fluctuations are visually quantities as the amplitude of the peak- to-trough in bpm. Using this definition, the baseline FHR variability is categorized by the quantities amplitude as:
Absent- undetectable
Minimal- greater than undetectable, but less than or equal to 5 bpm
Moderate- 6 bpm - 25 bpm Marked- greater than 25 bpm
Bradycardia:
It is the resting heart rate of under 60 beats per minute, though it is seldom symptomatic until the rate drops below 50 beats/min. It may cause cardiac arrest in some patients Tachycardia: It typically refers to a heart rate that exceeds the normal range for a resting heart rate (heart rate in an inactive or sleeping individual). Depending on the speed and type of rhythm, it can be dangerous.
Type 1 (early)
This occurs during the peak of the uterine contraction. The FHR with onset early in the contraction and return to baseline at the end of the contraction will be uniform, repetitive and periodic slowing. The reasons behind this may be fetal head compression, cord compression or early hypoxia. This occurs in first and second stage labor with decent of the head [21]. This is synchronous with uterine contraction.
Type 2 (late)
This occurs after the peak of the uterine contraction. The FHR with onset mid to end of the contraction and nadir more than 20 seconds after the peak of the contraction and ending after the contraction will also be uniform, repetitive and slowing. If the lag time is high seriousness is also high. This is also synchronous with uterine contraction. Mx: a fetal pH measurement is mandatory [21].
Type 3 (variable)
This is variable, repetitive, and periodic slowing of FHR with rapid onset and recovery. Variable and isolated time relationships with contraction cycles may occur. Deceleration patterns in timing and shape resembles other types in some cases. If they occur consistently, there is a chance of fetal hypoxia. This is unrelated to uterine contractions. Mx: check fetal pH if the pattern persists after turning the patient on her side (or if other adverse features are present) [21].
4.4.
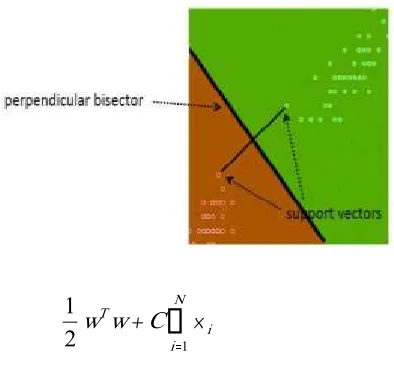
Support Vector Machine
Papers presented in NCIICT-2017 Conference can be accessed from
Ni i T
w
C
w
1
2
1
Subject to the constraints:
w
x
b
and
i
N
y
T i i ii
1
0
,
1
,....,
where, C is the capacity constant, w is the vector of coefficients, b is a constant, and represents parameters for handling nonseparable data (inputs). The index i labels the N training cases. Note that represents the class labels and xi represents the independent variables. The kernel is used to transform data from the input (independent) to the feature space. It should be noted that the larger the C, the more the error is penalized. Thus, C should be chosen with care to avoid over fitting.
5.
Experimentation Result
5.1.
Performance Evaluation
This is a measurement tool to calculate
the performance
Accuracy =
FN FP TN TP
TN TP
Sensitivity =
FN TP
TP
Specificity =
FP TN
TN
Positive Predictive Value:
FP TP
TP PPV
Negative Predictive Value:
FN TN
TN NPV
ROC =
2
speificity
y
sensitivit
Where
Therecallortrue positive rate (TP) is the proportion of positive cases that were correctly identified
Thefalse positive rate(FP) is the proportion of negatives cases that were incorrectly classified as positive
Thetrue negative rate(TN) is defined as the proportion of negatives cases that were classified correctly
Thefalse negative rate(FN) is the proportion of positives cases that were incorrectly classified as negative
Theaccuracy(AC) is the proportion of the total number of predictions that were correct.
The Sensitivity or Recall the proportion of actual positive cases which are correctly identified.
The Specificity the proportion of actual negative cases which are correctly identified.
The Positive Predictive
Value or Precision the proportion of positive cases that were correctly identified.
The Negative Predictive Value the
proportion of negative cases that were correctly identified.
Performance
Support Vec tor MachineAccuracy
97.9304Sensitivity
96.9135Specificity
99.2001PPV
95.5561NPV
97.7207ROC
98.05686.
Conclusion
This work has evaluated the performance of the Support Vector Machine methods with respect to confusion matrix and accuracy. According to the Support Vector Machine based classification approach provided significant performance. It was found that the Support Vector Machine classifier was capable of identifying Normal, Suspicious and Pathologic condition, from the nature of CTG data with very good accuracy. If we consider only the precision as a metric, then arrived results proves that, even though the machine learning based methods can distinguish the Normal CTG patterns from the Suspicious and Pathologic patterns with respect to precision and pathologic, but, they were incapable of distinguishing Suspicious. That is why we are getting comparatively poor average performance while classifying suspicious records with respect to precision. It is a major weakness of the algorithms which should be overcomes in future design. One may address the way to improve the system for getting proper results with different classes of CTG patterns. One may consider machine learning based method to design the CTG data classification system. Future works may address hybrid models using statistical and machine learning techniques for improved classification accuracy.
In future work, we plan to collaborate with obstetric clinicians and physicians in order to assess the computational results.
References
[i] Steer, P.J. (2008) Has Electronic Fetal Heart Rate
Monitoring Made a Difference? Seminars in Fetal and Neonatal Medicine, 13, WB Saunders, 2-7.
[ii] Yi Peng, Gang Kou“A descriptive framework for
the field of data mining and knowledge discovery” International Journal of Information Technology & Decision Making Vol. 7, No. 4(2008) pp. 639– 682.
[iii] D. Robertsa, B. Kumara, D.G. Tincellob, and S. A.
Walkinshawa, ―Computerised antenatal fetal
heart rate recordings between 24,‖ British J.
Obstet. Gynaecol., pp. 858-862, Aug. 2001. Sundar, C., Chitradevi, M. and Geetharamani, G. (2012) Classification of Cardiotocogram Data Using Neural Network Based Machine Learning Technique. International Journal of Computer
Applications, 47, 19-25.
http://dx.doi.org/10.5120/7256-0279
[iv] G. Georgoulas, D. Chrysostomos, and P. P.
Groumpos, ―Predicting the risk of metabolic acidosis for newborns based on fetal heart rate signal classification using support vector
machines,‖ IEEE Trans. Biomed. Eng., pp. 875-
884, Apr. 2006.
[v] G. Rooth, A. Huch, and R. Huch, ―Guidelines for
the use of fetal monitoring,‖ Int. J. Gynaecol.
Obstet., vol. 25, pp. 159-167, 1987.
[vi] R. Mantel, H. P. van Geijn, F. J. Caron, J. M.
Swartjes, E. E. van Woerden, and H. W. Jongsma, ―Computer analysis of antepartum fetal heart rate: 2. Detection of accelerations and decelerations, Int. J. Biomed. Comput., 25(4), pp. 273-286, May 1990.
[vii] J. Bernardes, C. Moura, J. P. de Sa, and L. P. Leite,
―The Porto system for automated
cardiotocographic signal analysis,‖ J. Perinat.
Med., pp. 61–65, 1991.
[viii] P. A. Warrick, E. F. Hamilton, and M.
Macieszczak, ―Neural network based detection
of fetal heart rate patterns,‖ in Proc. IEEE Int.
Joint Conf. on Neural Netw. IJCNN’05, Aug. 2005, vol. 5, pp. 2400- 2405.
[ix] M. Jezewski, P. Labaj, J. Wrobel, A. Matonia, J.
Jezewski, and D. Cholewa, ―Automated classification of deceleration patterns in fetal heart
rate signal using neural networks,‖ in Proc. IV
Latin American Cong. on Biomed. Eng. 2007, Bioeng. Sol. for Latin America Health IFMBE Proc., 2008, vol. 18, pp. 5-8.
[x] G. Georgoulas, D. Stylios, and P. P. Groumpos,
―Classification of fetal heart rate using scale
dependent features and support vector machines,‖
Papers presented in NCIICT-2017 Conference can be accessed from
[xi] G. Georgoulas, D. Chrysostomos, and P. P.
Groumpos, ―Predicting the risk of metabolic acidosis for newborns based on fetal heart rate signal classification using support vector
machines,‖ IEEE Trans. Biomed. Eng., pp. 875-
884, Apr. 2006.
[xii] H. P. van Geijn, ―Developments in CTG
analysis,‖ Bailliere’s Clin. Obstet. Gynaecol.,
vol. 10, no. 2, pp. 185–209, June 1996.
[xiii] V. Chudáček, J. Spilka, M. Huptych, G.
Georgoulas, P. Janků, M. Koucký, C. Stylios, and L. Lhotská, "Comparison of linear and non-linear features for intrapartum cardiotocography evaluation – Clinical usability vs. Contribution to
classification,‖ Analysis Biomed. Signals
Images, BIOSIGNAL, pp. 369-372, 2010.
[xiv] N. Krupa , M. A. MA , E. Zahedi, S. Ahmed, and
F. M. Hassan, "Antepartum fetal heart rate feature extraction and classification using empirical mode
decomposition and support vector machine,‖
BioMed. Eng. OnLine, 10:6, 2011.
[xv] G. Georgoulas, C. Stylios, V. Chudáček, M.
Macas, J. Bernardes, and L. Lhotska, ―Classification of fetal heart rate signals based on features selected using the binary particle swarm
optimization algorithm,‖ World Cong. Med. Phy.
Biomed.l Eng. 2006, IMBE Proc., 2007, pp. 1156-1159.
[xvi] O. Fontenla-Romero, A. Alonso-Betanzos, and B.
GuijarroBerdinas, ―Adaptive pattern recognition
in the analysis of cardiotocographic records,‖
IEEE Trans. Neural Netw., vol. 12, no. 5, pp. 1188–1195, Sep. 2001.
[xvii] Sundar, C., Chitradevi, M. and Geetharamani, G.
(2013) An Overview of Research Challenges for Classification of Cardiotocogram Data. Journal of
Computer Science, 9,
198-206.http://dx.doi.org/10.3844/jcssp.2013.198.206
[xviii] Hakan Sahin and Abdulhamit Subasi.
Classification of the Cardiotocogram Data for Anticipation of Fetal Risks Using Machine
Learning Techniques. International Burch
University. Faculty of Engineering and Information Technologies. Francuske Revolucije b.b., Ilidza, Sarajevo 71000, Bosnia and Herzegovina, Applied SoftComputing 33 (2015) 231–238.
[xix] Shahad Nidhal, M. A. Mohd. Ali1 and Hind
Najah, 2010,“A novel cardiotocography fetal heart rate baseline estimation algorithm”, Scientific Research and Essays Vol. 5(24), p. 4002-4010
[xx] Diogo Ayres-de-Camposa, Cristina
Costa-Santosb, Joa˜o Bernardesa, 2005, "Prediction of neonatal state by computer analysis of fetal heart
rate tracings: the antepartum arm of the SisPorto1 multicentre validation study”, European Journal of Obstetrics & Gynecology and Reproductive Biology 118, 52-60.
[xxi] Stirrat, Mills and Draycott,2003, "Notes on
Obstetrics and Gynaecology for the MRCOG, 5th
Edition", ISBN: 9780443072239
BIOGRAPHY
Jag annathan D is currently pursuing
M.Phil degree in computer science in Dr. C. V. Raman University, Chhattisgarh. He has done his M.Sc degree in Computer Science fro m V.O.Chidambaram College,Thoothukudi and the B.Sc in Computer Science fro m Kamaraj College ,Thoothukudi.under
Manonmaniam Sundaranar
![Figure 1. A ty p ical CTG [4]](https://thumb-us.123doks.com/thumbv2/123dok_us/7773886.1281158/2.612.83.283.353.511/figure-ty-p-ical-ctg.webp)