Electronic Thesis and Dissertation Repository
7-3-2012 12:00 AM
Essays on Informal Labor Markets
Essays on Informal Labor Markets
Javier Cano Urbina
The University of Western Ontario Supervisor
Audra J. Bowlus
The University of Western Ontario Joint Supervisor Lance J. Lochner
The University of Western Ontario Graduate Program in Economics
A thesis submitted in partial fulfillment of the requirements for the degree in Doctor of Philosophy
© Javier Cano Urbina 2012
Follow this and additional works at: https://ir.lib.uwo.ca/etd Part of the Labor Economics Commons
Recommended Citation Recommended Citation
Cano Urbina, Javier, "Essays on Informal Labor Markets" (2012). Electronic Thesis and Dissertation Repository. 649.
https://ir.lib.uwo.ca/etd/649
This Dissertation/Thesis is brought to you for free and open access by Scholarship@Western. It has been accepted for inclusion in Electronic Thesis and Dissertation Repository by an authorized administrator of
(Spine title: Essays on Informal Labor Markets)
(Thesis format: Integrated Article)
by
Javier Cano Urbina
Graduate Program in Economics
SUBMITTED IN PARTIAL FULFILLMENT OF THE REQUIREMENTS FOR THE DEGREE OF
DOCTOR OF PHILOSOPHY
SCHOOL OF GRADUATE AND POSTDOCTORAL STUDIES THE UNIVERSITY OF WESTERN ONTARIO
LONDON, CANADA MAY 2012
c
CERTIFICATE OF EXAMINATION
Supervisors Examiners
Dr. Audra J. Bowlus Dr. Pedro Carneiro
Dr. Lance J. Lochner Dr. Timothy G. Conley
Supervisory Committee
Dr. Salvador Navarro
Dr. Youngki Shin Dr. Paul-Philippe Par´e
The thesis by
Javier Cano Urbina
entitled
Essays on Informal Labor Markets
is accepted in partial fulfillment of the requirements for the degree of
Doctor of Philosophy
Date
Chair of the Thesis Examining Board
This thesis consists of three related papers. The first paper examines whether
informal sector jobs are a source of training for young less-educated workers.
Controlling for worker and job characteristics, it is found that in the early years
of workers’ careers in Mexico, wage growth in the informal sector is higher than
in the formal sector. This result is consistent with general human capital
in-vestment on-the-job if the informal labor market is more competitive than the
formal labor market due to frictions generated by labor regulations. These
results motivate a deeper analysis of the informal labor market which is
pre-sented in the second paper.
The second paper examines two roles that informal sector jobs play in the
early stages of a worker’s career: informal jobs may (i) provide the opportunity
to accumulate skills, and (ii) act as a screening device that enables employers to
learn a worker’s ability. This paper develops a matching model of the informal
and formal sectors that can accommodate both roles. Implied hazard rates from
informal to formal sectors as a function of tenure are shown to differ depending
on whether the role of informal sector jobs is human capital accumulation or
screening. Using the ENOE, a longitudinal employment survey from Mexico,
hazard functions are estimated for less-educated workers. The estimated
haz-ard functions suggest the informal sector plays an important role by screening
less-educated workers in the early stages of their careers. The estimation
re-sults also imply that employers would only learn the ability of 14% of their
workers after one month of employment. This finding suggests that employers’
of workers after a short period of time.
The duration data used for estimation in the second paper is obtained from
the stock of individuals employed in the informal sector at a given point in
time. It is known that duration data obtained from a given stock of individuals
can fail to observe those with relatively short spells. Accounting for this
sam-ple bias requires constructing a conditional likelihood function, which in turn
requires knowledge of the exact starting times of each spell. Unfortunately, it
is common in duration data to have coarse measures for starting times,
com-plicating the resolution of sampling bias. The third paper investigates several
alternatives for overcoming coarseness by imputing interval-censored starting
times and performing a Monte Carlo analysis. The results indicate that
im-puted interval midpoints outperform the alternatives.
First and foremost, I want to thank my two supervisors Audra Bowlus and
Lance Lochner. Their numerous suggestions and insightful comments are the
pillars of this thesis. They have my greatest appreciation and admiration, and
I have been fortunate to have them as my mentors and role models.
I also want to thank Youngki Shin for taking the time to look at my work
and providing helpful suggestions for improvement. Many of the ideas that
motivated the papers in this thesis were the result of discussions with Aldo
Colussi, to whom I am deeply grateful. Finally, I want to thank Todd
Stine-brickner, first, for giving me the opportunity to fulfill my goals at Western, and
second, for helping me to better convey my message.
I want to extend a very special thank to Yvonne Adams. She has been a
good friend and a great support. Not only is she extremely efficient in what she
does, but also, she goes out of her way to help students beyond what her job
requires, making everyone of us feel special.
Throughout this project, I benefited from the support of my friends Daniel
Montanera and Deanna Walker. I thank them for listening to my ideas,
mo-tivating me, and helping me clarify my thoughts. I have also benefited from
the interaction with many other friends, helping me to move ahead in my work
and making the graduate experience at Western more enjoyable. I extend my
gratitude to Jon Rosborough, George (Ye) Jia, Jacob Wibe, Michael
McCaus-land, Douwere Grekou, Shiddarta V ´asquez C´ordoba, Philippe Belley, David
friend to you as you have been to me.
I am also grateful to have had the opportunity to interact with numerous
faculty members of the Western community and getting suggestions from them
on how to proceed or make my discussion clearer. It has been a honor to me
to have met professors Tim Conley, Igor Livshits, Benjamin Lester, Salvador
Navarro, Greg Pavlov, Chris Robinson, and Al Slivinski. I want to thank them
all for listening to me and making me feel like a colleague.
Certainly having the support from the administrative staff helped in
mak-ing my stay at Western more enjoyable. I want to thank Jane McAndrew,
Jen-nifer Hope, Sharon Phillips, and Debra Merrifield for being good friends and
helping me make my life less complicated.
Not being a native English speaker, I want to acknowledge all the help that
I received from the members of the Writing Support Centre at the University of
Western Ontario. I want to thank Ryan Robb, Thila Varghese, Derek Lattimer,
and Emily Kress for their many suggestions over these years.
Finally, I want to thank the Consejo Nacional de Ciencia y Tecnolog´ıa,
CONACYT, for their financial support, and Lance Lochner for the opportunity
to work for him as a Research Assistant, through which I learned so much and
supported my studies here in Canada.
Certificate of Examination ii
Abstract iii
Acknowledgements v
Table of Contents viii
List of Tables xi
List of Figures xiii
List of Appendices xv
1 Introduction 1
1.1 Bibliography . . . 5
2 Informal Labor Markets and On-the-Job Training: Evidence from Wage Data 7 2.1 Introduction . . . 7
2.2 Data: The ENEU . . . 11
2.2.1 The Sample . . . 12
2.2.2 Identification of Informal Sector Workers . . . 14
2.3 Evidence from Wage Data . . . 17
2.4 Economic Interpretations of Evidence . . . 24
2.5 Final Remarks . . . 28
2.6 Bibliography . . . 31
3.2 Baseline Model . . . 52
3.3 Extensions to the Baseline Model . . . 60
3.3.1 Human Capital Accumulation . . . 62
3.3.2 Employer Learning (Screening) . . . 66
3.3.3 Understanding the Role of the Informal Sector in the Early Careers of Less-educated Workers . . . 73
3.4 Data: The ENOE . . . 73
3.4.1 Sample . . . 74
3.4.2 Identification of Informal Salaried Workers . . . 75
3.4.3 Measuring Duration in the Informal Sector . . . 77
3.5 Estimation . . . 81
3.5.1 Likelihood Function . . . 81
3.5.2 Hazard Function . . . 85
3.6 Results . . . 86
3.6.1 Piecewise Constant Hazard Function . . . 86
3.6.2 Parametric Hazard Functions . . . 89
3.6.3 Unobserved Heterogeneity . . . 91
3.6.4 A Final Comment on Testing the Implications . . . 91
3.6.5 Screening in B´ecateTraining Program . . . 92
3.7 Final Remarks . . . 94
3.8 Bibliography . . . 96
4 Stock Sampling with Interval-Censored Elapsed Duration: A Monte Carlo Analysis 109 4.1 Introduction . . . 109
4.2 Interval-Censored Starting Times . . . 115
4.2.1 Alternative for Estimation: Imputed Starting Times . . . . 117
4.3 Simulation of Survey Data . . . 120
4.3.1 Simulation Algorithm . . . 121
4.4 Simulation Results . . . 126
4.5 Duration Data in the ENOE . . . 129
4.5.1 Duration of Informal-Sector Employment in the ENOE . . 129
4.5.2 Simulation Results . . . 132
4.6 Final Remarks . . . 134
4.7 Bibliography . . . 136
A.1 Wage Imputations . . . 147
B Appendix for Chapter 3 149
B.1 Wages in the Model . . . 149 B.2 Proofs . . . 150 B.2.1 Proof of Lemma 1 . . . 150 B.2.2 Proofs of the Shape of the Unconditional Hazard Rates . . 154 B.3 Minimization Algorithm to Find Parameters of the Employer
Learn-ing Model . . . 157
Curriculum Vitae 158
2.1 Log-Wage Regressions by Sector . . . 41
2.2 One-Quarter Wage Growth Regressions . . . 42
2.3 Wage Growth Regressions: Coefficient of Informal Sector Partic-ipation for Two Consecutive Quarters . . . 43
2.4 Two-Quarters Wage Growth Regressions . . . 44
3.1 Summary Statistics by Education Group . . . 102
3.2 Distribution of Duration Data in the Sample (Number of Obser-vations) . . . 103
3.3 Censoring in the Sample (Number of Observations) . . . 103
3.4 Summary Statistics of Duration Data in Weeks . . . 104
3.5 Estimated Piecewise Constant Hazard . . . 105
3.6 Estimated Weibull and Log-logistic Hazards . . . 106
4.1 Elapsed Duration in the ENOE and PME . . . 114
4.2 Parameters of Data Generating Process . . . 126
4.3 Sample Designs with Continuous-Time Data . . . 127
4.4 Sample Designs with Interval-Censored Data . . . 132
4.5 Estimation Results Ignoring Stock Sampling (Sample CONTA) . 138 4.6 Estimation Results Accounting for Stock Sampling (Sample CONTA)139 4.7 Estimation Results with Imputed Elapsed Duration (Sample CONTB)140 4.8 Estimation Results with Interval-Censored Residual Duration (Sample INTCA) . . . 141
4.10 Estimation Results Monthly and Interval-Censored Duration Data:
Imputed Elapsed Duration (Sample INTCC) . . . 143
2.1 Age Distribution in the ENEU . . . 34
2.2 Education Distribution in the ENEU . . . 34
2.3 Job Position Distribution in the ENEU . . . 35
2.4 Job Position Distribution Ages 16 - 20 . . . 35
2.5 Formal Salaried and Informal Salaried Workers by Age . . . 36
2.6 Worker Transitions by Age as a Fraction of Initial Sector . . . 36
2.7 Kernel Density of Log-Wages in the Sample . . . 37
2.8 Average Wage over Time by Sector in the Sample . . . 37
2.9 Firm Size Distribution in the Sample . . . 38
2.10 Industry Distribution in the Sample . . . 39
2.11 Kernel Density of Wage Growth in the Sample . . . 40
3.1 Share of Salaried Workers in Informal Jobs in Latin America and the Caribbean . . . 46
3.2 Distribution of Workers by Employment Sector in Mexico . . . 49
3.3 Transitions Out of the Informal Sector in Mexico . . . 49
3.4 Reservation Match Quality for Employed and Unemployed Workers 59 3.5 Piecewise Constant Baseline Hazard with 95% Pointwise Confi-dence Interval . . . 107
3.6 Estimated and Model-Generated Hazards . . . 108
4.1 Stock Sampling . . . 111
4.2 Stock Sampling with Interval-Censored Starting Time . . . 113
A.1 Wage Imputations . . . 147
B.1 Wages in the Model . . . 149
B.2.1 Proof of Lemma 1 . . . 150
B.2.2 Proofs of the Shape of the Unconditional Hazard Rates . . . 154
B.3 Minimization Algorithm to Find Parameters of the Employer Learning Model . . . 157
Chapter 1
Introduction
The terminformalitymeans different things to
different people, but almost always bad things
Maloney and Saavedra-Chanduvi (2007)
This dissertation is composed of three related papers. The first two papers,
presented in Chapters 2 and 3, study the role of informal jobs over the career
of less-educated workers. The third paper, presented in Chapter 4, studies the
properties of the estimators used in Chapter 3.
An informal job is a job that does not comply with labor regulations. As
such, these jobs constitute what is typically known as the informal sector. Its
counterpart, the formal sector, is composed of jobs that comply with labor
reg-ulations. These regulations, such as minimum wage, health insurance,
and it is commonly argued that observance of these mandates is of great
sig-nificance in developing countries to ensure social justice for workers (Berg and
Kucera, 2008) and to protect them against the forces of reallocation in the labor
market (Inter-American Development Bank, 2003). On the other hand, labor
regulations raise labor costs, and so there is an incentive for employers not to
comply. Similarly, individual workers may prefer a more direct compensation
as opposed to the indirect protection offered by regulations. Furthermore, it
is usually the case that developing countries have low levels of enforcement of
these regulations. As a result, a mass of informal sector jobs emerge; and this
jobs become the main source of employment for certain groups of the
popula-tion, such as the group of young less-educated workers.
Given the importance of informal sector jobs for the employment of young
less-educated workers, it is natural to try to learn more about the work
expe-riences of this group in the informal sector. Chapter 2 provides an initial step
to better understand the effects of informal jobs in the careers of less-educated
workers. Evidence presented in this chapter indicates that for the group of
less-educated workers, wage growth is higher in the informal than in the
for-mal sector, once controlling for worker and job observable characteristics. This
result is consistent with theories of human capital accumulation for the
follow-ing reasons. First, the labor market in the informal sector is more competitive
than the labor market in the formal sector. Second, in any competitive labor
Third, in a frictional labor market, employers benefit from workers’ training
and are willing to sponsor at least part of the cost of training (Acemoglu and
Pischke, 1999). As a result, one might expect informal sector workers to have
faster wage growth than formal sector workers. These results indicate that it is
possible that informal sector jobs represent a source of training for young-less
educated workers in Mexico.
Chapter 3 further explores the results of Chapter 2. The goal of this
chap-ter is to dechap-termine if working in the informal sector can improve the career
prospects of less-educated workers. To that end, this chapter considers two
mechanisms through which informal jobs may positively affect the careers
of less-educated workers. The first mechanism has informal sector jobs
pro-viding training opportunities for young less-educated workers. The second
mechanism has informal sector jobs helping to resolve an information problem
about the initially unobserved skills of young less-educated workers. These two
mechanisms are separately incorporated into a matching model and testable
implications are derived. The matching model developed in this paper
fol-lows the model proposed by Albrecht, Navarro, and Vroman (2006, 2009). The
testable implications are based on the shapes of the hazard function from the
informal to the formal sector. Each of the two proposed mechanisms implies
different shapes for this function. A flexible hazard function is estimated using
data from Mexico, and the estimated hazard is consistent with the implications
screening device that helps to resolve the information problem about the
ini-tially unknown skills of young less-educated workers. It is important to
men-tion that this result does not rule out the possibility that informal jobs also
provide training to young less-educated workers.
The estimation of the hazard function in Chapter 3 required employment
duration data in which is necessary to know both the lengths of the job spells
and the starting dates of these spells. However, in the duration data available
for estimation, some of the job spells have a coarser measure of the starting
dates. In particular, for some job spells, the starting date is only known within
a year, and so the starting date of the job spell is only known to be contained in
an interval. As a consequence, the estimation procedure suggested in the
liter-ature (e.g. Klein and Moeschberger, 1997; Wooldridge, 2002) cannot be directly
implemented. Chapter 4 explores the finite sample properties of estimates of
the hazard function using the estimation procedure typically suggested in the
literature, but replacing the missing starting dates of the job spells with
im-puted starting dates. Three imputation methods are proposed, using: (i) the
lower bound of the interval, (ii) the midpoint of the interval, and (iii) the
up-per bound of the interval containing the starting date. A Monte Carlo analysis
is performed, and the results indicate that using the midpoint of the interval
outperforms the alternatives, particularly when the duration data has features
1.1
Bibliography
ACEMOGLU, D. AND J.-S. PISCHKE (1999): “The Structure of Wages and
In-vestment in General Training,”The Journal of Political Economy, 107, 539–
572.
ALBRECHT, J., L. NAVARRO, AND S. VROMAN (2006): “The Effects of Labor Market Policies in an Economy with an Informal Sector,” Discussion Paper
IZA DP No. 2141, The Institute for the Study of Labor (IZA).
——— (2009): “The Effects of Labour Market Policies in an Economy with an
Informal Sector,”The Economic Journal, 119, 1105–1129.
BECKER, G. S. (1993): Human Capital: A Theoretical and Empirical Analy-sis, with Special Reference to Education, Chicago: The University of Chicago
Press (for NBER), 3d ed.
BERG, J. AND D. KUCERA (2008): in In defence of labour market institutions : cultivating justice in the developing world, ed. by J. Berg and D. Kucera,
Basingstoke, Hampshire ; New York: Palgrave Macmillan, chap. 1, 1–8.
Markets in Latin America, Baltimore, MD: The Johns Hopkins University
Press.
KLEIN, J. P. AND M. L. MOESCHBERGER (1997): Survival analysis : tech-niques for censored and truncated data, New York: Springer.
MALONEY, W. F. AND J. SAAVEDRA-CHANDUVI (2007): “The Informal Sector:
What Is It, Why Do We Care, And How Do We Measure It?” in Informality:
Exit and Exclusion, Washington, D.C.: The World Bank, chap. 1, 21–41.
WOOLDRIDGE, J. M. (2002): Econometric Analysis of Cross Section and Panel
Chapter 2
Informal Labor Markets and
On-the-Job Training: Evidence
from Wage Data
2.1
Introduction
This paper explores the role of informal jobs in the formation of human capital
among young less-educated workers. An informal job is a job that does not
comply with labor regulations. As such, these jobs constitute what is typically
known as the informal sector. Traditionally, the informal sector is regarded as
the last resort for many workers rationed out of the protected and better paid
jobs in the formal sector (e.g. Ozorio de Almeida, Alves, and Graham, 1995),
or as the disadvantaged sector in a segmented labor market (e.g. Harris and
Todaro, 1970).
This traditional view of the informal sector, however, has been recently
of patterns of worker mobility across different sectors of employment, Maloney
argues that the existence of an informal labor market in Mexico is not
con-sistent with segmentation in the labor market. Instead, Maloney argues that
some workers may be attracted to informal jobs because of their greater
flex-ibility or possibilities for training. Another example is Amaral and Quintin
(2006). Following a theoretical approach, Amaral and Quintin show that some
of the differences between the formal and informal sectors that are typically
interpreted as evidence of barriers of entry into the formal sector, can be an
equilibrium outcome in a competitive labor market.
More recently, Arias and Khamis (2008) apply the methods developed in
Heckman, Urzua, and Vytlacil (2006) for models with essential heterogeneity
to examine the links between earnings performance and the choice of a
formal-salaried job, an informal-formal-salaried job, or self-employment.1 These methods
al-low Arias and Khamis to account for individuals’ observable and
unobserv-able characteristics that influence their decisions to take jobs in one of these
sectors. Their results indicate that there is little difference in the earnings
of formal-salaried workers and self-employed workers once sorting of workers
based on preferences and the returns to their observed and unobserved skills
are fully accounted for in the estimation, which is consistent with workers
choosing jobs based on their comparative advantages. In contrast, their
es-timates suggest a clear advantage both for self-employed and formal-salaried
1Models with essential heterogeneity are models where responses to interventions are
workers over informal-salaried workers, which is more consistent with the
ra-tioning of formal-salaried jobs and with segmentation in the labor market.
The results from household surveys provided by Arias and Maloney (2007)
seem to suggest that informal-salaried workers are rationed out of the
bet-ter paid formal-salaried jobs. Arias and Maloney provide results from
house-hold surveys in Argentina, Bolivia, Colombia, and the Dominican Republic that
ask employed individuals for the reasons and motivations for taking their
cur-rent jobs. The results indicate that a substantially higher fraction of
informal-salaried workers claimed to have opted for their current job “because they could
not find another job,” than the fraction of formal-salaried workers (see Table 2.9
of Arias and Maloney, 2007).
Despite this ongoing debate, informal jobs seem to play an important role in
the work lives of less-educated workers. Maloney (1999) claims that
informal-salaried jobs serve as the main point of entry for young poorly educated
work-ers into paid employment. Following Maloney, this paper focuses on the group
of young less-educated workers in Mexico and on their experience in the
in-formal sector. The paper explores the extent to which less-educated workers
in the informal sector experience wage growth and how wage growth in the
informal sector compares with wage growth in the formal sector. The basic
question is whether informal jobs offer wage growth and skill accumulation to
less-educated workers, and how it compares with formal jobs.
The panel structure of the survey allows for the construction of measures of
wage growth and continuing sector participation. The results indicate that
young less-educated workers in the informal sector experience faster wage
growth than their peers in the formal sector. Based on existing models of
on-the-job training (Becker, 1993; Acemoglu and Pischke, 1999), this result
sug-gests that informal jobs offer valuable general training opportunities to young
less-educated workers.
The literature provides little evidence on wage growth in the informal sector
or on how it compares with wage growth in the formal sector. There is some
evidence on the wage gain (or loss) from informality. For example, Maloney
(1999) and Alcaraz, Chiquiar, and Ramos-Francia (2011) provide estimates of
the wage change associated with transitions between the formal and informal
sectors in Mexico. The results in both studies indicate that informal-to-formal
transitions are associated with positive wage changes, while transitions in the
opposite direction are associated with negative wage changes. However, none of
these two studies provide evidence on wage growth experienced by workers in
the informal sector or how it compares to wage growth in the formal sector. The
present study contributes to the literature on the informal sector by providing
evidence and some suggestive ideas of the mechanisms behind these results.
The study is organized as follows. The following section presents the
house-hold survey used in this study and describes the sample and the criteria used
evidence from wage data is presented in Section 2.3 and the economic
interpre-tations of this evidence are presented in Section 2.4. The last section concludes
and discusses future research.
2.2
Data: The ENEU
The empirical analysis is based on data obtained from the Mexican National
Survey of Urban Employment, ENEU (its acronym in Spanish). The ENEU is
a rotating panel in which households are followed for 12 months, with periodic
visits every three months. Consequently, 20% of the sample is replaced every
quarter. The empirical analysis in this paper uses data from the third quarter
of 1994 to the fourth quarter of 2002; during this period, it is possible to identify
30 different panels, each composed of about 50,000 individuals.
The survey collects information for each individual in the household (e.g.
education, sex, position in the family, etc.), and for individuals aged 12 or older,
the survey also collects information about their working status and
character-istics of their main and secondary jobs. The information on working hours,
earnings, benefits, firm size, job position, and industry of occupation refer to
the job that the individual held the week prior to the interview. In cases in
which the respondent was temporarily absent from work during the week prior
to the interview, some information is still collected, but that information does
not correspond to the week of reference.2 As explained in Appendix A.1, this
information is used to impute wage data, when this information is missing.
During the period of observation, 47% of all respondents were males. Among
the male respondents, about 15% are between the ages of 16 and 20 years (see
Figure 2.1), and the average level of education is just below the mandatory
level in Mexico, which is grade 9. Figure 2.2 reveals that 34% of males ages 16
to 65 completed primary school (grade 6) and no more; 32% completed middle
school (grade 9) and no more; and 16% completed high school but did not go
on. About 75% of the male respondents are employees, including salaried and
piece-rate workers (see Figure 2.3).
2.2.1
The Sample
The analysis is restricted to males because men and women may have different
reasons for opting for a formal or informal job. In particular, one of the most
cited reasons by women for choosing an informal-salaried job is the flexibility to
work and perform their family duties (Arias and Maloney, 2007). Additionally,
the sample only includes salaried and piece-rate workers, not self-employed
or employers. However, as Figure 2.4 indicates, 93% of the male respondents
between the ages of 16 and 20 are either salaried or piece-rate workers, so the
vast majority of the respondents in the age group of interest are employees.
Moreover, the sample is restricted to individuals who are salaried or piece-rate
workers for the whole time that they are in the survey.
To focus on young workers, the sample only includes individuals of ages 16
to 20 inclusive. As explained below, at age 20, transitions between the formal
and informal sectors seem to slow down, and so this age is chosen as the upper
bound for the sample (see Figure 2.6). On the other hand, age 16 is chosen as
the lower bound because of the restrictions imposed by the labor legislation in
Mexico.3 To focus on less-educated individuals, the sample only includes
indi-viduals who are not enrolled in school and completed at most the mandatory
level of education in Mexico (grade 9).
The sample includes both full-time and part-time workers, although the
vast majority of individuals in the sample worked full time. In the sample,
5.56% worked less than 35 hours per week, 68.18% worked between 35 and 48
hours per week, and 26.25% worked more than 48 hours per week.
Finally, the top and bottom 1% of the real hourly earnings are dropped from
the sample. The top and bottom percentiles are generated within groups of
quarter-year-education, hence there is a different top and bottom percentile for
different education levels, on each quarter-year combination.
3Article 123-Section III of the Mexican Constitution prohibits the employment of individuals
2.2.2
Identification of Informal Sector Workers
How is an informal sector worker identified in the sample? In Mexico, labor
legislation mandates that all employers register their workers in the Mexican
Institute of Social Security, IMSS (its acronym in Spanish).4 This institution
provides a bundle of benefits to registered workers, including: health
insur-ance, day-care services for children, life insurinsur-ance, disability pensions,
work-risk pensions, sports and cultural facilities, retirement pensions, and housing
loans (Levy, 2007). Because both the employer and the worker contribute to
the IMSS fees, they are motivated not to register or be registered.5
Among employees, IMSS is the largest institution providing health
insur-ance. However, there are other institutions providing benefits similar to those
of IMSS. One of these institutions is ISSSTE, which provides a bundle of
ser-vices to state employees, including health insurance. As a result, in Mexico,
it is usually said that IMSS or ISSSTE is a benefit associated with one’s job.
If a worker declares to have health insurance provided by IMSS or ISSSTE,
it means that such a worker is a registered worker, and that his or her job
abides by the labor regulations. For this reason, the current study uses health
insurance provided by IMSS or ISSSTE as the distinguishing feature of formal
4Article 123-Section XXIX of the Mexican Constitution states that the Law of Social
Secu-rity is to the public benefit (Constitutional Congress, 1917). And Article 15-Section I of the Law of Social Security states that every employer must register their employees in the IMSS (Congress, 1995).
5The labor law mandates that if the worker earns less than three minimum wages, only
sector workers, or the lack of it as a distinguishing feature of informal sector
workers.
The ENEU’s questionnaire asks respondents for the benefits they get from
their jobs. The questionnaire provides a list of benefits that the respondent can
check. Among these benefits are: IMSS, ISSSTE, paid vacations, Christmas
bonus, and private health insurance or other medical services.6 The respondent
can check more than one benefit. For example, a respondent can check both
IMSS and “private health insurance or other medical services,” which means
that the worker is registered in the IMSS, but that also has private health
insurance provided by the employer. In this case, the respondent can either use
the medical services provided by IMSS or those provided by the private health
insurance, or complement the medical services of the private health insurance
with those of IMSS, or viceversa.
For the purpose of identifying informal sector workers, this study classifies
a respondent as an informal sector worker if the respondent is an employee and
neither IMSS nor ISSSTE is checked as an employee benefit. If the respondent
checks “private health insurance or other medical services,” but neither IMSS
nor ISSSTE is checked, the respondent will be classified as an informal sector
worker.
It is important to mention that in the questionnaire’s option “private health
insurance or other medical services,” among the “other medical services” are
the medical services for the military and PEMEX employees.7 As a
conse-quence, the algorithm used in this study to classify workers as informal will
classify military and PEMEX employees as informal sector workers, when in
fact they are formal sector workers. The proportion of respondents in the
sam-ple that does not check IMSS but checks the option of “private health insurance
or other medical services,” is 2.38%. Hence, the algorithm incorrectly classifies
workers as informal in less than 2.38% in the sample.
Figure 2.5 shows the number of workers employed in the formal and the
informal sectors by age at the time of the first interview. Notice that, for ages
16 and 17, the majority of less-educated workers are employed in the informal
sector, and that for older ages the proportion of workers employed in the formal
sector increases. This suggests that, as less-educated workers grow older, they
move from the informal into the formal sector.
In fact, Figure 2.6 shows that the likelihood of moving from the informal
into the formal sector increases during the first years of the workers’ careers.
The likelihood of moving in the opposite direction decreases monotonically,
sug-gesting that many workers make the transition from the informal to the formal
sector, but as they age, the likelihood that these workers move back to the
in-formal sector decreases. This patten of transitions between these two salaried
sectors suggests that young informal-sector workers may expect to eventually
move to the formal sector.
2.3
Evidence from Wage Data
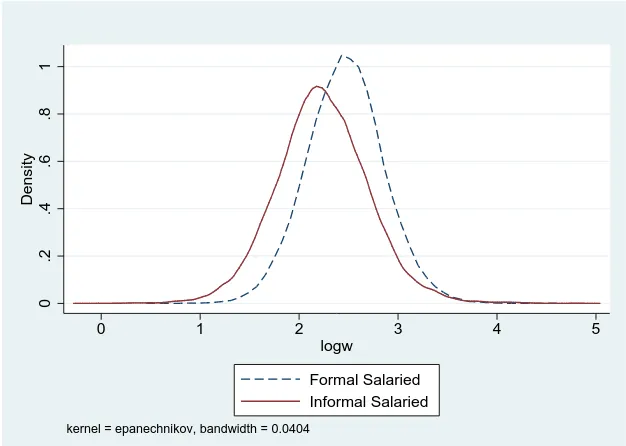
Figure 2.7 presents the kernel density of the log wages of workers in the
formal-salaried and informal-formal-salaried sectors in the sample. The kernel densities in
the figure are consistent with Arias (2007), who finds that informal-salaried
workers have an earnings disadvantage with respect to formal-salaried
work-ers at all points of the pay scale in the case of Argentina and Bolivia. Figure
2.7 suggests that this earnings disadvantage also seems to hold for the case of
young less-educated workers in Mexico.
Figure 2.8 presents the evolution of average hourly earnings in the formal
and informal sectors during the period of observation. Hourly earnings are in
Mexican Pesos of the second half of June 2002. Notice that, during the first
periods of observation, hourly earnings fell significantly due to the so-called
Tequila crisis. These two series also reflect the greater flexibility in adjusting
wages in the informal sector. Both series reach a minimum at the third quarter
of 1996, but the loss in hourly earnings in the formal sector is 28%, whereas,
in the informal sector, it is 40%. In addition, the growth in hourly earnings
between the third quarter of 1996 and the fourth quarter of 2002 is 41% in
the formal sector and 56% in the informal sector. Finally, notice that despite
the differences in flexibility in adjusting wages in each sector, both series tend
to move together, suggesting that they react similarly to changes in economic
Now, consider individual wages. Table 2.1 presents log-wage regressions
for each salaried sector on a set of worker and firm observable characteristics.
Most of the estimated coefficients have the expected sign. In both sectors, being
a middle-school graduate is much better than only being primary-school
grad-uate, however, the correlation between wages and graduation is stronger in
the informal sector, which suggests that for the kind of jobs that less-educated
workers access in each sector, skills are more important in the informal sector
than in the formal sector. Work experience is positively correlated with wages,
as expected.8 However, given the range of ages, there is not too much
curva-ture in this relationship, hence experience squared is not significant and was
not included in the regression. Noticeably, local unemployment has a negative
relation with wages in the formal sector, but not in the informal sector.
Notice that industry and firm size are important in explaining wages in
both sectors. Figures 2.9 and 2.10 show the distribution of workers in the
sam-ple among firms of different sizes and among different industries. Figure 2.9
indicates that formal-salaried workers in the sample are mostly employed in
firms with more than 250 employees, whereas, informal-salaried workers are
mostly employed in firms with 2 to 5 employees. The fact that some
informal-salaried workers are employed in firms with more than 250 employees reveals
the well known practice of some firms hiring part of their labor force
infor-mally.9 In such cases, it is typical for the transition from informal to formal to
8Experience is computed asmin{A−E−6, A−16},A=Age,E=Education.
9Even though this is a suggestion, it would be very hard to imagine a firm with more than
occur within the same firm. Similarly, Figure 2.10 indicates that the majority
of young less-educated workers employed formally work in the manufacturing
industry. Also, notice that the fraction of workers employed in construction and
in services is higher in the informal sector.
Now, consider wage growth. Figure 2.11 shows the kernel density of wage
growth in the sample. For both, one-quarter and two-quarter wage growth,
wage changes in both sectors are symmetric around 0, but wage growth in the
informal sector is more disperse than wage growth in the formal sector. The
higher dispersion of wage growth is consistent with the higher flexibility in
adjusting wages in the formal sector mentioned above.
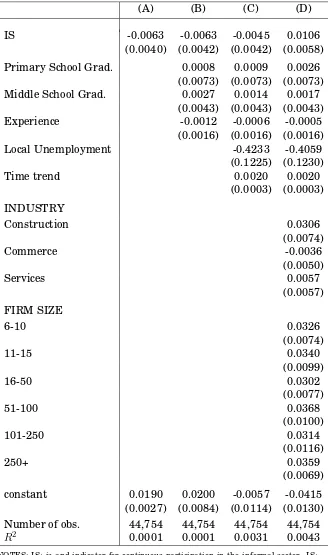
Equally important, consider wage growth conditional on worker and firm
characteristics. How does individual wage growth in the formal sector compare
to wage growth in the informal sector? This relation is explored by estimating
the following wage growth equation:
∆ lnwit=βISi+x′itγ+ξit (2.1)
where the time index is defined in quarters, ∆ lnwit = (lnwit−lnwit−1), ISi is a
dummy for informal-sector participation in two consecutive quarters, andxitis
a set of covariates such as those included in the low-wage regressions presented
in Table 2.1. The sample used to estimate equation (2.1) only includes workers
that are either in the informal sector for two consecutive quarters or are in the
formal sector for two consecutive quarters.
The parameter of interest is β, which indicates how wage growth of an
in-dividual employed in the informal sector compares to wage growth of an
indi-vidual employed in the formal sector with similarxit characteristics. Table 2.2
presents the results from estimation of (2.1) for different sets of covariates.
First, consider differences in raw wage growth when xit only includes an
intercept. In this case, presented in Column (A) of Table 2.2, the regression
re-sults indicate that wage growth in the formal sector is similar to wage growth
in the informal sector. Next, consider differences in wage growth when xit
in-cludes worker observable characteristics, presented in Column (B). The results
indicate that conditioning on education and experience yields the same
conclu-sion. Neither graduation from primary nor secondary school seem to have a
significant effect on wage growth. This suggests that educational attainment
does not appear to affect wage growth for these workers. Similarly, the effect
of experience on wage growth is insignificant.
As Figure 2.8 suggests, it is important to control for different economic
con-ditions over time. To control for these factors, Column (C) presents estimation
results including the level of local unemployment and a time trend. Both of
theses covariates have significant relationships with wage growth. However,
wage growth difference between the two sectors is still insignificant. The
es-timates indicate that workers in places with higher local unemployment
economic conditions that affect both sectors. As Figure 2.8 suggests, the
eco-nomic environment seemed to improve for most of the period of observation.
This improvement is reflected in the positive estimate for the time trend.
Finally, Column (D) also controls for characteristics of the firm where the
worker is employed by including industry and firm size indicators. The
re-sults indicate that industry and firm size are important determinants of wage
growth. Furthermore, when controlling for these firm characteristics, the
dif-ference in wage growth between the formal and informal sectors becomes
posi-tive and significant, indicating that wage growth is faster in the informal sector
than in the formal sector.
Industry and firm size indicators are intended to control for differences in
firm productivity. If firms of different sizes, or operating in different industries,
are systematically different with respect to productivity, then these differences
in productivity may lead to differences in wage growth as well as wage levels.
One could argue that the larger the firm is, the more productive it is, for
exam-ple, because larger firms invest more in technology than small firms, and that
firms using more technology may require more worker training which will
re-sult in higher wage growth. Similarly, one could argue that firms in industries
with higher capital to labor ratio could systematically be more productive than
firms in other industries.
Recall that formal sector workers are mostly employed in large firms, whereas
(see Figure 2.9). Similarly, the fraction of workers employed in the
manufactur-ing and commerce industries is higher among formal sector workers, whereas,
the fraction of workers employed in the construction and services industries is
higher among informal sector workers (see Figure 2.10).
Table 2.3 breaks down the estimation of the wage growth equation by
indus-try and by firm size. The numbers in the table give, for different specifications,
the estimate of β in equation (2.1), which is the coefficient of the indicator of
informal-sector participation in two consecutive quarters, ISi. The first column
indicates that, irrespective of industry, in medium-size firms, informal sector
workers experience faster wage growth than formal sector workers, however,
the difference in wage growth is not statistically significant for any other firm
size. The last two lines indicate that, irrespective of firm size, in the
construc-tion and in the services industries, formal sector workers experience faster
wage growth than informal sector workers. Breaking down the estimation by
industry and firm size, the results indicate that in small and medium-size firms
(6 to 10 and 15 to 60 employees), informal sector workers experience faster
wage growth than formal sector workers in the construction and service
indus-tries.
Notice that none of these specifications control for occupation. It is also
pos-sible that less-educated workers in small informal-sector firms are employed in
more productive occupations, say mason’s apprentice, than less-educated
that the log-wage equations presented in Table 2.1 suggest that for the kind
of jobs that less-educated workers access in each sector, skills seem to be more
important in the informal sector. Hence, one might expect wages to grow faster
with the acquisition of new skills for less-educated workers in the informal
sector than for their peers in the formal sector.
A similar wage growth equation was estimated with ∆2lnwit = (lnwit − lnwit−2) and so the indicator ISi is a dummy for sector participation in three
consecutive quarters. Now, the sample used to estimate equation (2.1) only
includes workers that are either in the informal sector for three consecutive
quarters or are in the formal sector for three consecutive quarters. Table 2.4
presents the estimation results for this specification. Overall, the results and
the conclusions are very similar to the one-quarter wage growth: conditional on
worker and firm observable characteristics, wages in the informal sector grow
faster than wages in the formal sector.
Finally, notice that in all specifications of Tables 2.2 and 2.4, the R2 is very
small, and so a large portion of the variation in wage growth is not explained
by the covariates included in the regression. If the omitted variables are
sys-tematically correlated with informal or formal sector participation, then the
indicator for continuous informal sector participation will pick up these
corre-lation.
Similarly, there is no explicit treatment of unobserved heterogeneity or
could be biased. However, if unobserved heterogeneity, or “ability,” has a
simi-lar effect on wages in two or three consecutive quarters, then its effect should
cancel out when looking at wage growth. Notice that educational achievement
does not have a significant effect on wage growth, and so it seems unlikely that
unobserved heterogeneity would have a crucial role, given the strong
correla-tion between educacorrela-tion and unobserved heterogeneity (or ability). With respect
to worker selection, one can easily argue that those workers continuously
em-ployed in the informal sector are negatively selected, and so the estimate of the
coefficient of ISi may be downward biased. In this case, we can consider it as a
lower bound for the trueβ.
2.4
Economic Interpretations of Evidence
This section argues that this evidence is consistent with general human capital
investment on-the-job.10 First, consider the model of general on-the-job
train-ing in a competitive labor market provided by Becker (1993). In such a labor
market, wages paid by a firm are determined by the productivity in other firms.
Productivity increases with general training equally in the firm providing it as
well as in other firms. Consequently, firms cannot capture any of the returns
from the investment in general training because the worker can move freely
to another firm once training is finished. As a result, workers capture all the
10General training increases a worker’s productivity at any firm. Contrary to firm-specific
returns from that investment and bear the cost of general training.
Acemoglu and Pischke (1999) show that, if frictions in the labor market
re-sult in acompressed wage structure, firms find it profitable to invest in training,
even when training involves general skills. In a compressed wage structure,
productivity in the current firm increases more with training than in other
firms. Hence, firms’ profits increase with training, as a consequence firms are
willing to sponsor general training.
Acemoglu and Pischke (1999) also provide examples of mechanisms that
produce a compressed wage structure, inducing firms to sponsor general
train-ing. Some of these mechanisms include search frictions that generate job
search costs, asymmetric information about the worker’s ability,
complemen-tarity between firm-specific skills and general skills, and labor market
institu-tions, such as minimum wages and unions. Equally important, Acemoglu and
Pischke show that increasing wage compression leads to more firm-sponsored
training.
The informal labor market is likely to be more competitive than the formal
labor market. This feature of the labor market was exploited by Zenou (2008).
Zenou develops a model of the informal and formal sectors in which the
for-mal labor market is characterized by search frictions, while the inforfor-mal labor
market is competitive. Equally important are frictions generated by labor
insti-tutions. One of the most cited causes of large informal sectors is the existence
Enste, 2000). This link between labor regulations and the existence of informal
sectors has been studied and documented. For example, Rauch (1991) develops
a model in which the size of the informal sector is directly related to the
de-gree of labor regulation.11 Bosch, Goni, and Maloney (2007) find that the main
driving force behind the increase in informality in Brazil during the 1990s was
the reduction of formal sector hirings mainly explained by changes in labor
market legislation. More recently, Albrecht, Navarro, and Vroman (2009) built
an equilibrium search and matching model to study the effects of changes of
severance and payroll taxes; their simulations suggest that increases in both
severance and payroll taxes shift employment from the formal to the informal
sector.
Wage compression in the formal labor market due to frictions implies that
firms reap some of the returns from training and pay at least part of the cost of
training. The informal labor market is more competitive, hence workers reap
the returns from training and bear the cost of training. As a consequence, even
with the same amount of investment on training in both sectors, wage growth
should be faster in the informal sector than in the formal sector.
It is also possible that informal sector workers invest more in human capital
than formal sector workers. Figures 2.7 and 2.8 show that, on average, wages
in the informal sector are lower than in the formal sector. The difference in
intercepts in the log-wage equations in Table 2.1 suggests that there is still
11Labor regulation in Rauch (1991) is implemented as a minimum wage. Acemoglu and
a gap after controlling for worker and firm observable characteristics. Finally,
Figure 2.6 suggests that, during the first years of the workers’ careers, workers
are more likely to move from the informal to the formal sector as they age. If
wages and productivity are lower in the informal sector and informal sector
workers expect to move to the formal sector eventually, investment in human
capital may be greater in the informal sector than in the formal sector. That
is, if workers face a lower price for their skills in the informal sector in the
present, and expect a higher price for their skills when they move to the formal
sector in the future, then the opportunity cost of human capital investment
is lower in the informal sector, which will induce informal sector workers to
invest more in human capital. Formal sector workers, on the other hand, do
not face this lower opportunity cost.
Faster wage growth in the informal sector could also arise in a model of
on-the-job training with different levels of specificity of training in the formal and
informal sectors. In Becker (1993), when firms provide firm-specific on-the-job
training, firms bear the cost of training because if the worker moves to another
firm, all productivity gains from training will be lost. If most of the training
in the formal sector involves firm-specific human capital, whereas most of the
training in the informal sector involves general human capital, wages in the
2.5
Final Remarks
The traditional view of the informal sector assumes that jobs in this sector offer
little beyond a make-shift or temporary job for workers that are waiting for a
“better” formal sector job. However, this study shows that informal jobs are
not dead end jobs, and that these jobs appear to offer wage growth similar to
formal sector jobs for young less-educated workers entering the labor market.
The present study provides an analysis of the informal and formal sectors
using data from 1994 to 2002 from the Mexican National Survey of Urban
Employment, ENEU. The analysis revealed that less-educated workers start
their careers in the informal sector, and move to the formal sector as they grow
older. More important, it is found that for young less-educated workers, wages
in the informal sector grow faster than wages in the formal sector, conditional
on worker and firm observable characteristics.
On the assumption that the labor market in the informal sector is more
com-petitive than its counterpart in the formal sector, models of on-the-job training
in competitive and in non-competitive labor markets predict that formal
sec-tor employers sponsor at least part of the training costs, while informal secsec-tor
employers pass these costs onto the workers. The evidence from wage growth
data presented in this paper is consistent with these theories of human capital
accumulation, which, in turn, supports the possibility that young less-educated
Informal-salaried workers may even invest more in human capital than
formal-salaried workers. This is because informal-salaried workers have lower
wages and expect to eventually move to a formal-salaried job. Another
mecha-nism consistent with the evidence on wage data is based on systematic
differ-ences in the specificity of training between the informal and the formal sectors.
Even though all these mechanisms lead to the same conclusion in terms of
investment in human capital in the informal sector, they may have different
implications for the design of labor market policies, and so ideally one could
distinguish between them. That exercise would require more than just
analyz-ing wage data.
If informal-salaried jobs do indeed provide provide training to young
less-educated workers, those who start in the informal sector and move to the
for-mal sector later on in their careers, will have a career path different from the
career path of less-educated workers who start in the formal sector. These
differences could be used to distinguish between the proposed mechanisms
dis-cussed above. However, to study these differences, it is necessary to have access
to a longer panel than the one used in this paper, which only follows individuals
during 12 months.
Equally important, if informal jobs provide training opportunities to young
less-educated workers, then it is possible that these workers opt for an informal
job instead of queuing longer for a formal job, in order to accumulate skills.
costs could help in closing the gap between earnings in the formal and informal
sectors, which seem to persist after controlling for observable characteristics.
It is true that this study only explores one possible role of the informal
sector in the careers of less-educated workers, human capital accumulation.
However, the informal sector may have other roles. For example, the informal
sector could play the role of a screening device. That is, suppose that when
less-educated workers enter the labor market their abilities are unknown, and so,
to minimize firing costs, formal sector firms refuse to hire them. If the informal
sector offers job opportunities to young less-educated workers, and their ability
is revealed while working there, then formal sector firms could use the worker’s
trajectory in the informal sector to learn the worker’s ability and hire from the
pool of informal sector workers whose ability has been revealed.
Chapter 3 considers two roles of the informal sector: human capital
accu-mulation and screening of workers’ abilities. Based on the implications of a
search and matching model, and on the estimation of the hazard function from
informal to formal sectors, the author concludes that the main role of informal
jobs is to serve as a screening mechanism that solves an information problem
about workers’ abilities. Although this result does not rule out the possibility
of workers accumulating skills in the informal sector it has important
impli-cations for the design of labor market policies directed to the informal labor
2.6
Bibliography
ACEMOGLU, D., AND J.-S. PISCHKE (1999): “The Structure of Wages and
In-vestment in General Training,” The Journal of Political Economy, 107(3),
539–572.
ALBRECHT, J., L. NAVARRO, AND S. VROMAN (2009): “The Effects of Labour Market Policies in an Economy with an Informal Sector,”The Economic
Jour-nal, 119(539), 1105–1129.
ALCARAZ, C., D. CHIQUIAR, AND M. RAMOS-FRANCIA (2011): “Wage differen-tials in Mexico’s urban labor market,”Economics Bulletin, 31(3), 2500–2508.
AMARAL, P. S., AND E. QUINTIN (2006): “A competitive model of the informal sector,”Journal of Monetary Economics, 53, 1541–1553.
ARIAS, O. (2007): “Informality, Earnings, and Welfare,” in Informality: Exit and Exclusion, chap. 3, pp. 79–100. The World Bank, Washington, D.C.
ARIAS, O., AND M. KHAMIS (2008): “Comparative Advantage, Segmentation and Informal Earnings: A Marginal Treatment Effects Approach,”
ARIAS, O., AND W. F. MALONEY (2007): “The Raz´on de Ser of the Informal Worker,” inInformality: Exit and Exclusion, chap. 2, pp. 43–78. The World
Bank, Washington, D.C.
BECKER, G. S. (1993): Human Capital: A Theoretical and Empirical Analy-sis, with Special Reference to Education. Chicago: The University of Chicago
Press (for NBER), 3d edn.
BOSCH, M., E. GONI, AND W. F. MALONEY (2007): “The Determinants of
Ris-ing Informality in Brazil: Evidence from Gross Worker Flows,” WorkRis-ing
Pa-per 4375, The World Bank.
CONGRESS (1970): Federal Labor Law. Mexico, D.F.
CONGRESS (1995): Law of Social Security. Mexico, D.F.
CONSTITUTIONAL CONGRESS (1917): Political Constitution of the United
Mex-ican States. Constitutional Congress, Mexico, D.F.
HARRIS, J. R., ANDM. P. TODARO (1970): “Migration, Unemployment and
De-velopment: A Two-Sector Analysis,” The American Economic Review, 60(1),
126–142.
HECKMAN, J. J., S. URZUA, ANDE. VYTLACIL (2006): “Understanding
Instru-mental Variables in Models with Essential Heterogeneity,” Review of
LEVY, S. (2007): “Can Social Programs Reduce Productivity and Growth? A Hypothesis for Mexico,” Mimeo.
MALONEY, W. F. (1999): “Does Informality Imply Segmentation in Urban La-bor Markets? Evidence from Sectoral Transitions in Mexico,” The World
Bank Economic Review, 13(2), 275–302.
OZORIO DE ALMEIDA, A. L., L. ALVES, AND S. E. M. GRAHAM (1995): “Poverty, Deregulation, and Employment in the Informal Sector of Mexico,”
ESP Discussion Paper 54, Education and Social Policy Department, World
Bank, Washington, DC.
RAUCH, J. E. (1991): “Modeling the informal sector formally,” Journal of De-velopment Economics, 35(1), 33–47.
SCHNEIDER, F., AND D. H. ENSTE (2000): “Shadow Economies: Size, Causes,
and Consequences,”Journal of Economic Literature, 38(1), 77–114.
ZENOU, Y. (2008): “Job search and mobility in developing countries. Theory
Figure 2.1: Age Distribution in the ENEU
12−16
16−20
20−30 30−40
40−50
50−65
Source: ENEU 3:1994 - 4:2002. Includes only males ages 12 to 65
Figure 2.2: Education Distribution in the ENEU
Primary
Middle School High School
College
Figure 2.3: Job Position Distribution in the ENEU
employer
self−employed
piece−rate salaried
Source: ENEU 3:1994 - 4:2002. Includes only males ages 12 to 65
Figure 2.4: Job Position Distribution Ages 16 - 20
employer
self−employed
piece−rate
salaried
Figure 2.5: Formal Salaried and Informal Salaried Workers by Age
0
1,000
2,000
3,000
4,000
16 17 18 19 20
Informal Salaried Formal Salaried
Source: ENEU 3:1994-4:2002. Males only, with 0 to 9 years of education and with no changes in the level of education.
Figure 2.6: Worker Transitions by Age as a Fraction of Initial Sector
4
6
8
10
12
%
20 30 40 50 60 70
age
Formal −−> Informal Informal −−> Formal
Figure 2.7: Kernel Density of Log-Wages in the Sample
0
.2
.4
.6
.8
1
Density
0 1 2 3 4 5
logw
Formal Salaried Informal Salaried
kernel = epanechnikov, bandwidth = 0.0404
Source: Author’s calculations using ENEU. Includes only males ages 16 to 20 with education less or equal to 9 years and with no changes in education level.
Figure 2.8: Average Wage over Time by Sector in the Sample
8
10
12
14
16
Hrly Wage
1994q3 1996q3 1998q3 2000q3 2002q3
quarter
Formal Salaried Informal Salaried
Figure 2.9: Firm Size Distribution in the Sample
(a) Formal Sector
2−5 6−10
11−15
16−50
51−100 101−250 250+
(b) Informal Sector
2−5
6−10 11−15
16−50 51−100 101−250
250+
Figure 2.10: Industry Distribution in the Sample
(a) Formal Sector
Manufacturing
Construction Commerce
Transportation Services
(b) Informal Sector
Manufacturing
Construction
Commerce Transportation
Services
Figure 2.11: Kernel Density of Wage Growth in the Sample
(a) One-Quarter
0
.5
1
1.5
Density
−4 −2 0 2 4
ln wt − ln wt−1
Formal Salaried Informal Salaried
kernel = epanechnikov, bandwidth = 0.0361
(b) Two-Quarters
0
.5
1
1.5
Density
−4 −2 0 2 4
ln wt − ln wt−2
Formal Salaried Informal Salaried
kernel = epanechnikov, bandwidth = 0.0420
Table 2.1: Log-Wage Regressions by Sector
Informal Sector Formal Sector
Primary School Grad. 0.0759 0.0189
(0.0072) (0.0082)
Middle School Grad. 0.0375 0.0277
(0.0050) (0.0039)
Experience 0.0471 0.0304
(0.0017) (0.0015)
Local Unemployment -0.1861 -1.2361
(0.1375) (0.1161)
Time trend 0.0085 0.0077
(0.0003) (0.0003)
INDUSTRY
Construction 0.0783 0.0503
(0.0073) (0.0082)
Commerce -0.0481 -0.1151
(0.0063) (0.0043)
Services -0.0073 -0.0647
(0.0065) (0.0057)
FIRM SIZE
6-10 0.0873 0.0317
(0.0068) (0.0097)
11-15 0.1315 0.0543
(0.0098) (0.0108)
16-50 0.1150 0.0468
(0.0084) (0.0084)
51-100 0.1116 0.0754
(0.0150) (0.0092)
101-250 0.1092 0.0757
(0.0240) (0.0100)
250+ 0.2019 0.1352
(0.0086) (0.0077)
constant 1.8550 2.1988
(0.0122) (0.0132)
Number of obs. 38904 42880
R2 0.0764 0.0974
NOTES: Primary School Grad.=I{E≥6}, and Middle School Grad.=I{E≥
Table 2.2: One-Quarter Wage Growth Regressions
(A) (B) (C) (D)
IS -0.0063 -0.0063 -0.0045 0.0106
(0.0040) (0.0042) (0.0042) (0.0058)
Primary School Grad. 0.0008 0.0009 0.0026
(0.0073) (0.0073) (0.0073)
Middle School Grad. 0.0027 0.0014 0.0017
(0.0043) (0.0043) (0.0043)
Experience -0.0012 -0.0006 -0.0005
(0.0016) (0.0016) (0.0016)
Local Unemployment -0.4233 -0.4059
(0.1225) (0.1230)
Time trend 0.0020 0.0020
(0.0003) (0.0003) INDUSTRY Construction 0.0306 (0.0074) Commerce -0.0036 (0.0050) Services 0.0057 (0.0057) FIRM SIZE 6-10 0.0326 (0.0074) 11-15 0.0340 (0.0099) 16-50 0.0302 (0.0077) 51-100 0.0368 (0.0100) 101-250 0.0314 (0.0116) 250+ 0.0359 (0.0069)
constant 0.0190 0.0200 -0.0057 -0.0415
(0.0027) (0.0084) (0.0114) (0.0130)
Number of obs. 44,754 44,754 44,754 44,754
R2 0.0001 0.0001 0.0031 0.0043
NOTES: ISiis and indicator for continuous participation in the informal sector. ISi = 1
Table 2.3: Wage Growth Regressions: Coefficient of Informal Sector Participa-tion for Two Consecutive Quarters
Industry
Firm Size All Industries Manufacturing Construction Services Commerce
2-5 0.015 -0.012 -0.040 0.012 0.032
(0.015) (0.030) (0.059) (0.031) (0.023)
6-10 0.004 -0.007 0.024 0.063∗∗ -0.033
(0.014) (0.028) (0.052) (0.031) (0.023)
11-15 0.009 0.010 -0.036 0.000 0.011
(0.018) (0.029) (0.063) (0.054) (0.031)
16-50 0.028∗∗ 0.030 0.076∗ 0.057 -0.013
(0.013) (0.019) (0.041) (0.038) (0.024)
51-100 0.012 0.026 0.044 0.004 -0.026
(0.021) (0.031) (0.059) (0.067) (0.040)
101-250 0.008 0.049 0.005 -0.079 -0.016
(0.036) (0.049) (0.108) (0.118) (0.084)
250+ 0.008 0.018 -0.085 0.009 -0.033
(0.010) (0.029) (0.068) (0.017) (0.029)
All Firm Sizes 0.001 -0.036∗∗ -0.015∗ 0.000
(0.007) (0.016) (0.008) (0.011)
NOTES: All regressions include the same covariates as the regression in column (D) of Table 2.2. Standard errors of estimates are in parenthesis.
Table 2.4: Two-Quarters Wage Growth Regressions
(A) (B) (C) (D)
IS -0.0050 -0.0049 -0.0012 0.0168
(0.0057) (0.0060) (0.0060) (0.0087)
Primary School Grad. -0.0081 -0.0083 -0.0065
(0.0107) (0.0107) (0.0107)
Middle School Grad. 0.0110 0.0088 0.0092
(0.0062) (0.0061) (0.0062)
Experience -0.0030 -0.0021 -0.0020
(0.0024) (0.0024) (0.0024)
Local Unemployment -1.0516 -1.0283
(0.1734) (0.1741)
Time trend 0.0037 0.0037
(0.0004) (0.0004) INDUSTRY Construction 0.0255 (0.0108) Commerce -0.0165 (0.0071) Services 0.0019 (0.0082) FIRM SIZE 6-10 0.0289 (0.0109) 11-15 0.0010 (0.0147) 16-50 0.0369 (0.0114) 51-100 0.0365 (0.0146) 101-250 0.0249 (0.0166) 250+ 0.0364 (0.0101)
constant 0.0316 0.0411 0.0035 -0.0276
(0.0039) (0.0126) (0.0167) (0.0191)
Number of obs. 22,839 22,839 22,839 22,839
R2 0.0000 0.0002 0.0121 0.0136
NOTES: ISiis and indicator for continuous participation in the informal sector. ISi = 1
Chapter 3
The Role of the Informal Sector
in the Early Careers of
Less-Educated Workers
3.1
Introduction
The informal sector is an important feature of labor markets in developing
countries. This sector, composed of all jobs not complying with labor
regula-tions, occupies a significant portion of these countries’ labor markets. In Latin
America and the Caribbean, the fraction of workers employed in the informal
sector ranges from 15% to 62% (see Figure 3.1). Jobs in this sector employ
the majority of young unskilled workers usually paying very low wages, not
to mention the lack of health and employment insurance enjoyed by workers
holding formal sector jobs.
The presence of large informal sectors has typically been a concern for