Electronic Thesis and Dissertation Repository
8-21-2014 12:00 AM
Development and Assessment of a Virtual Reality Forklift
Development and Assessment of a Virtual Reality Forklift
Simulator as a Research Tool to Study Whole-Body Vibration
Simulator as a Research Tool to Study Whole-Body Vibration
Peter Wegscheider
The University of Western Ontario
Supervisor
Dr. James P. Dickey
The University of Western Ontario Graduate Program in Kinesiology
A thesis submitted in partial fulfillment of the requirements for the degree in Master of Science © Peter Wegscheider 2014
Follow this and additional works at: https://ir.lib.uwo.ca/etd
Recommended Citation Recommended Citation
Wegscheider, Peter, "Development and Assessment of a Virtual Reality Forklift Simulator as a Research Tool to Study Whole-Body Vibration" (2014). Electronic Thesis and Dissertation Repository. 2405.
https://ir.lib.uwo.ca/etd/2405
This Dissertation/Thesis is brought to you for free and open access by Scholarship@Western. It has been accepted for inclusion in Electronic Thesis and Dissertation Repository by an authorized administrator of
by
Peter Wegscheider
Graduate Program in Kinesiology
A thesis submitted in partial fulfillment of the requirements for the degree of
Masters in Biomechanics
The School of Graduate and Postdoctoral Studies The University of Western Ontario
London, Ontario, Canada
ii
Abstract
Operators of forklifts and other heavy machinery are exposed to whole-body vibration as a result of their daily work routine. Lower-back pain and other health risks have been linked to whole-body vibration exposure. A virtual reality simulator has been developed as a tool to study the effects of whole-body vibration and other risk factors associated with forklift operation. This study aims to demonstrate that the vibration exposure during simulation can be adjusted, and to compare the chassis accelerations to those of a real forklift. A sensitivity analysis examined three key parameters to determine their effect on the vibration properties of the simulator chassis. A comparison of field chassis accelerations during a standard work task revealed that the simulator better replicated accelerations for events involving transient surface irregularities, but the simulator had smaller vibrations when traveling across the relatively smooth warehouse floor. The simulator in its current state is a functional tool for evaluating the ergonomics of forklifts; however, further adjustment is required before the system can be considered a viable platform for whole-body vibration research.
Keywords
iii
Acknowledgments
I would to thank my supervisor, Dr. James P. Dickey, for providing the opportunity to be a part of his research team. His mentorship throughout my Master’s degree has be a vital component of my personal growth both as an academic and as an individual.
I addition I would like to thank the following groups and individuals for their contributions to both my thesis and my experience as a graduate student:
My friends and colleagues in the Joint Biomechanics Lab for all of their support with my work, as well as the opportunity to be involved in research fields beyond my thesis.
Nelson Andre who was integral in the development of the simulator program.
Dr. Mike Katchabaw for lending the Oculus Rift head-mounted display to our VR project.
iv
Table of Contents
Abstract ... ii!
Acknowledgments... iii!
Table of Contents... iv!
List of Tables ... vi!
List of Figures ... vii!
List of Appendices ... ix!
Preface... x!
1! Introduction... 1!
1.1! History of lift trucks and whole-body vibration ... 1!
1.2! Virtual reality simulation in research... 4!
1.3! Simulator Development ... 5!
1.3.1! Virtual Truck and Environment ... 7!
1.3.2! Simulator Hardware ... 8!
1.4! Purpose... 11!
2! Methodology ... 12!
2.1! Field data... 12!
2.1.1! Instrumentation ... 12!
2.1.2! Test Track: EN 13059... 13!
2.1.3! Field Work Task ... 15!
2.2! Virtual reality simulator data ... 16!
2.2.1! Instrumentation ... 16!
2.2.2! Sensitivity Analysis ... 17!
2.2.3! Field vs. Simulator Comparison ... 18!
v
3.2! Field vs. Simulator Comparison ... 22!
4! Discussion ... 27!
4.1! Sensitivity Analysis ... 28!
4.2! Field vs. Simulator Comparison ... 30!
5! Conclusions... 34!
5.1! Future Development... 34!
6! References... 35!
Appendices... 40!
vi
List of Tables
Table 1: Forklift classes, engine types and descriptions (OSHA, n.d.) ... 2!
Table 2: ISO 2631-1 (1997) Health Guidance Caution Zones for 8 hour vibration exposure.. 3!
Table 3: Work task segments, beginning at start position. Refer to Figure 9 for a graphical representation of the work task. ... 15!
Table 4: Baseline and final adjusted values for the three parameters that were investigated in the sensitivity analysis. The adjusted values were used for comparisons between the
simulation and field trials... 18!
vii
List of Figures
Figure 1: Basic virtual reality simulator concept flow-chart. ... 6!
Figure 2: Data processing flowchart illustrating how virtual truck motion is translated to robot position coordinates... 6!
Figure 3: A) Field tested Toyota 7FGCU25 with QFV mast, B) replica truck used during virtual reality simulation. ... 7!
Figure 4: Simulator cart controls including: A) steering wheel, B) hoist lever, C) throttle & brake pedals, and D) transmission switch... 9!
Figure 5: A) Virtual reality simulator cart mounted on the robot platform B) parallel robot platform with cover and cart removed. ... 9!
Figure 6: Virtual reality visual feedback system including A) rigid body for tracking head position and orientation, and B) Oculus Rift head-mounted display... 10!
Figure 7: Data acquisition set-up for recording forklift vibrations including: A) DataLOG recording unit, B) seat pan form with embedded accelerometer, C) mechanical event marker, D) chassis accelerometer with magnetic mount... 13!
Figure 8: Birds-eye view of EN 13059 test track with dimensions and cross-section of steel plate obstacles. ... 14!
Figure 9: A graphical birds-eye view of the unloading work task wherein palletized rain barrels were moved from the transport trailer to an aisle in the warehouse. Refer to Table 3 for a breakdown of the task... 15!
Figure 10: Simulator cart accelerometer placement: A) rubber seat pan form with embedded accelerometer, B) chassis accelerometer adhered to the platform surface. ... 16!
viii
chassis RMS acceleration of the simulator chassis (r2 = 0.927). ... 20!
Figure 13: Negative relationship between suspension travel distance and the
RMS acceleration of the simulator chassis (r2 = 0.842). ... 21!
Figure 14: Negative relationship between damper strength and the RMS acceleration of the simulator chassis (r2 = 0.316). ... 21!
Figure 15: Simulator chassis RMS accelerations for subjects with different body masses performing the EN 13059 driving task. ... 22!
Figure 16: Chassis RMS accelerations for the real forklift and the simulator performing the EN 13059 test track. Field accelerations were significantly larger than the accelerations measured from the simulator. ... 23!
Figure 17: Seat pan RMS accelerations for subjects with different body masses performing the EN 13059 driving task. ... 24!
Figure 18: Seat pan RMS accelerations for the real forklift and the simulator performing the EN 13059 test track. Field accelerations were significantly larger than the accelerations measured from the simulator. ... 25!
Figure 19: Field and simulator chassis accelerations for different segments of a standard unloading work task. Refer to Table 3 for segment descriptions. The unloading task was performed once; plotted RMS accelerations are single values. ... 26!
ix
List of Appendices
x
Preface
1
Introduction
Lift trucks are used in workplaces all around the world, with the primary purpose of moving palletized loads around a workplace. Forklifts have greatly reduced the physical strain of heavy lifting for workers and increased productivity. The use of these machines however has introduced new physical stressors on operators which place them at risk for lower-back disorders. Whole-body vibration exposure from standing or sitting on a vibrating surface has been linked to the development of lower-back pain and other physiological risks. Vehicle operators often adopt awkward postures in order to safely maneuver their vehicle and payload around the work site. Repeated twisting and bending of the trunk and neck is necessary to view the immediate surrounding environment (Eger et al., 2010).The combination of compromised postures with whole-body vibration place lift truck operators at elevated risk of injury. Virtual reality simulation is a method often used in vehicle research as it provides a safe and controllable testing environment (Tichon & Burgess-Limerick, 2011). This project aims to create and assess a virtual reality driving simulator that can be used as a platform to study workplace hazards of lift truck operators and, in the future, other types of heavy machinery from sectors such as forestry, construction, agricultural and mining vehicles.
1.1 History of lift trucks and whole-body vibration
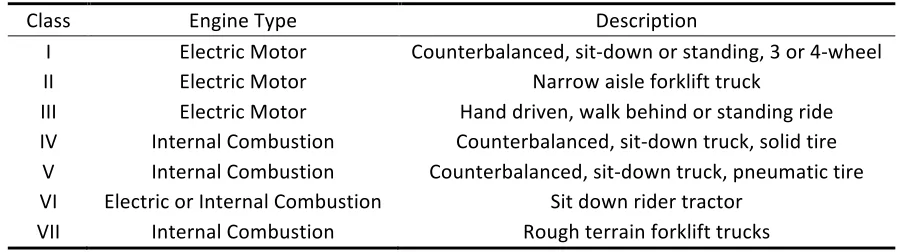
Forklifts are used in many industries as tools for moving heavy palletized loads. Originating as a tractor with a lifting attachment, the forklift has evolved to take many forms. The Occupational Safety and Health Administration identifies seven classes of forklifts ranging from hand driven units, to electric powered units, and trucks with internal combustion engines (OSHA, n.d.; Table 1). For the purposes of this paper, the term “forklift” refers to machines in all seven classes, and the term “lift truck” refers specifically to ride on models of forklifts. Each class is optimized for a certain working environment dictated mainly by the loads they carry and the characteristics of the
across smooth, dry cement in warehouse environments. Because of the heavy loads that they are lifting, and the relatively smooth warehouse floors on which they are driving, these trucks are equipped with solid rubber tires and little suspension. These attributes make Class IV trucks ideal for low-clearance applications such as moving through doorways and loading/unloading transport trailers. The solid rubber tires provide a stable base of support for the truck during driving and loading/unloading operations. Lateral stability is particularly important for forklifts negotiating a turn. If a lift truck operator attempts to corner at high velocity, the lift truck may lose lateral stability and tip over onto its side (Lemerle et al., 2011). This type of accident can be fatal to the operator or others in the surrounding area (Larsson & Rechnitzer, 1994). Rubber tires provide smooth stable traction with the floor; however they lack the vibration damping and surface conforming qualities of a pneumatic tire.
Table 1: Forklift classes, engine types and descriptions (OSHA, n.d.)
Class! Engine!Type! Description!
I! Electric!Motor!! Counterbalanced,!sit9down!or!standing,!3!or!49wheel!
II! Electric!Motor! Narrow!aisle!forklift!truck!
III! Electric!Motor! Hand!driven,!walk!behind!or!standing!ride! IV! Internal!Combustion! Counterbalanced,!sit9down!truck,!solid!tire!
V! Internal!Combustion! Counterbalanced,!sit9down!truck,!pneumatic!tire! VI! Electric!or!Internal!Combustion! Sit!down!rider!tractor!
VII! Internal!Combustion! Rough!terrain!forklift!trucks!
In other vehicles, pneumatic tires and spring-damper suspension systems are used to attenuate the vibrations caused by traveling over irregularities in the ground surface (Sherwin et al., 2004). With proper tuning these systems can greatly reduce vibration exposure to the vehicle operator (Lemerle et al., 2002). Irregularities in the surface of a warehouse floor are often small; however, the potential for drivers to be exposed to dangerous levels of whole-body vibration is still increased when the vehicle they are operating is not equipped with these systems. In Class IV lift trucks, the seat is often
Whole-body vibration is a physical stressor that occurs when vibration from a supporting surface is transmitted to a human subject. It represents one of the major health risks facing operators of heavy machinery (Bovenzi, 1996). The predominant risk of excessive whole-body vibration is the development of lower-back pain (Hulshof & van Zanten, 1987). It is commonly understood that reduced whole-body vibration exposure should result in reduced risk of injury, although currently there is no universal consensus on the magnitude of vibration dose that will lead to injury. Different postures can affect
vibration transmission through the body (Mansfield & Griffin, 2002), twisting and bending of the spine can lead to increases risk of musculoskeletal stress and fatigue in other areas including the neck and shoulders (Raffler et al., 2010). The human response to vibration is very complex, and although the human body is often treated as a solid mass, the reality is that different body parts that make up the human body have distinct excitation frequencies (Donati & Bonthoux, 1983). Factors such as posture and core muscle tension can change transmissibility through the body and affect how different regions of the body are affected by vibrations that originate from the buttocks (Fairley & Griffin, 1989).
Operators of Class IV forklift trucks are primarily exposed to whole-body vibration through the seating surface. This vibration dose and associated health risks are dependent on the characteristics of the vibration including: magnitude, frequency, direction and duration. Workplace standards, such as ISO 2631-1 (1997) provided guidelines for measurement and assessment of vibration exposure. The ISO 2631-1 standard also defines Health Guidance Caution Zones which describe three vibration dose ranges (Table 2).
Table 2: ISO 2631-1 (1997) Health Guidance Caution Zones for 8 hour vibration exposure.
Range!(m/s2)! Description!
<!0.45! Health!effects!not!clearly!documented! 0.45!9!0.90! Potential!for!health!risks!
Previous research has strived to establish a dose-response relationship of whole-body vibration and lower-back pain. This relationship is still not well understood as whole-body vibration is one of many factors that affect lower-back pain (Lings & Leboeuf-Yde, 2000). With the current understanding of whole-body vibration impact on human health, reduction of exposure has become a key focus in research where workers are exposed to vibration as part of their daily work routine (Motmans, 2012). Due to this complex relationship between factors such as vibration and posture, alternative approaches such as laboratory (Dickey et al., 2010; Rahmatalla & DeShaw, 2011; Mansfield & Maeda, 2011) and virtual reality simulations (Dickey et al., 2013) have been developed.
1.2 Virtual reality simulation in research
Virtual reality simulators have been used for training since before World War II. The first simulators were designed for aeronautical training, providing a safer and more cost-effective system to train pilots. By the 1960s, simulation had branched out to include automobiles, with a keen focus on highway driving. Unfortunately, limited technology impeded the evolution of these systems until the mid-1970s. Advancements in computing technology performance along with reduced costs meant that driving simulators were becoming increasingly accessible for use in both training and research capacities (Blana, 1996). Today, many industries involving heavy or dangerous machinery use simulators as training tools to reduce the risk of harm to operators as well as damage to equipment and the surrounding environment (Lemerle et al., 2011).
Virtual reality also allows for the complete customization and configurability of all elements that compose a virtual scenario; this can be enormously beneficial for
researchers looking to isolate key variables from confounding factors. Field studies which aim to evaluate the effects of vehicle or environment modification on whole-body
vibration often struggle to recreate similar vibration exposure levels across trials (Dickey et al., 2013). Virtual reality provides a new level of precision to variables that a
researcher may attempt to control such as vehicle speed, or surface characteristics. It also allows for the regulation of elements like weather and daylight that would normally be out of the researcher’s control. The ability to account for variables that may directly or indirectly affect testing results is an asset to any study that utilizes virtual reality.
Application versatility is another benefit that is inherent to virtual reality. Manipulation of vehicle properties and environmental factors in virtual space is done programmatically. This means changes made within the virtual scenario are made quickly and at a lost cost. Hardware components that make up the physical simulator vehicle are often modular, allowing for easy manipulation of the physical layout of the vehicle cabin. Interactive controls such as joysticks or buttons can be easily reassigned to run different aspects of the virtual vehicle. These attributes make reconfiguration of an existing simulator system a cost-effective strategy to study multiple vehicles.
1.3 Simulator Development
stereoscopic head-mounted-display (Oculus Rift, Oculus VR Inc., Irvine, CA, USA) allowing the operator to see the 3D virtual environment with six degrees of freedom.
Figure 1: Basic virtual reality simulator concept flow-chart.
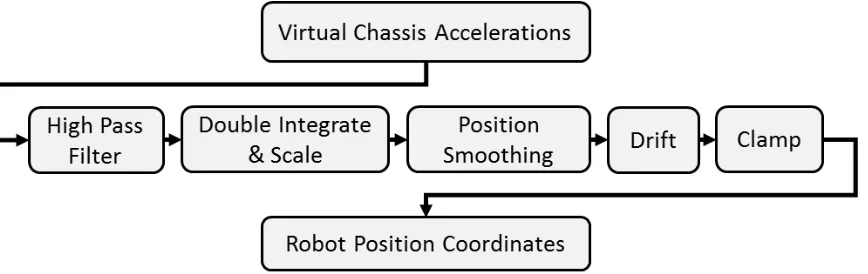
The program tracks the motion of the virtual truck as the operator navigates it through the virtual environment. Accelerations of the virtual truck chassis are calculated at 50 Hz, and mathematically processed to produce coordinates that are sent to the robotic motion platform (Figure 2). The parallel design of the robot limits the working volume of the platform. The translation process includes a number of features designed to optimize the motion of the robotic platform while maintaining a safe simulation experience.
Figure 2: Data processing flowchart illustrating how virtual truck motion is translated to robot position coordinates.
scaling factor for each axis is applied. Position coordinates are then smoothed to eliminate high frequency accelerations that exceed the robot platform’s capabilities. A drift factor is applied to the position coordinates which continuously draws the platform towards its origin. This is an important factor which eliminates the accumulation of a net offset from the origin. Finally all coordinates are clamped (limited) within a range to prevent the platform from exceeding its safe operating range of motion.
1.3.1
Virtual Truck and Environment
The virtual reality lift truck (Figure 3B) was modeled after a Toyota 7FGCU25 (Class IV) forklift fitted with a four-stage QFV mast (Figure 3A). This was the same truck model that was measured in the field collection component of this thesis. The original 3D model of the virtual Toyota forklift was a slightly larger truck that mostly resembled the aesthetics of the 7FGCU25; the 3D model was manipulated so that is proportions exactly matched the specifications of the real lift truck. Modifications to the driving cab included resizing the steering wheel, and adding a transmission switch to reflect the simulator cart components (Figure 4). The standard mast on the virtual forklift model was heavily modified in order to reflect the more substantial size of the four-stage QFV mast that was fitted on the field forklift.
Colliders were implemented to allow the truck to physically interact with elements in the virtual environment. A series of simplified box colliders made up the mast and forklift body, along with two capsule colliders which maintained the rounded shape of the rear cab. This configuration of colliders provided realistic collision geometry for interaction with the surrounding environment while maintaining a computationally efficient number of polygons. Custom C# scripts were used to enable dynamic wheel behavior including throttle, braking, steering, traction and suspension. Additional scripts enabled reflective left and right mirrors as well as control of the mast’s tilt and extension capabilities.
The virtual warehouse environment was created to match the dimensions of the shipping facility where the field data was collected. The floor consisted of smooth cement tiles (5.21 x 5.33 m) with 0.5 cm gaps between tiles. The virtual warehouse featured one loading dock, with a transport trailer parked at the opening. This trailer housed the palletized loads that were to be moved to an aisle in the warehouse. A thin ramp was put in place to bridge the gap between the floor and the transport trailer, and static palletized barrels bordered the aisle in which the payload was to be delivered.
1.3.2
Simulator Hardware
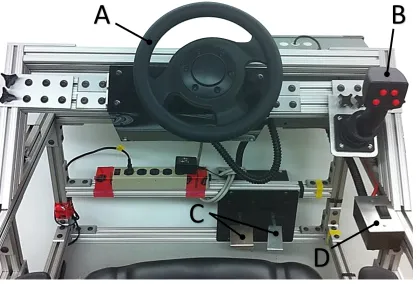
Figure 4: Simulator cart controls including: A) steering wheel, B) hoist lever, C) throttle & brake pedals, and D) transmission switch.
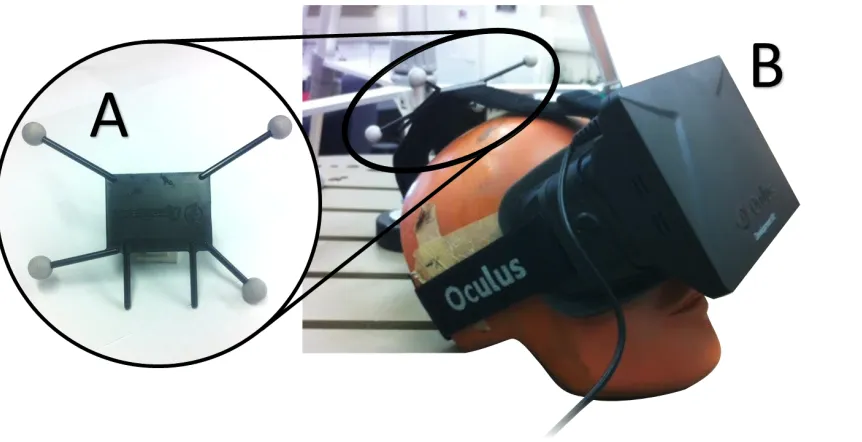
Three-dimensional visual feedback is provided by a stereoscopic head-mounted display (Oculus Rift, Oculus VR Inc., Irvine, CA, USA; Figure 6B). The infrared cameras track a rigid body attached to the headset (Figure 6A). Tracking Tools software (Tracking Tools; Natural Point Inc., Corvallis, OR, USA) streams head position and rotation information to Unity in real time, allowing the simulation to adjust the virtual camera within the
environment. This process allows the subject to look around the virtual environment with six degrees of freedom. Combining the realistic 3D visual feedback of the head-mounted display with the head tracking creates a highly immersive visual experience.
Figure 6: Virtual reality visual feedback system including A) rigid body for tracking head position and orientation, and B) Oculus Rift head-mounted display.
The modular nature of the cart construction allows easy resizing of cabin features, and the necessary controls can be configured to serve any purpose in the virtual environment. For example, the joystick that controls the hoist of a forklift could easily be repurposed to aim an external vehicle camera used as part of a secondary viewing system.
The virtual reality system was designed to create an immersive driving experience. A sense of presence is created through the use of six degree of freedom motion feedback and 3D visual feedback. A lot of care was taking during development to create realistic vehicle and environment elements to improve the perception of the virtual world. The motion feedback provided by the robotic platform was also designed to strengthen the immersive virtual experience. Although the focus of this study was to measure and assess the fidelity of the simulator accelerations, the subjective perception of the simulated environment was a key focus during development.
1.4 Purpose
2
Methodology
2.1 Field data
Chassis and seat pan vibration data were collected from a Toyota 7FGCU25 (Class IV) forklift truck, operating in an indoor distribution and storage warehouse environment. All measured driving operations were carried out by a 32-year-old male (1.80 m, 74.8 kg) with 8 years of forklift driving experience. Accelerations were recorded during a standard unloading task to create a reference against which the simulator chassis and seat pan accelerations could be compared. In addition to the unloading task, the forklift operator drove the lift truck over an EN 13059 test track multiple times while accelerations were recorded.
2.1.1
Instrumentation
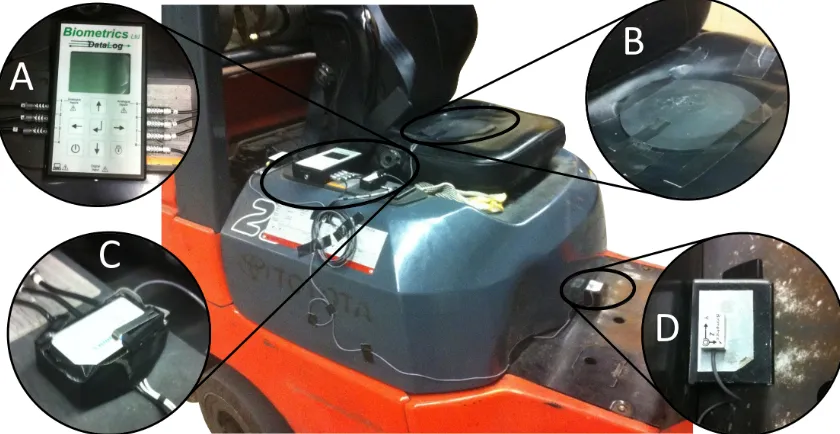
Chassis acceleration data were collected using a tri-axial accelerometer (ACL300, Biometrics Ltd., Virginia, USA) mounted to the floor of the forklift, in front of the seat, using a magnetic mount (Figure 7D). A second ACL300 accelerometer embedded in a rubber seat pan form was placed on the seat surface to record whole-body vibration exposure of the forklift operator in accordance with recommended guidelines
(ISO 2631-1, 1997; Figure 7B). Care was taken to ensure that both accelerometers were placed near the mid-sagittal plane of the truck. Additionally, a custom event marker was used to identify the timing of specific events during the trial (Figure 7C). Data from both accelerometers, as well as the event marker, were sample by a portable DataLOG unit at 1000 Hz (Biometrics Ltd., Ladysmith, VA, USA; Figure 7A) and recorded to a
Figure 7: Data acquisition set-up for recording forklift vibrations including: A) DataLOG recording unit, B) seat pan form with embedded accelerometer,
C) mechanical event marker, D) chassis accelerometer with magnetic mount.
Following collection, the acceleration data were downloaded from the SD card to a desktop computer. A custom LabVIEW program (National Instruments, Austin, TX, USA) was used to separate individual trials using information from the event marker channel. The same program was used to calibrate the acceleration data from counts to m/s2. Vertical (z) vibration for chassis and seat pan were isolated from the data sets for each trial.
2.1.2
Test Track: EN 13059
The EN 13059 driving task provided the opportunity to measure chassis and seat pan accelerations during a low-skill driving task with a high degree of control and
and verbal feedback was given to the lift truck operator on how to adjust their speed. A total of ten trials were recorded for the track, with the operator turning the lift truck 180˚ between trials to realign the forklift with the track. The manual event marker was
depressed once between trials.
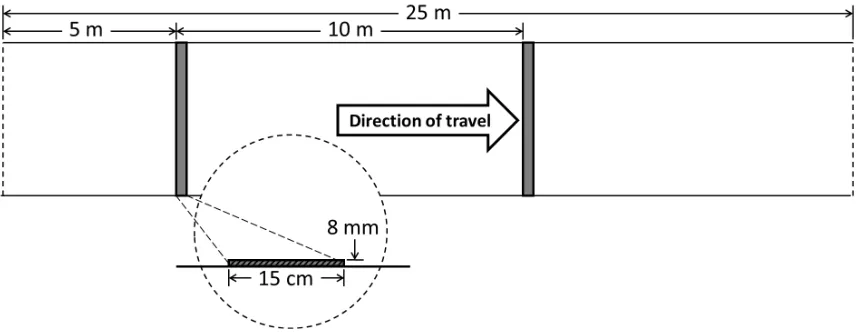
Figure 8: Birds-eye view of EN 13059 test track with dimensions and cross-section of steel plate obstacles.
After the data was downloaded from the SD card to a desktop computer, a custom LabVIEW program was used to crop the data using information from the event marker channel to separate individual trials. The vertical acceleration data was used to visually identify the two steel plate obstacles within each trial. The beginning of each steel plate was marked in the data; knowing that these two events were 10 m apart allowed the back-calculation of the timing for the complete 25 m track. This assumed that the truck
velocity was constant over the length of the track. This method was used to crop each trial because there were no notable features in the acceleration data to signify the
beginning or end of the track. The appropriate Wk weighting factors from the ISO 2631-1
(1997) standard were applies to the chassis and seat pan acceleration signals using the LabVIEW Sound & Vibration Toolkit. The root-means-square (RMS) chassis
2.1.3
Field Work Task
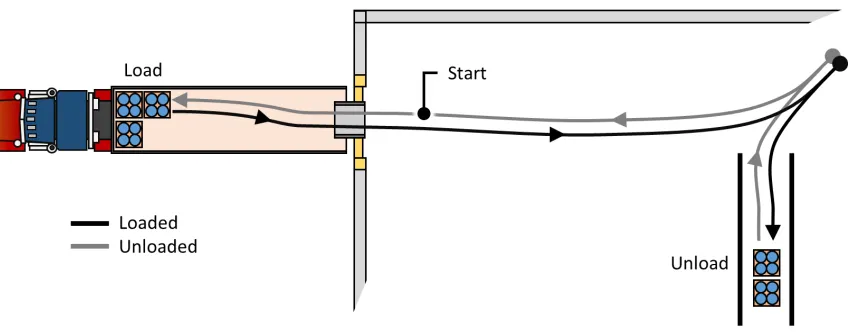
Chassis and seat pan accelerations were also measured during a routine truck unloading work task. The operator was responsible for unloading palletized rain barrels from a semi-truck and storing the product in a single aisle in the warehouse (Figure 9). The load was physically large, and obstructed the forward view of the operator; however, it was relatively light (~100 kg) compared to the lift truck capacity of 1700 kg.
Figure 9: A graphical birds-eye view of the unloading work task wherein palletized rain barrels were moved from the transport trailer to an aisle in the warehouse.
Refer to Table 3 for a breakdown of the task.
The work task consisted of one full unloading cycle beginning and ending at the entrance to the semi-truck. The task was divided into five distinct segments, defined by the truck switching directions (Table 3). The manual event marker (Figure 7C) was depressed between each segment once the operator had come to a complete stop.
Table 3: Work task segments, beginning at start position. Refer to Figure 9 for a graphical representation of the work task.
Segment! Description!
1! Forward,!unloaded!into!the!truck!!
2! Load!&!Reverse,!loaded!out!of!the!truck!to!the!aisle!! 3! Forward,!loaded!down!the!aisle!!
2.2 Virtual reality simulator data
2.2.1
Instrumentation
The same ACL300 accelerometers from the field recordings were used to measure chassis and seat-pan accelerations of the virtual reality simulator. The chassis
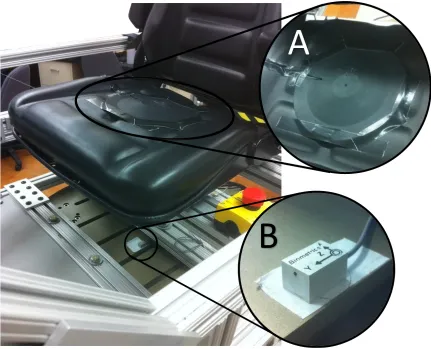
accelerometer was mounted with double-sided adhesive tape to the top surface of the robot platform, directly under the cart seat (Figure 10B). The rubber seat-pan form with an embedded accelerometer was placed in the middle of the seat surface and secured with adhesive tape (Figure 10A).
Figure 10: Simulator cart accelerometer placement: A) rubber seat pan form with embedded accelerometer, B) chassis accelerometer adhered to the platform surface.
to digital converter and streamed directly to a laptop computer. A custom LabVIEW data acquisition program was used to record the voltages. Each unique trial was saved as a separate file, eliminating the need for a manual event marker.
2.2.2
Sensitivity Analysis
The EN 13059 test track from the field was recreated in the simulation environment. Two static box colliders were used to replicate the steel plate with exact dimensions. The obstacles were set up in the middle of the warehouse environment along with lines to indicate the beginning and end of the 25 m track (Figure 11). The virtual lift truck was positioned exactly perpendicular to the center of the test track. Though it may seem artificial to have the testing scenario set up with this level of precision, the objective of the sensitivity analysis was to examine the effect of specific parameters, therefore an effort was made wherever possible to control all other variables.
Figure 11: Replicated EN 13059 test track in the virtual reality environment.
travel & damper strength) as well as the translation of chassis accelerations to motion platform coordinates (z-scale factor). At each adjustment, the virtual forklift was remotely driven across the EN 13059 test track using keyboard controls. This approach minimized any variability due to steering or alignment with the track. A virtual governor was implemented to ensure the forklift truck was traveling at exactly 10 km/h in the virtual space. Only chassis accelerations were measured for this analysis.
Each trial was then manually cropped to isolate the two bump events of the EN 13059 track. The vertical acceleration plot was used to visually identify the beginning of each bump. The record length for each cropped bump was calculated to include 3x the length of forklift wheelbase. This was intended to isolate the transient acceleration of the bump event. The vertical acceleration voltage data was calibrated to m/s2 and treated with a 20 Hz low-pass 2nd order Butterworth filter. The root-mean-square (RMS) acceleration was calculated for each trial to investigate the relationship between the magnitude of the parameters and the resulting chassis acceleration.
2.2.3
Field vs. Simulator Comparison
Following the sensitivity analysis, the parameters from the sensitivity analysis were adjusted to increase the vibration exposure during simulation. This was done with the intention of creating vibration exposures which would reflect those measured in the warehouse environment for the EN 13059 test track and unloading work task. The baseline and adjusted values for these parameters are shown in Table 4.
Table 4: Baseline and final adjusted values for the three parameters that were investigated in the sensitivity analysis. The adjusted values were used for
comparisons between the simulation and field trials.
Parameter! Baseline!Values! Adjusted!Values!
Z9Scale!Factor! 10,000! 16,000!
Suspension!Travel!(mm)! 20! 10!
Three subjects with widely varied body masses were chosen to complete the EN 13059 test track. Details of these subjects’ anthropometrics are presented in Table 5. Each subject performed the driving task a total of seven times. The results of the simulation trials would later be examined to determine the effect of body mass on both chassis and seat pan accelerations. In between trials, subjects turned the lift truck 180˚ to realign themselves with the track; this procedure was the same as the field trials. Chassis and seat pan acceleration data were collected on a laptop computer though the USB data
acquisition system. Each trial was saved separately, eliminating the need for a manual event marker.
Table 5: Simulator subject body metrics.
Subject! Height!(m)! Body!Mass!(kg)!
1! 1.83! 102.1!
2! 1.83! 79.4!
3! 1.68! 59.0!
3
Results
A sensitivity analysis was performed wherein various parameters of the simulation were adjusted and the acceleration response of the robot platform was measured. With a better understanding of the effect of each parameter on the simulator chassis motion, a
combination of adjustments was implemented. The acceleration response for the
EN 13059 track and a standard unloading task were compared to the measurements that were recorded in the field.
3.1 Sensitivity Analysis
A total of forty-three trials were run for the sensitivity analysis. Four initial trials were performed with all three parameters set to their baseline values (Table 4). The average chassis RMS acceleration for the eight individual bump events of the baseline trials was 0.478±0.049 m/s2. The z-scale factor was adjusted between 1000 and 20,000. There was a strong positive linear relationship between the z-scale factor and the resulting chassis RMS acceleration (r2 = 0.927; Figure 12).
Figure 12: Positive relationship between the magnitude of the z-scale factor and the resulting chassis RMS acceleration of the simulator chassis (r2 = 0.927).
0.0! 0.1! 0.2! 0.3! 0.4! 0.5! 0.6! 0.7! 0.8! 0.9!
0! 5000! 10000! 15000! 20000!
In terms of the effectiveness of changing the suspension parameters, increasing the suspension travel distance from 10 to 30 mm decreased the simulation chassis RMS accelerations (r2 = 0.842; Figure 13). An increase in damper strength also decreased the RMS acceleration response of the simulator chassis (r2 = 0.316; Figure 14).
Figure 13: Negative relationship between suspension travel distance and the RMS acceleration of the simulator chassis (r2 = 0.842).
Figure 14: Negative relationship between damper strength and the RMS acceleration of the simulator chassis (r2 = 0.316).
0.0! 0.1! 0.2! 0.3! 0.4! 0.5! 0.6! 0.7! 0.8!
0! 5! 10! 15! 20! 25! 30! 35! 40!
Ch as si s! RMS !(m /s 2)! Suspension!Travel!(mm)! 0.0! 0.1! 0.2! 0.3! 0.4! 0.5! 0.6! 0.7!
5000! 6000! 7000! 8000! 9000! 10000! 11000!
3.2 Field vs. Simulator Comparison
The EN 13059 test track protocol requires the truck to travel at 10.0±1.0 km/h (CEN, 2008); of the ten trials that were recorded in the warehouse, seven were deemed to have appropriate speed. The average speed for these seven trials was 10.53±0.35 km/h. The coefficient of variation for the chassis RMS accelerations was 0.09, confirming the data set as a valid test series (Donati, 1998).
In terms of the simulator performance of the EN 13059 test track, Levene’s test was not significant, confirming the assumption of homogeneity of variance between the simulator subjects (F (2, 18) = 1.732, p > 0.05). A one way AVONA of the chassis RMS
accelerations showed no significant differences between the three subject with different body masses (F (2, 18) = 1.759, p > 0.05; Figure 15). The trials for all three subjects were averaged to yield an estimate of the chassis accelerations for the EN 13059 test track in the simulator.
Figure 15: Simulator chassis RMS accelerations for subjects with different body masses performing the EN 13059 driving task.
When comparing the field and simulator chassis data, Levene’s test indicated the variances of the field and the simulator trials were significantly different
(F (1, 26) = 35.648, p < 0.05). Welch’s t-test for two samples with unequal variances
0.4! 0.5! 0.6! 0.7!
50.00! 60.00! 70.00! 80.00! 90.00! 100.00! 110.00!
Ch
as
si
s!
RMS
!(m
/s
2)!
revealed that the simulator chassis RMS accelerations were significantly lower than the chassis RMS accelerations measured from the real forklift performing the same
EN 13059 driving task (t (6.232) = 19.173, p < 0.05; Figure 16). Refer to Appendix A for individual RMS accelerations for the field and simulator trials.
Figure 16: Chassis RMS accelerations for the real forklift and the simulator performing the EN 13059 test track. Field accelerations were significantly larger
than the accelerations measured from the simulator.
0.00! 0.50! 1.00! 1.50! 2.00! 2.50!
Field! Simulator!
Ch
as
si
s!
RMS
!(m
/s
In terms of the seat pan accelerations measured during simulation of the EN 13059 test track, there was no significant effect of body mass on seat pan RMS acceleration for the three simulator subjects (F (2, 18) = 1.628, p > 0.05; Figure 17). The variance among the simulator subjects was not significantly different (F (2, 18) = 2.310, p > 0.05).
Comparing the field and simulator seat pan accelerations revealed significant differences between the group variances (F (1, 26) = 7.006, p < 0.05). The seat pan accelerations were approximately twice as large in the field compared to the simulator; the Welch’s t-test revealed that the field seat pan vibration exposures were significantly higher than the vibrations recorded on the simulator (t (6.906) = 16.730, p < 0.05; Figure 18).
Figure 17: Seat pan RMS accelerations for subjects with different body masses performing the EN 13059 driving task.
0.4! 0.5! 0.6! 0.7!
50.00! 60.00! 70.00! 80.00! 90.00! 100.00! 110.00!
Se
at!
Pan
!RMS
!(m
/s
2)!
Figure 18: Seat pan RMS accelerations for the real forklift and the simulator performing the EN 13059 test track. Field accelerations were significantly larger
than the accelerations measured from the simulator.
This simulator chassis RMS accelerations varied across the different segments of the unloading task; in contrast, the magnitude of the accelerations for the different task segments in the field remained fairly consistent (Figure 19). In terms of the time required to complete the unloading task, it took almost twice the amount of time in the simulator (246 s) compared to the forklift operator in the field (136 s; Figure 20). Field and
simulator chassis accelerations were most closely matched for the first segment where the forklift was driven unloaded from the warehouse into the transport trailer. This segment was also closely matched in duration. The fourth segment, unloading and reversing out of the aisle, had the largest difference in time between the field and simulation. The duration of the second segment was also notably larger for the simulation compared to the field. Both of these segments involved driving backward. Additionally, they contained the loading and unloading portions of the work task. The first, third and fifth segments were closely matched in duration between the field and simulator; however, large differences in chassis RMS were noted for the third and fifth segment.
0.00! 0.20! 0.40! 0.60! 0.80! 1.00! 1.20! 1.40! 1.60!
Field! Simulator!
Se
at!
Pan
!RMS
!(m
/s
Figure 19: Field and simulator chassis accelerations for different segments of a standard unloading work task. Refer to Table 3 for segment descriptions. The unloading task was performed once; plotted RMS accelerations are single values.
Figure 20: Field and simulator durations for each segment of the work task. Refer to Table 3 for segment descriptions. Plotted durations represent single values.
0.0! 0.1! 0.2! 0.3! 0.4! 0.5!
1! 2! 3! 4! 5!
RMS !A cc el er a_ on !(m /s 2 )! Work!Task!Segment! Field! Simulator!! 0! 10! 20! 30! 40! 50! 60! 70! 80! 90! 100!
1! 2! 3! 4! 5!
Tim
e!(s)!
Work!Task!Segment!
4
Discussion
The purpose of this study was to develop a virtual reality simulator and assess the vibration characteristics of the motion feedback as they relate to whole-body vibration. Although whole-body vibration of a seated subject is typically measured at the seating surface, the focus of this study was primarily on chassis vibrations. This was done to eliminate confounding factors such as dynamic driver characteristics or seat adjustments (Donati, 1998). The results of the sensitivity analysis clearly demonstrated the
responsiveness of the simulator chassis accelerations to adjustments of the simulation parameters. When compared again the real forklift, the RMS accelerations measured during simulation of the EN 13059 test track were significantly lower that the field RMS accelerations. In contrast, the acceleration magnitudes in some of the work task segments were more similar, as were the times to complete some of the work task segments. The work task analysis was able to provide some insight to the strengths and limitations of the simulation by isolating distinct segments of the trailer unloading task.
4.1 Sensitivity Analysis
A sensitivity analysis was performed for three of the parameters that directly affect the motion of the robot platform. There are two stages where adjustments to the robot motion can be affected. The first is through adjusting parameters which affect the virtual forklift truck motion within the simulated environment and how it responds to irregularities on the virtual driving surface. For example, the script used to dictate the behavior of the wheels has many factors which can be adjusted; this includes several factors which have an impact on the virtual suspension response. Changes to the vehicle properties will affect the motion of the virtual chassis, and thereby change the motion coordinates being sent to the robot platform. The second stage where adjustments are possible is in the translation of virtual chassis motion to the coordinates that are sent to the robot platform. Each of the mathematical processes that make up the translation sequence has variables that can be adjusted. These adjustments have a direct impact on how the virtual truck motion is represented by the simulator. The purpose of the sensitivity analysis was to isolate three specific parameters that affect the motion of the robot platform and to define the relationship of each parameter to the acceleration response of the platform.
The EN 13059 test track was used as a source of vibration in the sensitivity analysis in order to control for as many confounding variables as possible. This protocol attempts to control the influence of driving surface characteristics (Malchaire et al., 1996) and vehicle speed (Chen et al., 2003), which affect the vibration exposure. Three parameters were adjusted as part of a preliminary sensitivity analysis. The z-scaling factor,
suspension travel and damper strength all had a measurable effect on the accelerations of the robot motion platform. The responsiveness of the simulation to changes in various parameters, as illustrated in the sensitivity analysis, demonstrates that it may be possible to tune the virtual reality system for use in whole-body vibration research.
The z-scale factor modulates the z-coordinates being sent to the motion platform, affecting the motion platform coordinates at the translation stage of the simulator program. Accordingly, the response of the forklift truck in the environment is not
The consistency of the virtual truck response likely contributed to the strong positive correlation with the simulator chassis RMS acceleration. Increasing this parameter effectively elicits a larger acceleration response from the simulator chassis for a given transient impact; however, it presents a potential threat to the accurate representation of field motion when considering low-frequency elevation changes. When examining transient impacts like the EN 13059 track obstacles the accelerations may be large but the net vertical displacement is zero. In contrast, when calculating the motion coordinates of the robot, it is possible for a small offset from the origin to occur after the oscillation of the impact. Any small discrepancy following an impact is eventually nulled by the drift factor. In contrast, if the forklift were to change elevation quickly and maintain that change, as might occur when the forklift transitions between the warehouse and transport trailer, the drift factor may not be strong enough to keep the robot from reaching one of its vertical limits. The program clamps limit the magnitude of the position coordinates that are sent to the robot, as a safety precaution to ensure the robot operates within its physical range. Unfortunately, should a safety limit be reached, the topping or bottoming out of the robot platform would result in uncharacteristic accelerations.
The suspension travel and damper strength are two parameters that relate to the suspension characteristics of the virtual truck. These factors affect how the lift truck responds to surface irregularities in the virtual environment. Changes in the truck chassis acceleration response will therefore affect the coordinates sent to the motion platform. Suspension travel is the parameter that dictates the resting ride height of the chassis, as well as the available distance that the wheels can move relative to the chassis as they transition over irregularities on the driving surface. As the suspension travel is increased, the suspension of the virtual truck suspension has a longer compressive distance,
response; however, it is not possible to eliminate the suspension completely with the current C# script dictating suspension behavior of the truck. Although the suspension parameters for all four wheels had matching settings in this thesis, addressing the front and rear wheels separately, as appears to be the case with real forklifts (Ehland et al., 2010) may also have interesting influence on the behavior of the virtual forklift as well as the simulator chassis.
Damper strength was a second suspension parameter that was adjusted. This parameter also affects how the virtual truck responds to the virtual driving surface, but in a way that is distinct from suspension travel; it affects how the virtual lift truck suspension damps out vibrations caused by surface irregularities. As the strength of the damper for each wheel was increased, the damper component of the suspension system was able to remove energy from the oscillating spring component in a shorter period of time. Therefore, following an impact with an object like the steel plate in the EN 13059 test track, the vertical vibrations were damped out faster, resulting in shorter vibration duration and a lower chassis RMS acceleration. The negative correlation is
understandable when considering the role of the damper in the suspension system.
The measured change in chassis acceleration for each of the individual parameters clearly demonstrates the adjustable nature of the simulator. This is essential when considering the use of the virtual reality system as a platform to study whole-body vibration. There are dozens of other parameters that influence the simulator chassis motion, and the interplay between these factors is complex but is mathematically defined. Awareness of these interactions is an asset when attempting to manipulate the motion characteristics of the simulator chassis.
4.2 Field vs. Simulator Comparison
surface and vehicle speed, which significantly affect chassis accelerations (Malchaire et al., 1996) are controlled for (CEN, 2008). The EN 13059 test track target accelerations are designed to represent the typical vibration exposures of a truck; however, these accelerations are based on the average RMS of a wide variety of trucks categorized mainly by wheel size (Donati, 1998). Great efforts were taken during simulator
development to ensure that the virtual truck properties matched those of the real forklift. The same is true for the warehouse environment and palletized loads. With so much care being taken to match the virtual truck with a field tested forklift, a comparison of the vibration exposures gave more meaningful results.
Two important findings came from this analysis. The first was that body mass had no significant effect on the accelerations of the simulator chassis during the EN 13059 driving task. This speaks to the robust nature of the robot motion platform. For this reason, the chassis acceleration data from all three subjects in the simulation were grouped together and compared to the field chassis accelerations. The second major finding was that the average RMS acceleration of the simulator chassis was significantly lower than the real forklift. This difference in means is so large that the differences in variance and the sample sizes between the field and simulator trials are of minute
consequence. It is also worth noting that the chassis RMS acceleration of the real forklift was about 30% higher than the target acceleration for its category (Donati, 1998); this difference is likely attributed to the truck being unloaded (Malchaire et al., 1996). The EN 13059 protocol requires the truck to be carrying 60% of its load capacity (CEN, 2008); however, this was not possible in our case as this magnitude of load was not readily available in the testing environment where the field testing was performed. The seat pan RMS accelerations were also significantly lower for the simulator. The
The second comparison was the unloading work task, which was designed to evaluate how accurately the adjusted simulator was able to recreate whole-body vibration
exposures typical of a real forklift. The work task was divided into five distinct segments which differed in direction, load, and driving surface. Having the task broken into
segments with unique characteristics helped to highlight the simulator’s strengths and indicate areas where improvement can be made. The first segment showed remarkable likeness between the field and simulator for both acceleration RMS and segment
duration. The task involved driving forward, unloaded into the trailer. The motion of the robot platform represents the virtual wheels rolling over the surface transitions. Recalling that the sensitivity analysis was focused on the transient impact component of the
EN 13059 test track, it is understandable that the simulation would excel at recreating this form of vibration input. In contrast, the fifth segment also involved driving forward unloaded, but took place entirely on the cement warehouse floor surface. Segment durations between field and simulation were similar; however, there was a large
exposure. This method would be far more computationally efficient than trying to achieve the same feedback through the built in physics engine.
The truck engine is another source of vibration to consider. Chassis RMS accelerations recorded on diesel forklift trucks have been reported as significantly higher than electric forklift trucks operating under the same conditions (Malchaire et al., 1996); this
difference was attributed to the “smoother operation” of the electric forklift engine. The lift truck measured for this study was equipped with an internal combustion gasoline engine; however, vibrations from the engine are not represented in the simulation. This is likely responsible for some of the resulting difference in chassis RMS for both the
5
Conclusions
The results of this study provide an initial assessment of the vibration exposures during simulation as they relate to whole-body vibration. The work task comparison showed that the simulator was able to create transient chassis vibrations from surface irregularities that were similar to the vibrations measured in the field. Other segments of the work task which took place solely on the warehouse floor had much lower accelerations during simulation compared to what was measured in the field. This indicates that other sources of vibration such as the roughness of the cement floor and the truck engine, which are not modeled in the simulation, play an important role in the chassis vibration. The chassis vibrations in the simulation were not influenced by subject mass, and accordingly the virtual reality simulation has the potential to be incorporated into whole-body vibration research.
5.1 Future Development
6
References
Alm, H. (1996). Driving simulators as research tools: a validation study based on the VTI driving simulator. In: Drive II V2065: GEM Validation Studies Linkoping,
Sweden.
Bergamasco, M., Perotti, S., Avizzano, C. A., Angerilli, M., Carrozzino, M., & Ruffaldi, E. (2005). Fork-Lift Truck Simulator for Training in Industrial Environment. In: (pp. 689-693). IEEE.
Blana, E. (1996). A Survey of Driving Research Simulators Around the World (Working Paper 481) Institute of Transport Studies, University of Leeds, Leeds, England.
Blood, R. P., Ploger, J. D., & Johnson, P. W. (2010). Whole body vibration exposures in forklift operators: comparison of a mechanical and air suspension seat.
Ergonomics, 53, 1385-1394.
Bovenzi, M. (1996). Low back pain disorders and exposure to whole-body vibration in the workplace. In: Seminars in Perinatology (pp. 38-53). Elsevier.
Cann, A. P., Salmoni, A. W., & Eger, T. R. (2004). Predictors of whole-body vibration exposure experienced by highway transport truck operators. Ergonomics, 47, 1432-1453.
Chen, J., Chang, W., Shih, T., Chen, C., Chang, W., Dennerlein, J., Ryan, L., &
Christiani, D. (2003). Predictors of whole-body vibration levels among urban taxi drivers. Ergonomics, 46.
Choi, C. B., Park, P., Kim, Y. H., Susan Hallbeck, M., & Jung, M. C. (2009).
Comparison of visibility measurement techniques for forklift truck design factors. Applied ergonomics, 40, 280-285.
Dickey, J. P., Eger, T., & Oliver, M. L. (2010). A systematic approach for studying occupational whole-body vibration: A combined field and laboratory based approach. Work: A Journal of Prevention, Assessment and Rehabilitation, 35, 15-26.
Dickey, J. P., Eger, T. R., Frayne, R. J., Delgado, G. P., & Ji, X. (2013). Research Using Virtual Reality: Mobile Machinery Safety in the 21st Century. Minerals, 3, 145-164.
Donati, P. (1998). A procedure for developing a vibration test method for specific categories of industrial trucks. Journal of Sound and Vibration, 215, 947-957.
Donati, P. M. & Bonthoux, C. (1983). Biodynamic response of the human body in the sitting position when subjected to vertical vibration. Journal of Sound and Vibration, 90, 423-442.
Eger, T. R., Godwin, A. A., Henry, D. J., Grenier, S. G., Callaghan, J., & Demerchant, A. (2010). Why vehicle design matters: Exploring the link between line-of-sight, driving posture and risk factors for injury. Work: A Journal of Prevention, Assessment and Rehabilitation, 35, 27-37.
Eger, T., Salmoni, A., Cann, A., & Jack, R. (2006). Whole-body vibration exposure experienced by mining equipment operators. Occupational Ergonomics, 6, 121-127.
Ehland, A., Williams, M. S., & Blakeborough, A. (2010). Dynamic load model for fork-lift trucks. Engineering Structures, 32, 2693-2701.
European Comittee for Standardization [CEN] (2008). EN 13059:2002+A1, Safety of industrial trucks - Test methods for measuring vibration.
Horberry, T., Burgess-Limerick, R., & Fuller, R. (2013). The contributions of human factors and ergonomics to a sustainable minerals industry. Ergonomics, 56, 556-564.
Hoy, J., Mubarak, N., Nelson, S., Sweerts de Landas, M., Magnusson, M., Okunribido, O., & Pope, M. (2005). Whole body vibration and posture as risk factors for low back pain among forklift truck drivers. Journal of Sound and Vibration, 284, 933-946.
Hulshof, C. & van Zanten, B. V. (1987). Whole-body vibration and low-back pain. International Archives of Occupational and Environmental Health, 59, 205-220.
International Organization for Standardization (1997). ISO 2631-1, Mechanical vibration and shock-Evaluation of human exposure to whole-body vibration-Part 1:
General requirements. Geneva, Switzerland: International Standards Organization.
Larsson, T. J. & Rechnitzer, G. (1994). Forklift trucks−analysis of severe and fatal
occupational injuries, critical incidents and priorities for prevention. Safety Science, 17, 275-289.
Lee, H. C., Lee, A. H., & Cameron, D. (2003). Validation of a driving simulator by measuring the visual attention skill of older adult drivers. American Journal of Occupational Therapy, 57, 324-328.
Lemerle, P., Boulanger, P., & Poirot, R. (2002). A simplified method to design suspended cabs for counterbalance trucks. Journal of Sound and Vibration, 253, 283-293.
Lings, S. & Leboeuf-Yde, C. (2000). Whole-body vibration and low back pain: A systematic, critical review of the epidemiological literature 1992−1999.
International Archives of Occupational and Environmental Health, 73, 290-297.
Malchaire, J., Piette, A., & Mullier, I. (1996). Vibration exposure on fork-lift trucks. Annals of Occupational Hygiene, 40, 79-91.
Mansfield, N. J. & Griffin, M. J. (2002). Effects of posture and vibration magnitude on apparent mass and pelvis rotation during exposure to whole-body vertical vibration. Journal of Sound and Vibration, 253, 93-107.
Mansfield, N. J. & Maeda, S. (2011). Subjective ratings of whole-body vibration for single-and multi-axis motion. The Journal of the Acoustical Society of America, 130, 3723-3728.
Motmans, R. (2012). Reducing whole body vibration in forklift drivers. Work: A Journal of Prevention, Assessment and Rehabilitation, 41, 2476-2481.
Raffler, N., Hermanns, I., Sayn, D., Goeres, B., Ellegast, R., & Rissler, J. (2010). Assessing combined exposures of whole-body vibration and awkward posture-further results from application of a simultaneous field measurement
methodology. Industrial health, 48, 638-644.
Rahmatalla, S. & DeShaw, J. (2011). Predictive discomfort of non-neutral head−neck
postures in fore−aft whole-body vibration. Ergonomics, 54, 263-272.
Seidel, H. (1993). Selected health risks caused by long−term, whole−body vibration.
American journal of industrial medicine, 23, 589-604.
Soma, H. & Hiramatsu, K. (1998). Driving Simulator Experiment on Drivers- Behaviour and Effectiveness of Danger Warning Against Emergency Braking of Leading Vehicle. Proceedings of 16th ESV, Canada.
The Occupational Safety and Health Administration. Retrieved, 7-30-2014 from https://www.osha.gov/SLTC/etools/pit/forklift/types/index.html.
Appendices
Appendix A: Chassis and seat pan RMS accelerations for the individual trials of the real forklift and simulation for the EN 13059 driving task. Details of the simulator subjects’ anthropometrics are provided in Table 5.
RMS!Acceleration!(m/s2)!
Subject! Trial! Chassis! Seat!Pan!
Field! 1! 2.339! 1.548!
! 2! 2.016! 1.338!
! 3! 2.195! 1.497!
! 4! 1.940! 1.324!
! 5! 2.181! 1.391!
! 6! 1.803! 1.230!
! 7! 1.875! 1.320!
! AVG! 2.05! 1.38!
! SD! 0.19! 0.11!
Sim!1! 1! 0.599! 0.653!
! 2! 0.556! 0.589!
! 3! 0.622! 0.664!
! 4! 0.641! 0.650!
! 5! 0.625! 0.629!
! 6! 0.624! 0.602!
! 7! 0.681! 0.737!
! AVG! 0.62! 0.65!
! SD! 0.04! 0.05!
Sim!2! 1! 0.646! 0.663!
! 2! 0.597! 0.642!
! 3! 0.561! 0.564!
! 4! 0.662! 0.711!
! 5! 0.651! 0.687!
! 6! 0.727! 0.769!
! 7! 0.729! 0.745!
! AVG! 0.65! 0.68!
! SD! 0.06! 0.07!
Sim!3! 1! 0.610! 0.649!
! 2! 0.662! 0.679!
! 3! 0.570! 0.605!
! 4! 0.610! 0.639!
! 5! 0.611! 0.635!
! 6! 0.592! 0.627!
! 7! 0.614! 0.626!
! AVG! 0.61! 0.64!
Curriculum Vitae
Name: Peter Wegscheider
Post-secondary University of Western Ontario
Education and London, Ontario, Canada
Degrees: 2007-2012 Honors Specialization B.Sc.
University of Western Ontario London, Ontario, Canada
2012-2014 Biomechanics M.Sc. Candidate
Related Work Teaching Assistant
Experience University of Western Ontario 2012-2014
Publications: