OPERATIONS, INFORMATION & TECHNOLOGY | RESEARCH ARTICLE
Exploring business intelligence and its depth of
maturity in Thai SMEs
Waranpong Boonsiritomachai1*, G. Michael McGrath2 and Stephen Burgess2
Abstract: Increased complexities in making effective and timely business decisions
in highly competitive markets have driven organisations worldwide to adopt business
intelligence (BI) technologies. Large enterprises have reached a mature stage of BI
adoption while small- and medium-sized enterprises (SMEs) still lag behind—despite
organisations of all sizes can benefit from the use of this technology to aggregate,
manage and analyse data for assisting decision-making that enhances profitability.
This study proposes a BI maturity model for SMEs that distinguishes different levels
of BI maturity and identifies the factors that currently impact their levels of BI
adop-tion. The proposed model is empirically tested using survey data from 427 SMEs and
analysed using multinomial logistic regression. Results indicate that BI adoption in
Thai SMEs is still at an initial stage, with the majority being classified in the lowest
level of BI maturity. Significant factors that impact the levels of BI adoption are
rela-tive advantage, complexity, organisational resource availability, competirela-tive
pres-sure, vendor selection and owner-managers’ innovativeness. Results from the study
can be used by government agencies to develop strategies to increase the rate of BI
adoption among SMEs. IT vendors also can use the results to determine which SMEs
they should target.
*Corresponding author: Waranpong Boonsiritomachai, Faculty of Management and Tourism, Burapha University, Chonburi, Thailand E-mail: waranpong@gmail.com Reviewing editor:
Shaofeng Liu, University of Plymouth, UK
Additional information is available at the end of the article
ABOUT THE AUTHORS
Waranpong Boonsiritomachai is a full-time lecturer in the Faculty of Management and Tourism at Burapha University, Thailand. His professional experience includes the provision of consulting services on enterprise resources planning (ERP) systems to a wide range of global enterprises with operations in both Thailand and Singapore.
G. Michael McGrath is a professor of Information Systems at College of Business, Victoria University, Melbourne, Australia. In recent years, he has conducted research and consultancy work for Telstra, IBM, Centrelink and National Office for the Information Economy. He has authored over 150 refereed journal, book chapters and conference papers.
Stephen Burgess is an associate professor at Victoria University, Australia. He has authored/ edited three books and special editions of many journals. His journal publications include the International Journal of Information Management, Journal of Information Science, Information Systems Frontiers, Tourism Analysis, the
International Journal of Tourism Research and the Journal of Hospitality, Marketing and Management.
PUBLIC INTEREST STATEMENT
Business intelligence (BI) is today a key information system (IS) for many enterprises globally. BI supports enterprises through better decision-making by faster access to more reliable information. BI helps grow the quality of client relationships, increase income and rationalise non-IT expenses. Large organisations recognising the competitive advantage gained from BI were the first to implement BI and BI has become an important and integral part of enterprise decision support. SMEs still underestimate the value of BI and limit BI capabilities to basic administrative tasks. BI systems have become more affordable and represent an opportunity for Thai SMEs to gain competitive advantage through better decision-making. This study explored Thai SMEs’ current BI adoption levels and identified factors impacting BI adoption levels. The study’s findings and proposal of a new BI adoption framework will help Thai Government agencies and technology suppliers develop strategies to encourage higher levels of BI adoption for Thai SMEs.Received: 30 May 2016 Accepted: 01 August 2016 Published: 22 August 2016
Subjects: Behaviour; I.T. Research; Management of IT
Keywords: business intelligence; SMEs; diffusion of innovation; technology adoption
1. Introduction
For over two decades, research into business intelligence (BI) has become increasingly significant in supporting the industry. For instance, Gartner’s survey of 2,053 IT chiefs in 41 countries found that BI is a first priority in technological investment (Gartner, 2013). The International Data Corporation reported that worldwide investments in BI are significant and growing, having increased from US$10.53 billion in 2011 to US$11.35 billion in 2012, and estimated to reach US$17.1 billion by 2016 (IDC, 2013). Implementation of BI technology to support businesses has grown due to its increasing affordability (Chaudhuri, Dayal, & Narasayya, 2011) and the desire among organisations to make decisions in a timely manner (Habjan & Popovic, 2007). This demand for BI is not restricted to firm size, even though it has normally been associated with larger firms (Gäre & Melin, 2011) reaching BI maturity (O’Brien & Kok, 2006). Indeed, although small- and medium-sized enterprises (SMEs) now have as much need for BI as large companies (Cheung & Li, 2012), their adoption rates still lag be-hind. This low rate of adoption could in fact reduce the ability of SMEs to compete with larger organi-sations and loss of competitive advantage.
However, despite the benefits of adopting BI by SMEs are known and attempts made to provide commercially relevant BI systems, many SMEs remain reluctant to use this technology (Grabova, Darmont, Chauchat, & Zolotaryova, 2010). Furthermore, as research in this area remains sparse, there is insufficient knowledge in understanding the adoption of BI by SMEs. Additionally, the major-ity of such studies have been conducted for specific countries such as Australia (Elbashir, Collier, & Davern, 2008), Northern Ireland (Hill & Scott, 2004) and United States (Ramamurthy, Sen, & Sinha, 2008), with very few exploring the situation of BI in Thailand—despite rapid growth of IT spending in this country. The International Data Corporation reported that Thailand in 2015 was estimated to increase IT spending by 10.6% to US$13.4 billion (Pornwasin, 2015), whereas IT spending in Europe would increase by less than 1% (IDC, 2015). These spending trends make it crucial to further under-stand IT and BI implementation in Thailand.
There are two main objectives of this study. The first objective is to investigate the current state of BI adoption by four main types of Thai SMEs including manufacturing, service, wholesale and retail. In order to identify the current BI adoption state, this study is based on the concept of maturity model to classify organisations into different BI levels. The second objective is to identify the factors that influence such adoption. Rather than viewing BI adoption as a dichotomous decision to adopt or not adopt, this study has developed a maturity model to depict the stages of BI adoption on a scale from low level to high level. To explore the important factors that influence the levels of BI adoption, this study is based on the “Diffusion of Innovation” theory (Rogers, 1983), technology–organisation– environment (TOE) framework (Tornatzky & Fleischer, 1990) and the IS integration model (Thong, 1999). Clearly, recognising the factors that influence levels of BI adoption will be useful in suggesting strategies to overcome the constraints that inhibit adoption. This line of inquiry benefits both re-searchers and practitioners.
2. Theoretical background
2.1. Business intelligence
2.2. Adoption of innovation theory
The adoption of BI in SMEs can be viewed from the perspective of innovation (Igartua, Garrigós, & Hervas-Oliver, 2010). Damanpour and Evan (1984) defined an innovation as any idea, practice or object that the adopting individual or organisation regards as new. Although a wide variety of theo-retical models have been used to explore the adoption of innovations, this study employs a multiple perspective framework based on three related theoretical frameworks as the basic foundation for development of a conceptual model: diffusion of innovation theory (DOI), TOE framework and the IS integration model.
DOI was developed by Rogers (1983) with the initial aim of describing the elements that impact the process of innovation diffusion and adoption. This theory posits that potential adopters evaluate an innovation based on their perceptions, and will make a decision to accept the innovation if they perceive that it exhibits one or more of five general factors, being relative advantage, complexity, compatibility, trialability and observability. Of these factors, relative advantage, complexity and compatibility have provided the most consistent explanation for the adoption of ISs (Tornatzky & Klein, 1982). According to the review of literature by Jeyaraj, Rottman and Lacity (2006), DOI has been the most often cited work dealing with innovation adoption, as can be observed in numerous studies. However, DOI has been criticised as it is biased towards the technological component of the adoption process (Fichman, 2000). Even when technological superiority is assured, it does not guar-antee the adoption of IT innovation by organisations. This is because other social, organisational and individual factors may impact IT adoption (Segal, 1994).
The TOE framework, proposed by Tornatzky and Fleischer (1990), combines innovation character-istics with other elements. This framework can be viewed as an extension to the DOI theory to strengthen what has been generally neglected, namely organisation and environment circumstanc-es which add both opportuniticircumstanc-es and constraints to the technology adoption decision (Zhu, Dong, Xu, & Kraemer, 2006). To facilitate an understanding of innovation adoption in organisations, several studies have adopted TOE in combination with DOI to examine the impact of relevant organisational and environmental characteristics including variables such as competitive pressure, selection of vendors, absorptive capacity and organisational resource availability (Chong, 2008; Ghobakhloo, Arias-Aranda, & Benitez-Amado, 2011; Ifinedo, 2011; Tan & Lin, 2012).
An IS adoption model for small business was first developed by Thong (1999), for the reason that the available organisational theories or practices applicable to large organisations may not fit the SME context. Thong developed his integrated perspective model of IT adoption in SMEs to identify four contextual variables relevant to IT adoption, including owner-manager, technological, organisa-tional and environmental characteristics. Thong found that small businesses with owner-manager who have innovativeness and IT knowledge are more likely to adopt technologies. As owner-manag-ers have a significant impact on making IT adoption decisions, several studies conducted on SMEs have further included owner-managers’ characteristics into the factors that impact technology adoption (Chang, Hung, Yen, & Lee, 2010; Fogarty & Armstrong, 2009; Ghobakhloo et al., 2011).
The above-mentioned factors that are generally crucial in the adoption of IT have been exten-sively examined in the literature. These factors are significant to the success of technology adoption in the organisational context. However, limited studies have focused on the factors that specifically influence BI in the particular context of SMEs. For this reason, there is a need to conduct studies that focus more on BI in SMEs. Based on the assumption that the adoption of BI in SMEs may follow simi-lar patterns to that of general IS and IT, this study has used the above-mentioned factors and in-cluded in the initial version of the research model.
2.3. A BI maturity model
with relatively simple technologies (Teo, 2007). However, there is no common classification of BI level adoption among researchers. Although some researchers categorise the levels of BI in terms of solutions and technologies (Hawking, Foster, & Stein, 2008; McDonald, 2004), the majority define BI as representing not only technologies but also processes that transform data into information and then knowledge (Pirttimaki, Lonnqvist, & Karjaluoto, 2006; Wixom & Watson, 2010). Therefore, the concept of a maturity model is applied in this study to explain the different levels of BI adoption. Maturity is described as a “state of being complete, perfect or ready” or the “fullness of develop-ment” (Soanes & Stevenson, 2008, p. 906). To reach a desired state of maturity, an evolution trans-formation path from initial (first adoption) stage to a target stage needs to occur (Klimko, 2001).
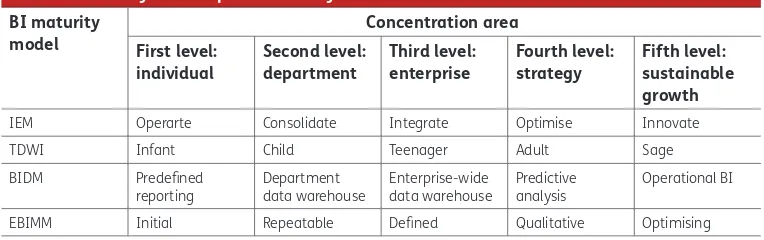
For classifying organisations into different levels of BI, IT consulting companies have developed a variety of BI-specific maturity models such as the information evolution model (IEM) (Davis, Miller, & Russell, 2006), The Data Warehouse Institute (TDWI) (Eckerson, 2007), BI Development Model (BIDM) (Sacu & Spruit, 2010) and the Enterprise BI Maturity Model (EBIMM) (Chuach, 2010). Each model focuses on different dimensions or perspectives and have their own limitations such as being based only on technical dimensions or only on organisational dimensions (Rajteric, 2010). However, analysis of these models revealed that they also have repetitive information due to the model ad-dressing similar concepts, despite using different designations. For example, most BI maturity mod-els in the first level focus on the individual, while the second level focuses on department, despite using different designations. Table 1 shows the summary of a BI maturity model.
This study adopted the IEM as proposed by SAS, the leading company in business analytics soft-ware and services (Davis et al., 2006), to classify organisations into specific BI levels. The IEM model was selected as the fundamental model as it is not restricted to the technological dimensions and also focuses on the alignment between the four dimensions of infrastructure, knowledge process, human capital and culture. All four dimensions are used to classify the level of BI in organisations. However, Lahrmann, Marx, Winter and Wortmann (2010) suggested that the IEM model had limita-tions in addressing the analytical applicalimita-tions, one of the key BI components (Ranjan, 2005). Therefore, this study includes the “Application” dimension as derived from Sacu and Spruit (2010) to more comprehensively conceptualise BI and enhance the IEM model.
2.3.1. Five dimensions in BI maturity model
There are five levels defined in the proposed BI maturity model spanning across five dimensions as follows:
Infrastructure: the implementation of technologies including hardware, software and networking tools to create, store and distribute information;
Knowledge process: the role of information in corporate knowledge sharing, the role of informa-tion in decision-making and the improvement of informainforma-tion accuracy;
Table 1. Summary of example BI maturity models
Source: Chuach (2010), Davis et al. (2006), Eckerson (2007) and Sacu and Spruit (2010).
BI maturity
model First level: Concentration area
individual Second level: department Third level: enterprise Fourth level: strategy Fifth level: sustainable growth
IEM Operarte Consolidate Integrate Optimise Innovate
TDWI Infant Child Teenager Adult Sage
BIDM Predefined
Human capital: capabilities, responsibilities, decision-making, training, enterprise goals and im-provement of personnel skill sets related to technological information;
Culture: social and behavioural norms of corporate culture in relation to the information flow with-in an organisation; and
Application: analytic applications that organisations have adopted from using basic software pro-grams for generating reports to advanced propro-grams that provide predictive results.
2.3.2. Five levels in the BI maturity model
A unique feature of the BI maturity model presented in this study is the recognition of the relation-ships between the five dimensions. Organisations can be classified into five different levels of BI adoption from low to high levels (operate, consolidate, integrate, optimise and innovate) depending on how they are situated in relation to the five dimensions. In accordance with Davis et al. (2006) and Sacu and Spruit (2010), each dimension is given five levels of maturity in the following order:
2.3.2.1. Operate. A company in the “Operate” level is one with the most basic BI and is typically a start-up organisation. Companies at this level focus on general information for day-to-day opera-tions. They operate in a chaotic information environment where information access and formats are not standardised. Their employees generally keep information on individual computers. They also fear organisational change. Simple software programs to generate personal reports or personalised spreadsheets are used in this type of organisation.
2.3.2.2. Consolidate. A company in the “Cconsolidate” level is one that integrates and stores infor-mation at the departmental level. The knowledge process at this level shifts from the individual to departments. Data management is well defined in each department but not across departments, leading to problems of mismatch between departments. Employees at this level work effectively in teams with rewards from contributing to departmental goals. The “Consolidate” company typically uses software programs that can keep data in standardised formats but with limited user views.
2.3.2.3. Integrate. A company in the “Integrate” level recognises the significance of defining infor-mation consistently across the organisation by integrating data and storing it in a central data ware-house. Information is well managed in a standardised approach and clearly tied to organisational goals. As a result, decision-making is from the organisational perspective. There is cooperation in managing data between employees from various departments. Employees in the integrated com-pany accept change when it is clearly understood. The integrated comcom-pany typically uses software programs that keep data in a standardised format throughout the enterprise and allow users a multidimensional view of data.
2.3.2.4. Optimise. A company in the “Optimise” level explores methods to maximise performance in a competitive context to better serve their customers. This company views the business model as ex-tending beyond the business; thus, infrastructure is linked through internal business systems across the supply chain. At this level, the company needs to have employees with intellectual skills, including predictive analysis, to work with other colleagues to improve organisational effectiveness. Employees embrace the idea of improving incrementally, and view change as an opportunity rather than a threat. The company in the “Optimise” organisation level typically uses software programs with automated data analysis techniques to detect relationships in the data and provide predictive results.
organisation that encourages novel ideas, the innovate company understands that failures are inevi-table and part of the learning process. The innovate organisation typically uses software programs that allow users to generate an automated exception reporting when something unusual occurs.
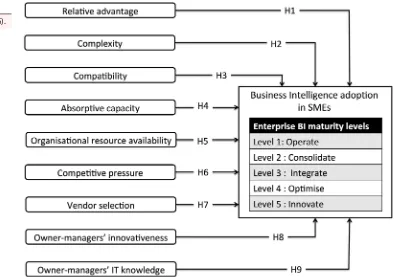
2.4. Conceptual model and hypotheses
Based on the BI maturity model and three related theoretical frameworks, the proposed conceptual model is presented in Figure 1. Nine hypotheses are proposed below.
2.4.1. Relative advantage
Ifinedo (2011) found that the more organisations perceive technology as having advantage over existing practices and systems, the more the adoption of such technology will be positively encour-aged. In the case of BI, the advantages of adopting this technology to support business operations are clear (Ko & Abdullaev, 2007). For example, retail companies can use BI to determine which of their products are most profitable, and where to place them in their stores (Williams & Williams, 2003). Hence, we hypothesise that:
H1: Relative advantage of BI significantly impacts on BI adoption levels among SMEs.
2.4.2. Complexity
Complexity can present a barrier to innovation adoption (Chang et al., 2010). For example, Ramamurthy, Sen and Sinha (2008) found that lower complexities in a technology result in higher positive effects on its adoption, which infers that the high complexity of BI technology can cause employees to resist its adoption (The Economist Intelligence Unit, 2007). Voicu, Zirra and Ciocirlan (2009) confirmed that BI models are highly complicated because they integrate mathematical func-tions to predict trends in a firm’s performance that provide solufunc-tions in a variety of situafunc-tions. Hence, we hypothesise that:
H2: Complexity of BI significantly impacts on BI adoption levels among SMEs.
2.4.3. Compatibility
Some studies employing the compatibility factor have proven its validity in predicting technology adoption among organisations (Chang et al., 2010; Grandon & Pearson, 2004). Bajaj (2000) indicated that this factor can bring changes to the organisation by converting old data to be read on new ar-chitecture, retraining users to use and allowing IT personnel to effectively maintain software. However, if existing systems are not compatible with BI technology, it may take a significant invest-ment of time and resources to migrate data. Hence, we hypothesise that:
H3: Compatibility of BI significantly impacts on BI adoption levels among SMEs.
2.4.4. Absorptive capacity
The absorptive capacity of an organisation has been identified as the ability of its members to use existing or pre-existing knowledge (Griffith, Sawyer, & Neale, 2003) to increase recognition of new and external information that can be applied to increase economic benefit. This capacity can be used as a predictor of the organisation’s ability to adopt an innovation or not (Khalifa & Davison, 2006). However, a survey conducted on telecommunication firms by O’Brien and Kok (2006) indi-cated that many organisations were not fully utilising BI due to lack of knowledge, technical skills and training. Hence, we hypothesise that:
H4: Absorptive capacity significantly impacts on BI adoption levels among SMEs.
2.4.5. Organisational resource availability
Organisational resource availability has also been identified as influencing innovation adoption (Adler-Milstein & Bates, 2010; Oliveira & Martins, 2010). However, due to high complexity and cost, BI implementation is often out of reach to organisations with less financial resources and skilled workers (Sahay & Ranjan, 2008). As Chong (2008) mentioned, managers will support the adoption of a new technology when capital, human resources and organisational time to implement are avail-able. Hence, we hypothesise that:
H5: Organisational resource availability significantly impacts on BI adoption levels among SMEs.
2.4.6. Competitive pressure
Competitive pressure tends to stimulate firms to look for new approaches to business by raising ef-ficiency and increasing productivity for survival (Themistocleous, Irani, Kuljis, & Love, 2004). This pressure can come from either competitors or trading partners, which results in a greater intention by firms to adopt the technologies that are being used by competitors. To avoid being labelled as less receptive to change and incompatible with industry norms, some organisations adopt new tech-nologies that are commonly used by other companies (Teo, 2007), indicating a strong relationship between the degree of competitive pressure and technology adoption (Dholakia & Kshetri, 2004; Hwang, Ku, Yen, & Cheng, 2004). Hence, we hypothesise that:
H6: Competitive pressure significantly impacts on BI adoption levels among SMEs.
2.4.7. Vendor selection
Selection of vendors is a significant factor in IT adoption as they can help facilitate adoption imple-mentation and ongoing success (Moffett & McAdam, 2003). This is important because even when innovative enterprise systems are advanced, they may not be stable enough to meet the entire in-formation processing needs required (Davenport, 2000). Due to BI being different from other enter-prise information technologies, it requires tailored solutions to suit each particular firm and industry (Hill & Scott, 2004). Hence, we hypothesise that:
2.4.8. Owner-managers’ innovativeness
Innovativeness refers to a willingness to introduce newness and novelty through experimentation and creativity aimed at developing new products, services and processes (Zhu et al., 2006). Parasuraman (2000) found that personal innovativeness exists in certain individuals who are willing to take risks when adopting an innovation. For instance, Chang et al. (2010) found that owner-man-agers’ innovativeness is a significant determinant of enterprise resource planning (ERP) adoption in SMEs. Hence, we hypothesise that:
H8: Owner-managers’ innovativeness significantly impacts on BI adoption levels among SMEs.
2.4.9. Owner-managers’ IT knowledge
Greater owner-manager knowledge in IT can decrease the degree of uncertainty and lead to lower risk in IT adoption (Thong, 1999). This view has been reinforced by Mirchandani and Motwani (2001) who found that owner-managers’ IT knowledge is a key factor highly associated with IT adoption. In agreement, Chao and Chandra (2012) reported that owner-managers have more capability in tech-nology adoption when they are able to gain knowledge about the new techtech-nology. Hence, we hy-pothesise that:
H9: Owner-managers’ IT knowledge significantly impacts on BI adoption levels among SMEs.
3. Methodology
3.1. Data collection
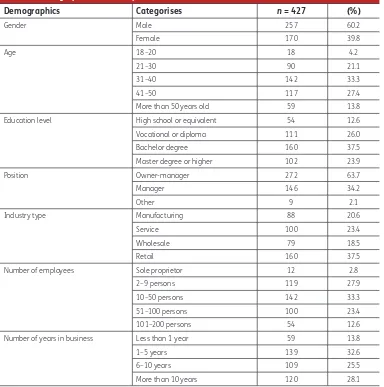
A quantitative methodology through a survey questionnaire was employed to explore the current state of BI adoption by Thai SMEs. A self-administered questionnaire was initially developed and reviewed for content validity by five BI experts specialising in SMEs. In defining these SMEs, this study used employee numbers in line with small business research principles. Consequently, these SMEs were defined as companies with fewer than 200 employees in line with the definition by the Thailand Ministry of Industry (Brimble, Oldfield, & Monsakul, 2002) and randomly selected from a database of organisations that had submitted trade declarations to the Thai Government. Two thousand SMEs from four main industries including service, manufacturing, wholesale and retail were randomly selected. A total of 485 responses were eventually received, showing a returning rate of 24.25%. However, 58 questionnaires were excluded, where 32 respondents failed to complete the research instrument appropriately, and 26 respondents were identified as having more than 200 employees. The final number of usable responses was 427, yielding a response rate of 21.35%. The demographic characteristics of respondents are shown in Table 2.
3.2. Measurement of variables
3.2.1. Dependent variables (The levels of BI adoption)
3.2.2. Independent variables (Adopting factors)
The independent variables were measured by asking respondents to evaluate which factors impact-ed the levels of BI adoption in their organisations. The measurement usimpact-ed for analysing responses in the independent variables was developed by adapting and amalgamating measures from previous studies. The constructs of relative advantage, complexity and compatibility were adopted from Moore and Benbasat (1991), whereas absorptive capacity and organisational resource availability were adopted from Iacovou, Benbasat and Dexter (1995). The constructs of competitive pressure and vendor selection were adopted from Grandon and Pearson (2004), whereas owner-managers’ innovativeness and IT knowledge were adopted from Hung, Hung, Tsai and Jiang (2010). A five-point Likert scale was used for all items, anchoring from “Strongly Agree” to “Strongly Disagree”.
3.3. Measurement model evaluation
This study categorises Thai SMEs into different BI adoption levels based on five dimensions and the Spearman correlation was used to test accuracy and reliability. Using the BI maturity model, an or-ganisation was classified into the level where the oror-ganisation possesses properties mostly similar to the description of that level in each of the dimensions. It was assumed that if respondents’ or-ganisations were ranked high in one dimension, they were also to be ranked higher in other dimen-sions. The Spearman correlation was used to identify the correlation between each of the dimendimen-sions.
Table 2. Demographics of the respondents
Source: SPSS descriptive analysis (2016).
Demographics Categorises n = 427 (%)
Gender Male 257 60.2
Female 170 39.8
Age 18–20 18 4.2
21–30 90 21.1
31–40 142 33.3
41–50 117 27.4
More than 50 years old 59 13.8
Education level High school or equivalent 54 12.6
Vocational or diploma 111 26.0
Bachelor degree 160 37.5
Master degree or higher 102 23.9
Position Owner-manager 272 63.7
Manager 146 34.2
Other 9 2.1
Industry type Manufacturing 88 20.6
Service 100 23.4
Wholesale 79 18.5
Retail 160 37.5
Number of employees Sole proprietor 12 2.8
2–9 persons 119 27.9
10–50 persons 142 33.3
51–100 persons 100 23.4
101–200 persons 54 12.6
Number of years in business Less than 1 year 59 13.8
1–5 years 139 32.6
6–10 years 109 25.5
All dimensions had positive correlation between the paired dimensions, which means that the ranks of both dimensions were moving in the same direction. Moreover, the p-values of all dimensions were 0.00, which was lower than the significance level of 0.05 revealing a significant association between each dimension. As all dimensions in the study model had relationships with each other, the study model had a degree of accuracy and reliability in categorising organisations into the vari-ous BI adoption levels.
Instrument reliability related with enabling factor was ascertained using Cronbach’s alpha (α). The values obtained for each of the factors were as follows: relative advantage: 0.841; complexity: 0.844; compatibility: 0.665; absorptive capacity: 0.611; organisational resource availability: 0.807; competi-tive pressure: 0.794; vendor selection: 0.772; managers’ innovacompeti-tiveness: 0.689; and owner-manager’s IT knowledge: 0.624. These values indicated that the constructs and their respective measurement items had strong internal consistency and were suitable for the study.
4. Data analysis and hypotheses testing
4.1. Data analysis
Descriptive statistics were used to explain the fundamental features of the data in regard to the proportion of BI adoption in each level. From 427 responses, 206 organisations were categorised as being at the operate level, 136 organisations at the consolidate level, 73 organisations at the inte-grate level, 12 organisations at the optimise level and no organisation at the innovate level. However, Israel (2009) recommended a minimum sample size of around 20% for each group when samples were categorised into sub-groups. Consequently, the two levels of BI maturity, optimise and inno-vate, were incorporated into a new “integrate +” level. The “integrate +” level yielded 85 organisa-tions. The dependent variables of BI adoption are thus: operate, consolidate and integrate +.
Multinomial logistic regression was formed to test the hypotheses due to the dependent variable being the level of BI adoption, and all independent variables coming from the proposed model. Logistic regression is suitable for this situation in which the dependent variable is categorised (Hosmer, Lemeshow, & Sturdivant, 2013; Pett, 1997; Stevens, 1946). Also, as this regression requires fewer assumptions than discriminant analysis, it was more robust in the face of data conditions. Even though the multinomial logistic regression does not require any assumptions of normality, linearity and homogeneity of variance for the independent variables, it does require identification of numerical problems in multicollinearity between the independent variables. According to Hair, Black, Babin, Anderson and Tatham (2010), when numerical problems are found, the analysis should be ignored and not interpreted. In order to detect multicollinearity in this study, the standard errors for beta coefficients were identified as having no error values higher than the limit of 2.0. Therefore, no numerical problems or multicollinearity issues were found in the independent variables of this study.
To assess the overall fit of the model, the difference between twice the log of likelihood (−2LL) in the base model (intercept only) and proposed model (with intercept and independent) was com-pared. A summary of the results obtained by fitting a linear model to the dependent variable is shown in Table 3. Results show that the full model is significant (χ2 = 606.580, df = 18, p < 0.01) and
the pseudo-coefficients of determination for the model are relatively high (Cox and Snell 0.867; Nagelkerke 0.758 and McFadden 0.685). Model classification in Table 4 shows that 97.6% of the op-erate group, 83.8% of the consolidate group and 72.9% of the integrate + group were correctly clas-sified. As a result, the overall percentage correctly predicted was 88.3%. Given that these three categories were correctly predicted, the results are impressive and fully confirm the usefulness of the model.
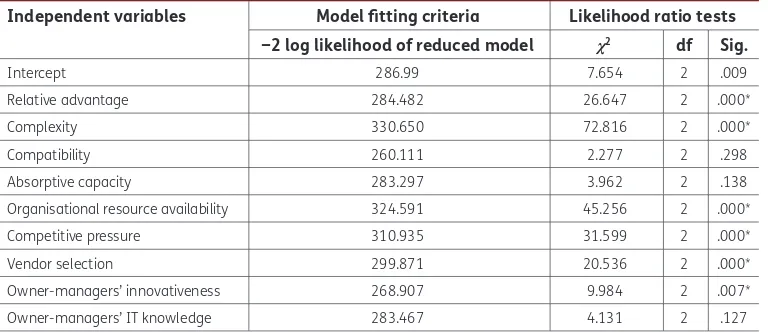
In order to assess relationships between the dependent variable and independent variables, re-sults from the likelihood ratio test using multinomial logistic regression were interpreted (see Table
the levels of BI adoption. The six were relative advantage, complexity, organisational resource avail-ability, competitive pressure, vendor selection and owner-managers’ innovativeness. Thus, support for Hypothesis H1, H2, H5, H6, H7 and H8 was provided.
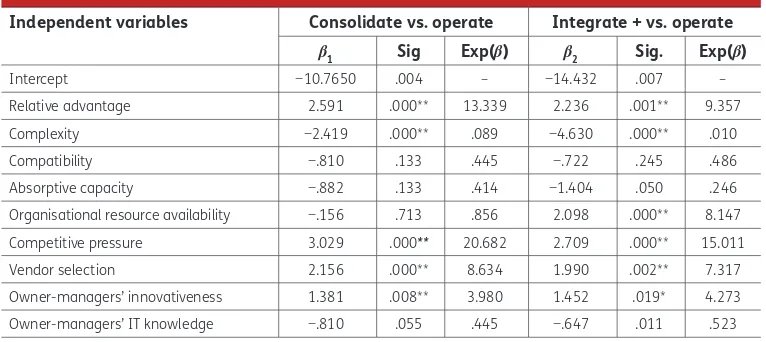
Effects of the significant independent variables differentiating the levels of BI adoption can be more deeply analysed using the parameter estimates from multinomial logistic regression (see Table 6). In this study, the reference group was defined as the dependent variable group “operate” and was used to test the predicting power of the independent variables in differentiating the other two groups (both the “consolidate” and “integrate +”) from the reference group. The results of two separate regressions showed that all six independent factors that found significant relationships with the levels of BI adoption could be successfully distinguished between consolidate and operate, and integrate + and operate, with the exception of organisational resource availability that could not be differentiated between consolidate and operate. Furthermore, taking into consideration the char-acteristics of this analysis, positive signs of β increased the odds and negative signs of β decreased the odds that an individual organisation belonged to the reference group (operate) (Hair et al., 2010).
Table 3. Model fitting summary
Source: SPSS multinomial logistic regression (2016).
Model −2 Log likelihood χ2 df Sig.
Intercept only 885.916
Final 279.335 606.580 18 .000
Pseudo-R-suare Cox and Snell 0.867 Nagelkerke 0.758 McFadden 0.685
Table 4. Classification accuracy
Source: SPSS multinomial logistic regression (2016).
Observed Predicted
Operate Consolidate Integrate + (%) Correct
Operate 201 5 0 97.6
Consolidate 5 114 17 83.8
Integrate + 3 20 62 72.9
Overall percentage 48.9% 32.6% 18.5% 88.3
Table 5. Likelihood ratio tests
Source: SPSS multinomial logistic regression (2016). *Represents significant level at 0.01.
Independent variables Model fitting criteria Likelihood ratio tests −2 log likelihood of reduced model χ2 df Sig.
Intercept 286.99 7.654 2 .009
Relative advantage 284.482 26.647 2 .000*
Complexity 330.650 72.816 2 .000*
Compatibility 260.111 2.277 2 .298
Absorptive capacity 283.297 3.962 2 .138
Organisational resource availability 324.591 45.256 2 .000*
Competitive pressure 310.935 31.599 2 .000*
Vendor selection 299.871 20.536 2 .000*
Owner-managers’ innovativeness 268.907 9.984 2 .007*
As shown in Table 6, based on both regressions, five of the six significant factors were found to be positive sign. For example, a positive β1 of the relative advantage (2.591) indicated that organisa-tions in the consolidate group had a higher perception of BI relative advantage than those in the operate group. Only one factor, complexity, had a negative β1 (−2.419), indicating that these organi-sations in the consolidate group had a lower perception of BI complexity than those in the operate group.
5. Discussion of findings
The first main research aim of the study was to investigate the current stage of BI adoption in SMEs. Findings showed that Thai SMEs are at an early stage of BI adoption, with high numbers classified in the lowest level (operate). This is in line with previous studies that found the adoption of IT, enter-prise systems by SMEs is still low in many countries. For example, a comparative analysis between SMEs and large enterprises in Germany by Struker and Gille (2010) found that the use of customer relationship management, ERP and BI systems was lower among SMEs. This result is the same in Taiwan, where ERP was at an early development for SMEs, and had not yet attained maturity stage (Chang et al., 2010). A national survey of SMEs’ use of IT in the UK by Dyerson, Harindranath and Barnes (2008) revealed that although there was extensive use of IT to automate recordings of sales and processing of orders, the use of more complex technology like ERP and BI was low. The main reason for this may be due to financial and human resources not being readily available, despite SMEs often operating in chaos when managing data (Rajteric, 2010). Therefore, this low operate level in SMEs can be seen as the starting point for adoption of BI because BI applications used by organisa-tions in this level are not complicated and do not require high IT infrastructure or knowledge to im-plement. The problem here is that these low BI applications may be insufficient to clean up and link the data in a meaningful way to gain benefit from information assets and improve opportunities.
Another aim of this research was to develop and test a BI maturity adoption model that can iden-tify the levels of BI adoption in SMEs and the factors that impact these levels. Tests of reliability and validity found that the proposed research model is a good measurement tool with six of the nine factors supporting the research hypotheses. Relative advantage and complexity were significant in BI adoption, which is consistent with prior research (Ghobakhloo et al., 2011; Grandon & Pearson, 2004; Ramamurthy et al., 2008). Interestingly, results in this study also indicate that the higher the perception of relative advantage and the lower the complexity, the more likely SMEs will adopt higher levels of BI technology. As SMEs have limited resources for IT investment and BI adoption is
Table 6. Parameter estimates
Note: The reference category is operate.
Source: SPSS multinomial logistic regression (2016). *Represents significant level at 0.05.
**Represents significant level at 0.01.
Independent variables Consolidate vs. operate Integrate + vs. operate
β1 Sig Exp(β) β2 Sig. Exp(β)
Intercept −10.7650 .004 – −14.432 .007 –
Relative advantage 2.591 .000** 13.339 2.236 .001** 9.357
Complexity −2.419 .000** .089 −4.630 .000** .010
Compatibility −.810 .133 .445 −.722 .245 .486
regarded as a risky undertaking (Hustad & Olsen, 2014), when owner-managers have relevant infor-mation and understand its advantages, their adopt decisions can be supported. Surprisingly, com-patibility factor was not found to be significant in a BI adoption decision. A possible explanation for this may be that BI is not used as the main operational technology in the business, but only used to support the analysis and sharing of relevant information (Sahay & Ranjan, 2008). This would infer that the use of this technology may not require radical changes in the routine business practices.
Organisational resource availability was found to be a significant factor influencing SMEs’ BI adop-tion decisions. SMEs with high organisaadop-tional resource availability were found to show a greater likelihood of adopting high levels of BI, whereas low organisational resource availability showed low levels of BI adoption. Insufficient financial and technological resource may force SMEs to be cautious with their investment and capital expenditure and be the reason that they adopt lower levels of BI technology. The implementation of new IT normally requires a long-term investment involving high costs in IT infrastructure. Consequently, only SMEs with adequate financial resources would regard the adoption of BI as a feasible project to undertake. Another finding was that absorptive capacity was not a significant determinant of decisions to adopt BI in participant SMEs. A possible explana-tion for this may be that SME owner-managers are the IT decision-makers who can ignore their or-ganisations’ absorptive capability if they regard the technology as necessary and are willing to take risks in adopting new technology (Fuller-Love, 2006).
Competitive pressure and vendor selection factors were found to have significance in the levels of BI adoption in SMEs. The results indicated that the more the firm perceives competitive pressure, the more likely it is that they will adopt higher levels of BI technology. As SMEs now face more competi-tive challenges due to the rapid development of IT, these pressures can signal the need to adopt advanced technologies that improve organisational performance (Beheshti, Hultman, Jung, Opoku, & Salehi-Sangari, 2007). According to Hocevar and Jaklic (2010), managers cannot maintain com-petitiveness by merely depending on intuition—they need accurate information-based decision-making. As SME owner-managers usually make intuitive decisions (MacGregor & Vrazalic, 2005), their strategies are based on limited essential skills that frequently fail to meet and achieve their business objectives, resulting in a loss of competitiveness (Pansiri & Temtime, 2008). As SMEs not using BI could fail to compete effectively, intense competition may positively affect their decision to utilise BI technology. In regard to the significance of vendor selection in BI adoption, a possible ex-planation is that SMEs focus on selecting software packages provided by vendors rather than devel-oping their own IT systems. As there are many types of IT vendors in the business analytics market, the selection of a suitable vendor is important (Hiziroglu & Cebeci, 2013). The expertise of the IT vendor can significantly compensate for the lack of internal IT expertise, the difficulty in recruiting IT professionals and the costs of providing required IT training for employees (Thong, 1999).
6. Limitations and further research
The findings of this study should be considered in the light of limitations that need to be acknowl-edged and addressed in future research. First, this study adopted a modified IEM model as the ma-turity model to categorise SMEs into BI levels. Use of a different mama-turity model may yield different results. So further research to compare the criteria in classifying BI levels is to be considered. Second, the sample for this study was drawn from SMEs of four main industries. However, as the character-istics of each industry are different, it may be of interest to examine BI adoption in specific business sectors such as service, manufacturing, wholesale and retail. This would expand the understanding of the engagement process in the adoption of BI. Third, as this study was conducted in Thailand, the results may only be generalisable to countries that have similar industrial infrastructure. Therefore, it would be of interest to conduct the same research in other countries with a different industrial infrastructure to the Thailand context.
7. Conclusion
This study explored the current BI adoption situation of Thai SMEs. The results showed that the ma-jority of Thai SMEs were classified at the lowest level, suggesting that they are still at an early stage of BI technology adoption. This leaves ample scope for Thai SMEs to be elevated into higher levels by focusing on understanding the enabling factors of BI as a strategy. In identifying the factors that elevate BI levels in Thai SMEs, results found that high relative advantage, high organisational re-source availability, high competitive pressure, high vendor selection, high owner-managers’ innova-tiveness and low levels of complexity were all important.
By acknowledging the current stage of BI adoption and understanding the enabling factors that encourage Thai SMEs to move to higher levels, government agencies and technology suppliers can develop strategies to advance BI adoption. Initiatives that could support the use of more advanced BI could be through marketing and advertising campaigns that persuade SME owner-managers on the perceived potential advantage of using BI technologies, as well as to provide financial support and educational seminars to increase their innovativeness. IT vendors can also help advance SMEs to higher BI levels by providing their expertise for customised solutions relevant to the particular SME. Interactions between the SME and IT vendor can further benefit them in navigating the com-plexities of BI technology choice and implementation.
Funding
This work was supported by the Thai Studies Field Research Grant from the Royal Thai Embassy and the Asia Institute, University of Melbourne.
Author details
Waranpong Boonsiritomachai1 E-mail: waranpong@gmail.com G. Michael McGrath2
E-mail: michael.mcgrath@vu.edu.au Stephen Burgess2
E-mail: stephen.burgess@vu.edu.au
1 Faculty of Management and Tourism, Burapha University,
Chonburi, Thailand.
2 College of Business, Victoria University, Melbourne, Australia.
Citation information
Cite this article as: Exploring business intelligence and its depth of maturity in Thai SMEs, Waranpong Boonsiritomachai, G. Michael McGrath & Stephen Burgess, Cogent Business & Management (2016), 3: 1220663. References
Adler-Milstein, J., & Bates, D. W. (2010). Paperless healthcare: Progress and challenges of an IT-enabled healthcare system. Business Horizons,53, 119–130.
http://dx.doi.org/10.1016/j.bushor.2009.10.004
Bajaj, A. (2000). A study of senior information systems manager’s decision models in adopting new computing
architectures. Journal of The Association for Information Systems,1, 1–56.
Beheshti, H. M., Hultman, M., Jung, M.-L., Opoku, R. A., & Salehi-Sangari, E. (2007). Electronic supply chain management applications by Swedish SMEs. Enterprise Information Systems,1, 255–268.
http://dx.doi.org/10.1080/17517570701273221
Brimble, P., Oldfield, D., & Monsakul, M. (2002). Policies for SME recovery in Thailand. In C. Harvie & B. C. Lee (Eds.),
The role of SMEs in national economies in East Asia (pp. 202–237). Cheltenham: Edward Elgar.
Chang, S. I., Hung, S. Y., Yen, D. C., & Lee, P. J. (2010). Critical factors of ERP adoption for small–and medium–sized enterprises. Journal of Global Information Management, 18, 82–106.
http://dx.doi.org/10.4018/JGIM
Chao, C. A., & Chandra, A. (2012). Impact of owner’s knowledge of information technology (IT) on strategic alignment and IT adoption in US small firms. Journal of Small Business and Enterprise Development,19, 114–131.
http://dx.doi.org/10.1108/14626001211196433
Chaudhuri, S., Dayal, U., & Narasayya, V. (2011). An overview of business intelligence technology. Communications of the ACM,54, 88–98.
http://dx.doi.org/10.1145/1978542
Cheung, C., & Li, F. (2012). A quantitative correlation coefficient mining method for business intelligence in small and medium enterprises of trading business. Expert Systems with Applications, 39, 6279–6291.
Chong, S. (2008). Success in electronic commerce implementation. Journal of Enterprise Information Management,21, 468–492.
http://dx.doi.org/10.1108/17410390810904247
Chuach, M. (2010). An Enterprise Business Intelligence Maturity Model (EBIMM): Conceptual framework.
Knowledge Creation Diffusion Utilization Journal,12, 303–308.
Damanpour, F., & Evan, W. M. (1984). Organizational innovation and performance: The problem of “organizational lag”.
Administrative Science Quarterly,29, 392–409.
http://dx.doi.org/10.2307/2393031
Davenport, T. H. (2000). Mission critical: Realising the promise of enterprise systems. Boston, MA: Harvard Business Press. Davis, J., Miller, G. J., & Russell, A. (2006). Information
revolution: Using the information evolution model to grow your business. New Jersey, NJ: John Wiley & Sons. Dholakia, R. R., & Kshetri, N. (2004). Factors impacting the
adoption of the internet among SMEs. Small Business Economics,23, 311–322.
http://dx.doi.org/10.1023/B:SBEJ.0000032036.90353.1f
Dyerson, R., Harindranath, G., & Barnes, D. (2008). National survey of SMEs’ use of IT in four sectors.Paper presented at the 2nd European Conference on Information Management and Evaluation, Montpellier. Eckerson, W. (2007). Predictive analytics–extending the
value of your data warehousing investment. The Data Warehousing Institute. Retrieved November 27, 2013, from http://www.teradata.com/t/ assets/0/206/308/35d4edc6-3408-4cbd-8946-a803e49d8288.pdf
Elbashir, M., Collier, P. A., & Davern, M. (2008). Measuring the effects of business intelligence systems: The relationship between business process and organizational performance. International Journal of Accounting Information Systems,9, 135–153.
http://dx.doi.org/10.1016/j.accinf.2008.03.001
Fernández, Z., & Nieto, M. J. (2006). Impact of ownership on the international involvement of SMEs. Journal of International Business Studies,37, 340–351.
http://dx.doi.org/10.1057/palgrave.jibs.8400196
Fichman, R. G. (2000). The diffusion and assimilation of information technology innovations. In R. W. Zmud (Ed.),
Framing the domains of IT management: Projecting the future through the past (pp. 105–127). Cincinnati, OH: Pinnaflex Publishing.
Fogarty, G. J., & Armstrong, B. (2009). Modelling the interactions among factors that influence successful computerisation of small businesses. Australasian Journal of Information Systems,15, 73–89.
Fuller-Love, N. (2006). Management development in small firms. International Journal of Management Reviews,8, 175–190. http://dx.doi.org/10.1111/ijmr.2006.8.issue-3
Gäre, K., & Melin, U. (2011). SMEs need formative infrastructure for business transformation. Journal of Enterprise Information Management,24, 520–533.
http://dx.doi.org/10.1108/17410391111166558
Gartner. (2013). Gartner executive program survey of more than 2,000 CIOs shows digital technologies are top priorities in 2013. Retrieved from http://www.gartner.com/newsroom/ id/2304615
Ghobakhloo, M., Arias-Aranda, D., & Benitez-Amado, J. (2011). Adoption of e-commerce applications in SMEs. Industrial Management & Data Systems,111, 1238–1269. Grabova, O., Darmont, J., Chauchat, J.-H., & Zolotaryova, I.
(2010). Business intelligence for small and middle-sized entreprises. ACM SIGMOD Record,39, 39–50.
http://dx.doi.org/10.1145/1893173
Grandon, E. E., & Pearson, J. M. (2004). Electronic commerce adoption: An empirical study of small and medium US businesses. Information & Management,42, 197–216.
Griffith, T. L., Sawyer, J. E., & Neale, M. A. (2003). Virtualness and knowledge in teams: Managing the love triangle of organisations, individuals, and information technology.
MIS Quarterly,27, 265–287.
Habjan, A., & Popovic, A. (2007). Achieving business process change with improved business intelligence systems: A case of Slovenian company. Paper presented at the the 7th WSEAS International Conference on Applied Computer Science, Venice.
Hair, J. F., Black, W. C., Babin, B. Y. A., Anderson, R. E., & Tatham, R. L. (2010). Multivariate data analysis: A global perspective (5th ed.). Englewood Cliffs, NJ: Pearson Prentice Hall.
Hannula, M., & Pirttimaki, V. (2003). Business intelligence empirical study on the top 50 Finnish companies. Journal of American Academy of Business,2, 593–599.
Hawking, P., Foster, S., & Stein, A. (2008). The adoption and use of business intelligence solutions in Australia.
International Journal of Intelligent Systems Technologies and Applications,4, 327–340.
http://dx.doi.org/10.1504/IJISTA.2008.017276
Hill, J., & Scott, T. (2004). A consideration of the roles of business intelligence and e-business in management and marketing decision making in knowledge based and high-tech start-ups. Qualitative Market Research: An International Journal,7, 48–57.
http://dx.doi.org/10.1108/13522750410512877
Hiziroglu, A., & Cebeci, H. İ. (2013). A conceptual framework of a cloud-based customer analytics tool for retail SMEs.
Paper presented at the the 13th European Conference in Technology and Society (eurotecs’ 13), Bosnia.
Hocevar, B., & Jaklic, J. (2010). Assessing benefits of business intelligence systems—A case study. Journal of Management,15, 87–119.
Hosmer, D. W., Lemeshow, S., & Sturdivant, R. X. (2013). Applied logistic regression (3rd ed.). New York, NY: Wiley.
http://dx.doi.org/10.1002/9781118548387
Hung, S. Y., Hung, W. H., Tsai, C. A., & Jiang, S. C. (2010). Critical factors of hospital adoption on CRM system: Organizational and information system perspectives.
Decision Support Systems,48, 592–603.
http://dx.doi.org/10.1016/j.dss.2009.11.009
Hustad, E., & Olsen, D. H. (2014). ERP implementation in an SME: A failure case information systems for small and medium-sized enterprises (pp. 213–228). Berlin: Springer. Hwang, H. G., Ku, C. Y., Yen, D. V., & Cheng, C. C. (2004). Critical
factors influencing the adoption of data warehouse technology: A study of the banking industry in Taiwan.
Decision Support Systems,37(1), 1–21.
http://dx.doi.org/10.1016/S0167-9236(02)00191-4
Iacovou, C. L., Benbasat, I., & Dexter, A. S. (1995). Electronic data interchange and small organizations: Adoption and impact of technology. MIS Quarterly,19, 465–485.
http://dx.doi.org/10.2307/249629
IDC. (2013). Worldwide business analytics software 2013–2017 forecast and 2012 vendor shares. Retrieved from https:// www.idc.com/getdoc.jsp?containerId=241689
IDC. (2015). IDC predictions 2015: Accelerating innovation— and growth. Retrieved from https://www.idc.com/ research/viewtoc.jsp?containerId=252700
Ifinedo, P. (2011). An empirical analysis of factors influencing Internet/e-business technologies adoption by SMEs in Canada. International Journal of Information Technology & Decision Making,10, 731–766.
Igartua, J. I., Garrigós, J. A., & Hervas-Oliver, J. L. (2010). How innovation management techniques support an open innovation strategy. Research-Technology Management, 53, 41–52.
Jeyaraj, A., Rottman, J. W., & Lacity, M. C. (2006). A review of the predictors, linkages, and biases in IT innovation adoption research. Journal of Information Technology, 21(1), 1–23.
Khalifa, M., & Davison, M. (2006). SME adoption of IT: The case of electronic trading systems. IEEE Transactions on Engineering Management,53, 275–284.
http://dx.doi.org/10.1109/TEM.2006.872251
Klimko, G. (2001, 8–9 November). Knowledge management and maturity models: Building common understanding. Paper presented at the the 2nd European Conference on Knowledge Management, Bled.
Ko, S., & Abdullaev, S. (2007, 26–29 August). A study on the aspects of successful business intelligence system development.Paper presented at the the International Conference on Computational Science, Kuala Lumpur.
Lahrmann, G., Marx, F., Winter, R., & Wortmann, F. (2010, 8–9 October). Business intelligence maturity models: an overview.Paper presented at the the 7th Conference of the Italian Chapter of AIS, Naples.
MacGregor, R. C., & Vrazalic, L. (2005). The effects of strategic alliance membership on the disadvantages of electronic commerce adoption. Journal of Global Information Management,13, 1–19.
http://dx.doi.org/10.4018/JGIM
McDonald, K. (2004). Is SAP the right infrastructure for your enterprise analytics′.Paper presented at the the American SAP User Group Conference, Atlanta, GA.
Mehrtens, J., Cragg, P. B., & Mills, A. M. (2001). A model of Internet adoption by SMEs. Information & Management, 39, 165–176.
Mirchandani, D. A., & Motwani, J. (2001). Understanding small business electronic commerce adoption: An empirical analysis. Journal of Computer Information Systems,41, 70–73.
Moffett, S., & McAdam, R. (2003). Contributing and enabling technologies for knowledge management. International Journal of Information Technology and Management,2, 31–49.
http://dx.doi.org/10.1504/IJITM.2003.002447
Moore, G. C., & Benbasat, I. (1991). Development of an instrument to measure the perceptions of adopting an information technology innovation. Information Systems Research,2, 192–222.
http://dx.doi.org/10.1287/isre.2.3.192
Negash, S., & Gray, P. (2008). Handbook on decision support systems 2. Berlin: Springer.
http://dx.doi.org/10.1007/978-3-540-48716-6
Niu, L., Lu, J., & Zhang, G. (2009). Cognition-driven decision support for business intelligence–Models, techniques, systems and applications. Berlin: Springer.
http://dx.doi.org/10.1007/978-3-642-03208-0
O’Brien, J., & Kok, J. A. (2006). Business intelligence and the telecommunications industry: Can business intelligence lead to higher profits? South African Journal of Information Management,8(3), 1–20.
Oliveira, T., & Martins, M. F. (2010). Understanding e-business adoption across industries in European countries.
Industrial Management & Data Systems,110, 1337–1354. Pansiri, J., & Temtime, Z. T. (2008). Assessing managerial skills
in SMEs for capacity building. Journal of Management Development,27, 251–260.
http://dx.doi.org/10.1108/02621710810849362
Parasuraman, A. (2000). Technology readiness index (TRI): A multiple-item scale to measure readiness to embrace new technologies. Journal of Service Research,2, 307–320.
http://dx.doi.org/10.1177/109467050024001
Pett, M. A. (1997). Nonparametric statistics in health care research: Statistics for small samples and unusual distributions. Thousand Oaks, CA: Sage. Pirttimaki, V., Lonnqvist, A., & Karjaluoto, A. (2006).
Measurement of business intelligence in a finnish telecommunications company. Electronic Journal of Knowledge Management,4, 83–90.
Pornwasin, A. (2015, 28, November). IT spending to rise 10.6% in 2015, IDC predicts. The Nation. Retrieved from http:// www.nationmultimedia.com/business/IT-spending-to-rise-10-6-in-2015-IDC-predicts-30248712.html
Rajteric, I. H. (2010). Overview of business intelligence maturity models. Management,15, 47–67.
Ramamurthy, K., Sen, A., & Sinha, A. P. (2008). An empirical investigation of the key determinants of data warehouse adoption. Decision Support Systems,44, 817–841. doi:
http://dx.doi.org/10.1016/j.dss.2007.10.006
Ranjan, J. (2005). Business intelligence: Concepts, components, techniques and benefits. Journal of Theoretical and Applied Information Technology,9, 600–607.
Rogers, E. M. (1983). Diffusion of innovation (3rd ed.). New York, NY: Free Press.
Sacu, C., & Spruit, M. (2010). BIDM: The business intelligence development model. Paper presented at the the 12th International Conference on Enterprise Information Systems, Funchal.
Sahay, B. S., & Ranjan, J. (2008). Real time business intelligence in supply chain analytics. Information Management & Computer Security,16, 28–48.
Segal, H. P. (1994). Future imperfect: The mixed blessings of technology in America. Amherst, MA: University of Massachusetts Press.
Soanes, C., & Stevenson, A. (2008). Concise Oxford English dictionary (11th ed.). New York, NY: Oxford University Press.
Stevens, S. S. (1946). On the theory of scales of measurement.
Science,103, 677–680.
http://dx.doi.org/10.1126/science.103.2684.677
Struker, J., & Gille, D. (2010). RFID adoption and the role of organisational size. Business Process Management Journal,16, 972–990.
Tan, M., & Lin, T. T. (2012). Exploring organizational adoption of cloud computing in Singapore. Paper presented at the the 19th ITS Biennial Conference, Bangkok.
Teo, T. S. (2007). Organizational characteristics, modes of internet adoption and their impact. Journal of Global Information Management,15, 91–117.
http://dx.doi.org/10.4018/JGIM
The Economist Intelligence Unit. (2007). Business intelligence: Putting enterprise data to work. Retrieved from http://www. eiu.com/report_dl.asp?mode=fi&fi=252823010.PDF&rf=0
Themistocleous, M., Irani, Z., Kuljis, J., & Love, P. E. D. (2004). Extending the information system lifecycle through enterprise application integration: A case study experience.Paper presented at the the 37th Annual Hawaii International Conference, Hawaii.
Thong, J. (1999). An integrated model of information systems adoption in small businesses. Journal of Management Information Systems,15, 187–214.
http://dx.doi.org/10.1080/07421222.1999.11518227
Tornatzky, L. G., & Fleischer, M. (1990). The process of technology innovation. Massachusetts, MA: Lexington Books.
Tornatzky, L. G., & Klein, K. J. (1982). Innovation characteristics and innovation adoption-implementation: A meta-analysis of findings. IEEE Transactions on Engineering Management,29, 28–45.
© 2016 The Author(s). This open access article is distributed under a Creative Commons Attribution (CC-BY) 4.0 license.
Voicu, V., Zirra, D., & Ciocirlan, D. (2009). Business intelligence effective solutions of management. Paper presented at the the 10th WSEAS international conference on Mathematics and computers in business and economics, Prague.
Williams, S., & Williams, N. (2003). The business value of business intelligence. Business Intelligence Journal,8, 30–39.
Wixom, B. H., & Watson, H. J. (2010). The BI-based organization.
International Journal of Business Intelligence Research,1, 13–28. http://dx.doi.org/10.4018/IJBIR
Zhu, K., Dong, S., Xu, S. X., & Kraemer, K. L. (2006). Innovation diffusion in global contexts: Determinants of post-adoption digital transformation of European companies.
European Journal of Information Systems,15, 601–616.