An Efficient Detection of Flood Extent
from Satellite Images Using Contextual
Features and Optimized Classification
Prabhaa N. M., J. Nanthini
M.E – Applied Electronics, Department of ECE, Jay Shri Group of Institutions, Tiruppur, Tamilnadu, India
Associate Professor, Department of ECE, Jay Shri Group of Institutions, Tiruppur, Tamilnadu, India
ABSTRACT: Floods are among the most destructive natural disasters worldwide. In flood disaster management programs, flood mapping is an initial step. It provides an efficient methodology to recognize and map flooded areas by using TerraSAR-X imagery. First, a TerraSAR-TerraSAR-X satellite image is captured during a flood event in some places, to map the inundated areas. Multispectral Landsat imagery is then used to detect water bodies prior to the flooding. Both the two terrasar-x image and landsat image are compared according to the three parameters such as shape, color and scale etc. Before that the speckles are removed from both the images using frost filter then gaps are filled using Local linear histogram matching method after that pan sharpening is done by gram-schmidt spectral sharpening method. The second stage is segmentation of the images. Segmentation is done by multi-resolution process using Taguchi technique. In synthetic aperture radar (SAR) imagery, the water bodies and flood locations appear in black; thus, both objects are classified as one. The class of the water bodies was extracted from the Landsat image and then subtracted from that extracted from the TerraSAR-X image. The remaining water bodies represented the flooded locations. Object-oriented classification and Taguchi method are implemented for both images. The Landsat images are categorized into three classes, namely, urban, vegetation, and water bodies. The classification results are evaluated using a confusion matrix. Consequently, the flooded locations are recognized and mapped by subtracting the two classes of water bodies from these images.
KEYWORDS: Flood mapping, GIS, terraSAR-X, Landsat, Remote Sensing, Rule-based Classification, Confusion matrix.
I. INTRODUCTION
A flood is an overflow of water that submerges land which is usually dry. It may occur as an overflow of water from water bodies, such as a river, lake, or ocean, in which the water overtops or breaks levees, resulting in some of that water escaping its usual boundaries, or it may occur due to an accumulation of rainwater on saturated ground in an area flood. While the size of a lake or other body of water will vary with seasonal changes in precipitation and snow melt, these changes in size are unlikely to be considered significant unless they flood property or drown domesticanimals. Floods can also occur in rivers when the flow rate exceeds the capacity of the river channel, particularly at bends or meanders in the waterway. Floods often cause damage to homes and businesses if they are in the natural flood plains of rivers. While revering flood damage can be eliminated by moving away from rivers and other bodies of water, people have traditionally lived and worked by rivers because the land is usually flat and fertile and because rivers provide easy travel and access to commerce and industry.
they will not stay for long duration. Furthermore, traditional hydrological methods, such as gauge and discharge measurements, have some weak points to monitor and map flood locations because of the temporal and spatial heterogeneity of large wetlands.
Flood areas can be extracted from multi-pass SAR data through amplitude change detection techniques or the generation of a coherence map. The amplitude change detection method compares two SAR images of the same scene: one captured prior to flooding and the other during or immediately after the event. Subsequently, the water-filled zones can be detected by determining the regions with reduced backscatter. However, amplitude change detection techniques are limited by their difficulty and by the significant amount of time required to classify at least two SAR data. SAR informatory should be conducted to produce a coherence map; however, this technique is often difficult to understand and interpret. The generation of a coherence map is also complex and disadvantageous; for instance, it requires ground data and two precisely co-registered SAR images. The ground data distinguish flooded areas from other low-coherence zones.
II. STUDYAREAANDDATAUSED
In Namibia, Angola and parts of Zambia’s Western Province area has undergone much flooded on first half of 2009. Therefore, it was selected as the study area, in which the efficiency of the proposed method can be evaluated with respect to flood location detection (Fig. 1). On March 24, 2009, a disastrous flood struck this area as a result of heavy precipitation. On that day, emergency was declared in the concerned areas, where floods have caused large-scale destruction to homes, schools, health facilities, mahangu and maize fields and infrastructure. Therefore, this research utilized two data sources: TerraSAR-X imagery captured during flooding and Landsat imagery recorded during a non-flood instance. The applied SAR data were collected by a TerraSAR-X satellite on March 24, 2016, using HH polarization, single look, and 3 m of spatial resolution. Furthermore, the data were composed of strip map modus and short TSX-1 images with 16-b radiometric resolution. HH polarization data are less affected by the variations in the roughness of water surfaces as caused by wind or vegetation than other polarization types. On March 18, 2016, Landsat imagery with a spatial resolution of 28.5 m was acquired. The image was obtained from path 126 and row 56. However, its spatial resolution was enhanced after pan-sharpening, which is described in the section on preprocessing.
III. METHODOLOGY
The general methodology implemented in this study is shown in Fig. 2. In the first stage, preprocessing was done for both images of Landsat and TerraSAR-X. Speckles were removed from TerraSAR-X using ISODATA method. Gap filling and pan-sharpening were applied for Landsat imagery in order to solve the problem of gaps in Landsat and increase the spatial resolution of this data. In order to perform object-oriented rule based classification schemes, two main steps should be done. The first stage is segmentation, which defines the boundary of the objects. Here, Taguchi optimization technique was used in order to find the optimum segmentation combination. In the second stage, rules were defined, and classification was done based on the derived rules. Three classes of vegetation, water, and urban were produced using the Landsat image. Similarly, TerraSAR-X was classified into two classes of water and non water bodies. By subtracting the two classes of water bodies from Landsat and TerraSAR-X, flooded areas were extracted. As a last step, validation was done using a confusion matrix, and reliability of flooded area map was assessed. Each stage is detailed in the succeeding sections.
A. Image preprocessing
removed from the TerraSAR-X image using appropriate filters. Filters such as Lee, Frost, and mean can suppress and smooth out the speckle effect. However, each filter performs differently; consequently, not all are equally appropriate. A filter should not distort and degrade the inherent texture of the image. Thus, some of the filters were evaluated based on signal-to-noise ratio (SNR). Based on the visual interpretation and SNR values acquired in the current research, the Frost filter was better than the other filters. It accurately displayed the study area with low noise and no blurring effect. A 4 × 4 window Frost filter was therefore utilized to remove the speckle from TerraSAR-X imagery.
B. Rule-Based Classification
The classification techniques that are used to classify very high resolution optical images, including those urban areas, are often unadoptable for SAR data. Object oriented classification is based on objects rather than on pixels using additional information, such as the texture and color of the objects. Using this additional information, object-oriented classification recognizes features such as floods more effectively than pixel-based techniques. Moreover, this method involves two main steps, namely, segmentation and proper definition of rules.
1) Segmentation based on Taguchi optimization algorithm
In object oriented classification, parameters such as scale, color, shape, and segments should be defined properly to recognize flooded areas. Segmentation is the first stage in object-oriented analysis, and it partitions an image into non-overlapping regions. Segmentation precision significantly influences the quality of the final classified map. Therefore, this module used the multi-resolution segmentation algorithm. It began with one pixel and progressed until all of the criteria were fulfilled. This type of segmentation was achieved through parameters such as scale, color, and shape, which generate 243 combinations for segmentation. The Taguchi technique can obtain the optimum combination of segmentation parameters to
get the better segmentation precision.In this module, multiple parameters such as scale, color, shape, texture, position and segments should be
Fig.2 Methodology flowchart.
defined properly to recognize flooded areas. Segmentation is the first stage in object-oriented analysis, and it partitions an image into non-overlapping regions. Segmentation precision significantly influences the quality of the final classified map. Therefore, this module used the fuzzy multi-resolution segmentation algorithm. It began
with one pixel and progressed until all of the criteria were fulfilled. This type of segmentation was achieved through parameters such as scale, color, shape, texture and position, which generate more than 300 combinations for segmentation. The fuzzy set theory technique can obtain the optimum combination of segmentation parameters to get the better segmentation precision.
2) Rule Definition
Rule-based classification aims to enhance feature classification precision. Moreover, a user can create and flexibly manipulate rules until the best classification results are obtained. The necessary rules were manually defined according to the segment attributes of both images. Based on the rules, system segments and classifies the water and non water contents.
Table I Defined Rules for TerraSAR-X image
Classes Rules
Water bodies 25<HH band< 100 9679<Area<3030705 160.4<Texture variance<1500
Non water bodies
HH band>100 Area>3030705 Texture variance>1500
To apply the general steps in the Taguchi method, the following steps were performed. 1) The process objective was determined in the beginning. This step entails defining the possible values of a particular parameter for the process. 2) The parameters that can influence the process were then defined. These parameters (scale, color, and shape) exhibit variable values that can affect performance; thus, the level should be defined by the user depending on the parameter’s effect on the process. For instance, a scale value can vary from 0.1 to 1.0.
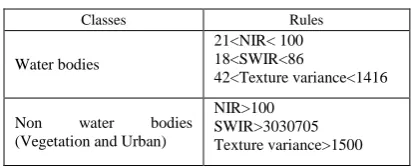
Table II Defined Rules for Landsat Image
Classes Rules
Water bodies
21<NIR< 100 18<SWIR<86
42<Texture variance<1416
Non water bodies
(Vegetation and Urban)
NIR>100 SWIR>3030705 Texture variance>1500
When the level increases, the number of experiments to be conducted will be increased as well. 3) An orthogonal array was created to design the condition and determine the number of experiments. Selecting the orthogonal array depends on the number of levels and the number of parameters. 4) The experiments were then applied after the appropriate array had been selected. The effect of each parameter on the performance was then measured.
C. Performance comparison
In this module, the performance of Taguchi method and fuzzy set theory techniques are compared. Taguchi technique is very useful in reducing the time required to employ all possible segmentation combinations as it reduced the number of possible combinations. Taguchi method and fuzzy set theory techniques are compared by using the some metrics, such as accuracy, precision, recall and f-measure. Accuracy is the degree of conformance between a measurement of an observable quantity and a recognized standard or specification that indicates the true value of the quantity. Precision is the resolution of the representation, typically defined by the number of decimal or binary digits. Recall (also known as sensitivity) is the fraction of relevant instances that are retrieved. Both precision and recall are therefore based on an understanding and measure of relevance. A measure that combines precision and recall is the harmonic mean of the precision and recall, the traditional F-measure or balanced F-score.
F= 2*(precision* Recall)/(precision + recall)
Table III Confusion matrix for TerraSAR and Landsat images
Actual classes
0 1
Predicted classes 0 107814.0 3092.0
1 15400.0 21150.0
The overall accuracies of the classified maps of the TerraSAR-X and Landsat images are 87 and 87.4593, respectively, thus indicating that the rule-based method efficiently discriminates between objects.
Table IV Confusion matrix for classified images
Actual classes
0 1
True Positive 107814.00 21150.00
False Positive 3092.00 15400.00 False Negative 15400.00 3092.00 True Negative 21150.00 107814.00
Precision 0.97 0.58
Recall or Sensitivity 0.88 0.87
Specificity 0.87 0.88
As a result, an accurate classification map is produced. In this the flood is mapped based on three parameters such as scale, color and shape. There may be chance of error mapping due to its size and texture details. So the proposed system will be designed for the extra parameters such as size and texture details
IV. RESULTS
A. Optimization and Segmentation
As mentioned in the methodology section, combinations can be defined using three parameters, namely, scale, color, and shape. The Taguchi optimization technique reduces the number of combinations. The generated segmentation maps are depicted in. Figure.5 displays the segmentation of the entire Landsat scene; however, Figure.5 displays only a small portion of the segmented TerraSAR-X image given its very high spatial resolution. This small region is presented for enhanced visualization because the segmented areas were very small and could not be observed from afar. The optimum segmentation parameters determined using the Taguchi technique were used to recognize object boundaries with reasonable accuracy. The precision of this segmentation was assessed visually as the boundaries of most of the objects were detected accurately. The results also confirmed the efficiency of the multi resolution segmentation approach.
(a) (b)
B. Classified Maps
The two images of TerraSAR-X and Landsat were classified according to the segmentation results and the defined rules. Fig. 5 illustrates the classified map of the TerraSAR-X image using the rule-based method, which contains two classes, namely, water and non-water bodies. Fig. 6 depicts the classified map of Landsat imagery, which consists of three classes, i.e., urban, vegetation, and water. The extent of the water bodies visualized in the classified Landsat image Fig.5 was less than the amount of water bodies depicted in the TerraSAR-X image Fig.5. The water bodies detected in the classified TerraSAR-X map are flooded regions; by subtracting the two classified water bodies, we determined the locations of the flooded areas. As can be seen in Fig. 7 considerable misclassifications are evident in the result of Fuzzy logic analysis. This observation shows the weakness of unsupervised methods in classification. The confusion matrix gives information about the precision of the results. Fig. 7 illustrates the flood locations detected in the study area by the rule-based method as shown in Tables I and II.
A confusion matrix was generated to assess the efficiency of the proposed method and to evaluate the generated flood inventory map. Tables IV and V display the confusion matrix results for the classified maps of TerraSAR-X using the rule-based and ISODATA classification methods, respectively. Moreover, Table III and VI show the confusion matrix results for Landsat & TerraSAR-X images.
The overall accuracies of the classified maps of the
TerraSAR-X and Landsat images were 86.18 and 93.04, respectively, thus indicating that the rule-based method efficiently discriminates between objects. As a result, an accurate classification map is produced. Moreover, the kappa coefficients were 0.72 and 0.77 for the TerraSAR-X and Landsat classified maps, respectively. Both accuracy assessment results suggest that all of the user and producer accuracy values are reasonably high, thereby suggesting that the generated classes are reliable. The flood location map was constructed by subtracting the two derived water bodies; thus, their accuracy values directly affect map precision. Statistically, 69% of the flood took place in the vegetation areas, and the rest happened in the urban areas. The confusion matrix indicated that both water bodies had high producer and user accuracy values, thus confirming the reliability of the final flood location map generated. However, the overall accuracy achieved by ISODATA was 57.98, which is considerably less than the acquired accuracy from the rule based method.
V. DISCUSSION
This study has presented an approach to overcome the difficulties in flood detection by combining Landsat (medium spatial resolution) and TerraSAR-X (high spatial resolution) imageries. The results of our study correspond with other works suggesting that Landsat data can be useful for water area extraction and mapping. Current research then extends previous studies on combination of various sensors for flood detection using optical and active sensors. The main rationale of using Landsat data in current study was to extract the water bodies before flooding. This can be done using many ways; however, the aim was to use purely space borne remote-sensing-based methods in a cost-effective way. The difference in the spatial resolution can be
50
Fig. 5 Classified TerraSAR image
150 200 250 300 350
50
100
150
200
250
300
350
an issue. However, in this study, the accuracies acquired from both Landsat and TerraSAR-X classifications were reasonably similar, which proved that both datasets were applicable for such application. Finally, in the current research, three issues can be highlighted: the complimentary use of freely downloadable optical Landsat data in flood studies, the segmentation process using the Taguchi algorithm, and the rule-based–object-based method. It is proved that Landsat has significant capability in this kind of research; however, the differences in the spatial resolutions made few misclassifications in the boundary of the water bodies such as river. On the other hand, the Taguchi method was very helpful in reducing the time required to employ all possible segmentation combinations as it reduced. Finally, the rule-based object-based method performed on the segmented data.
Fig.7 Flood affected area
Table Confusion matrix for flood affected area
Sl.No Parameters Flood detection
1 Accuracy 86.2725
2 Precision 0.6122
3 Recall 0.8640
4 F-measure 0.7166
50 100 150 200 250 300 350
50
100
150
200
250
300
350
Water Area Non Water
VI. CONCLUSION
The proposed work presented a new approach for performing flood mapping with some extra parameters such as texture. This approach is based on New Semi-automated detection mapping of flood extent from TerraSAR-X Satellite Image using Rule-Based classification and Taguchi optimization techniques. The approach improves flood mapping by extra parameters such as texture features with more accuracy and reduced budget.
ACKNOWLEDGMENT
The authors would like to thank the meteorological department of Namibia-Angola, for providing various datasets used in this paper in website.
REFERENCES
[1] J. M. Martinez and T. Le Toan, “Mapping of flood dynamics and spatial distribution of vegetation in the Amazon floodplain using multitemporal SAR data,” Remote Sens. Environ., vol. 108, no. 3, pp. 209–223, 2007.
[2] D. C. Mason, M. S. Horritt, J. T. Dall’Amico, T. R. Scott, and P. D. Bates, “Improving river flood extent delineation from synthetic aperture radar using airborne laser altimetry,” IEEE Trans. Geosci. Remote Sens., vol. 45, no. 12, no. 12, pp. 3932–3943, Dec. 2007.
[3] G. Nico, M. Pappalepore, G. Pasquariello, A. Refice, and S. Samarelli, “Comparison of SAR amplitude vs. coherence flood detection methods—A GIS application,” Int. J. Remote Sens., vol. 21, no. 8, pp. 1619–1631, 2000.
[4] J. Sanyal and X. Lu, “Application of remote sensing in flood management with special reference to monsoon Asia: A review,” Nat. Hazards., vol. 33, no. 2, pp. 283–301, 2004.
[5] D. C. Mason, L. Giustarini, J. Garcia-Pintado, and H. L. Cloke, “Detection of flooded urban areas in high resolution synthetic aperture radar images using double scattering,” Int. J. Appl. Earth. Observ., vol. 28, no. 2, pp. 150–159, 2014.
[6] L. Pulvirenti, M. Chini, N. Pierdicca, L. Guerriero, and P. Ferrazzoli, “Flood monitoring using multi-temporal COSMO-SkyMed data: Image segmentation and signature interpretation,” Remote Sens. Environ., vol. 115, no. 4, pp. 990–1002, 2011.
[7] Y. Yajima, Y. Yamaguchi, R. Sato, H. Yamada, and W.-M. Boerner, “POLSAR image analysis of wetlands using a modified four-component scattering power decomposition,” IEEE Trans. Geosci. Remote Sens., vol. 46, no.6, pp. 1667–1673, 2008.
[8] P. Townsend, “Relationships between forest structure and the detection of flood inundation in forested wetlands using C-band SAR,” Int. J. Remote Sens., vol. 23, no. 3, pp. 443–460, 2002.
[9] D. C. Mason et al., “Flood detection in urban areas using TerraSARX,” IEEE. Trans.Geosci. Remote Sens., vol. 48, no. 2, pp. 882–894, Feb. 2010. [10] S. Martinis, A. Twele, and S. Voigt, “Towards operational near real-time flood detection using a split-based automatic thresholding procedure on high