525 | P a g e
REDUCTION OF FAULT TIME IN SMART GRID
SYSTEM USING FUZZY LOGIC CONTROLLER
Kitty Tripathi
1, Dr. (Mrs.) Lini Mathew
21
Kitty Tripathi, Electrical Engineering Department, Assistant Professor, Sagar Institute of Technology and Management Barabanki, U.P.
2
Dr. (Mrs.) Lini Mathew, Electrical Engineering Department Associate Professor and Head, NITTTR, Chandigarh
ABSTRACT
Smart Energy Delivery System is a new trend in power delivery network system with a two way communication
to improve the reliability and efficiency of the system. This will help in meeting the increase in demand. In this
study, Reduction of Fault Analysis Time in Smart Energy Delivery System Using Fuzzy Logic has been
investigated using a fuzzy logic model .
Keywords: Fuzzy logic controller, fault location, distance location, prioritization
I. INTRODUCTION
The digital revolution of the past few decades has increased the demand for electric power with high reliability
and quality which is delivered. The power transmission system suffer from the fact that intelligence is only
applied locally by protection system and by the central control system which is too slow and protection systems
are limited to protection of specific components only[1].To add intelligence in the system each component
requires individual processor which is robust in nature and communicate as well as cooperate with other
distributed computing platform.
Electric power distribution systems are expected to function at all the time, even under the faulty conditions.
However, when they operate under fault conditions, the system operator receives information which makes it
very difficult to make decision on whether to restore a tripped feeder to normal operation. To cope with this
uncertainty in decision making, a fault diagnostic method based on fuzzy logic is proposed.
In this system a method of fault detection is used in power system for reduction of fault time using fuzzy logic
control. The history associated with fault occurred in power system can be effectively used as a strong database.
The database will act as the trainer to the fuzzy expert system[2],[7].
II. CHARACTERIZATION OF FAULT DETECTION SYSTEM
The development of the diagnostic and fault location technologies are needed for the operation of smart
526 | P a g e
1. The registration and automatic characteristics analysis of fast electromagnetic processes, overvoltage,
overcurrent and non-stationary disturbances.
2. One phase to ground fault detection after the insulation damage in distribution network with an insulated or
compensated neutral.
3. One phase to ground fault spot location according to the initial current transient process in the distribution
network with cable and overhead lines
4. The control of the resource of the equipment insulation.
Traditionally, network providers have relied on a combination of customer calls and alarms from circuit
breakers at the zone substation to detect a fault on the high voltage network; visual inspection and
re-energization of parts of the feeder to locate it; and manual switching by field crews to isolate faulty equipment
and restore power[4] .
Long restoration times negatively affect network reliability, commonly measured in System Average
Interruption Duration Index (SAIDI), System Average Interruption Frequency Index (SAIFI), Momentary
Average Interruption Duration Index (MAIDI) and Momentary Average Interruption Frequency Index (MAIFI).
SAIDI and SAIFI account for faults exceeding one minute, MAIDI and MAIFI for faults of less than one
minute[8].
III. CALCULATION OF FAULT INDEX
The design of three phase transmission line fault detection system consists of three tower system which holds
the three phase transmission wires. This system gets the supply from three different step-down transformers.
Each pole is mounted with three current sensors for each phase which continuously monitors the current in the
three phase transmission line. This sensed value is then sent to the microcontroller which performs the
calculation of fault index at every instant and if this value is greater than the preset values then it sends the
signal to LCD for the displaying of fault index value showing fault condition The microcontroller and LCD unit
receives the input supply from the power supply unit which consist of step down transformer, diode bridge
rectifier, capacitor and voltage regulator to provide 5V supply to the microcontroller
In the model design of obtaining fault current index the value of fault current ratio and fault index as displayed
on the LCD display is as shown in the Table I given below
Table I. Fault Current Ratio and Fault Index for LG Fault
S.NO. S1 =
Ia/Ib
S2 =
Ib/Ic
S3 =
Ic/Ia
FAULT
INDEX
1. 2.472 0.623 0.648 1.247
2. 0.317 0.447 0.705 0.489
3. 2.990 0.370 0.900 1.420
4. 9.960 0.143 0.696 3.599
527 | P a g e
6. 0.175 1.220 4.65 2.017
7. 0.138 1.625 4.450 2.071
8. 1.895 1.123 0.460 1.159
9. 5.610 0.375 0.279 2.175
10. 2.612 0.6758 0.556 3.853
The table I shows the value of fault current ration and hence the fault index when a set of readings were
obtained from the model by arbitrarily creating Line to Ground fault on phase A, Phase B and Phase C
respectively.
The obtained value of fault current ratio and fault index for Line to Line fault as created in the model is shown
in the table II:
Table II. Fault Current Ratio and Fault Index for LL Fault
S.NO. S1 =
Ia/Ib
S2 =
Ib/Ic
S3 =
Ic/Ia
FAULT
INDEX
1. 2.144 0.864 0.539 1.182
2. 2.138 0.854 0.547 1.179
3. 3.330 0.433 0.695 1.489
4. 0.860 0.487 2.370 1.714
5. 3.390 0.409 0.718 1.505
6. 4.910 0.283 0.718 1.970
7. 6.519 0.191 0.801 2.503
8. 7.700 0.276 0.468 2.814
9. 2.340 0.759 0.563 1.220
10. 0.941 0.560 0.124 3.200
The table II shows the value of fault current ration and hence the fault index when a set of readings were
obtained from the model by arbitrarily creating Line to Line fault on phase A-B, Phase B-C and Phase A-C
respectively.
In the model design of obtaining fault current index the value of fault current ratio and fault index as displayed
on the LCD display for LLL Fault is as shown in the Table III:
Table III. Fault Current Ratio and Fault Index for LLL Fault
S.NO. S1 = Ia/Ib S2 = Ib/Ic S3 = Ic/Ia FAULT INDEX
1. 2.244 1.799 1.557 1.500
2. 2.261 1.766 1.577 1.501
528 | P a g e
4. 1.771 2.549 0.221 1.513
5. 3.509 1.394 1.723 2.211
6. 7.709 1.293 1.422 3.476
7. 4.899 1.306 1.666 2.623
8. 2.095 0.559 0.852 1.168
9. 2.248 0.786 0.565 1.190
10. 14.10 0.600 1.121 4.995
IV. DISTANCE LOCATION OF FAULT
The prototype design model of distance location of fault consists of three phase system which has toggle switch
in each line at little distance and is used to arbitrarily create fault in each of the phases. When toggle switch is in
ON position it indicates the faulty condition and send a high bit to the microcontroller. The microcontroller
interprets the location of fault as the four switches are placed in each phase representing the fault at distance of
1Km each. The signal received from the switch will indicate the position of the fault. This calculated value of
the distance of the fault is then displayed at the LCD. This value is also sent serially to Arduino USB-TTL and
sent to Matlab through COMPORT. The value of distance of fault is thus indicated in the Simulink display. This
is further used as an input of fuzzy logic for the prioritization of the fault
The distance of the fault located in three phase system is been calculated by the microcontroller as per the
position of the arbitrary fault creation. This fault is thus displayed on the Simulink for further use as an input to
the fuzzy controller to prioritize the fault. Some of the experimental positions are mentioned as below:
The given Fig.1 shows that the fault is been created in one phase that is it is a single line to ground fault and the
distance as shown on LCD display is shown in Fig1.
Fig.1 Single Line to Ground Fault Displayed on LCD
From the above Fig.1 it is clearly visible that an arbitrary fault is created in R phase by closing the toggle switch
at position 1 indicating 1Km distance fault. So the line to Ground fault in Line R is displayed on LCD. This data
is sent serially to COMPORT by Arduino and then read in Simulation.
529 | P a g e
Fig.2. Single Line to Ground Fault Displayed in MATLAB Environment
The figure 2 displays 31 which is interpreted as third phase 1 Km. IN the coding the Y,B and R phase are
indicated as Phase 1,2 and 3 Respectively and the distances as per the hardware is ranging from 1 to 4. SO the
display 31 indicates that a fault has occurred in phase 3 i.e. in Phase Y and B at 3 Km and at 2Km distance
respectively.
V. FUZZY LOGIC CONTROLLER FOR REDUCTION OF FAULT CLEARANCE TIME
In the proposed Smart Energy Delivery model, the power capacity of source, the price to generate unit power
and distance between the source-sink are considered as inputs for the Fuzzy model. These three
parameters are named as Fault Index, price and distance.The output is fault clerance time After that, the
membership functions are constructed.
The membership function is of trapezoidal or triangular function and the main input parameters are:
i) Fault IndexThe fault current index is the first input parameter. This index of the fault current has been divided
into three categories: Low, Medium and High. The low Fault Index value starts at 0 and goes all the way up to
1.5; beginning at 1.5, it starts to overlap with medium. Similarly, the medium starts at 1.5 and overlaps with
high at 2.5. After 2.5, all the values are considered as high. All the input values of power are fuzzified using the
membership function in the range of 0-5. It is used to maximize the amount of power utilization, so for rule
generation, a higher power will get more priority.
ii) Price: The price of power generation is the second variable and is also divided into three categories: Low,
Medium and High. The low value starts at 0 and goes all the way to 3 units; beginning at 3 units, it starts to
overlap with medium. Similarly, the medium starts at 3 and overlaps with high at 6 units. After 8 units, all
values are considered high. The unit is Rs/day. All the input values of power are fuzzified using this function in
the range of 1-8. We want to give priority to the source which is offering power at a lower price, so a lower
price will get more priority.
iii) Distance: The last Fuzzy variable is the distance between source and sink. It is also divided into three
530 | P a g e
overlap with medium. Similarly, the medium starts at 1 and overlaps with high at 2 units. After 2 units, all the
values are considered high. The unit is miles. All the input values of power are fuzzified using this function in
the range of 0-4
iv) Fault Clearance Time: The output parameter is defined in terms of fault clearance time which is defined as
very small, small, moderate, average, large, and Very Large. The range of the output lies between 1 to 45
seconds. The very small value starts at 0 and goes to 15sec; beginning at 14sec, it starts to overlap with small
and it ranges up to 25sec.From the 24sec it start to overlap with moderate time which ranges from 25sec to
30sec. At the beginning of 28sec it starts to overlap with average time. Similarly, the large time starts at 35sec
and overlaps with Very high at 40sec. After 40sec, all the values are considered very large time
The simulations for the various types of faults were carried performed and the various values for both faulted
and non-faulted current will be recorded. It will be able to detect single line to ground fault, phase to phase fault,
double line to ground fault, and three phase fault.The rule base for fault clearance time is shown in table IV
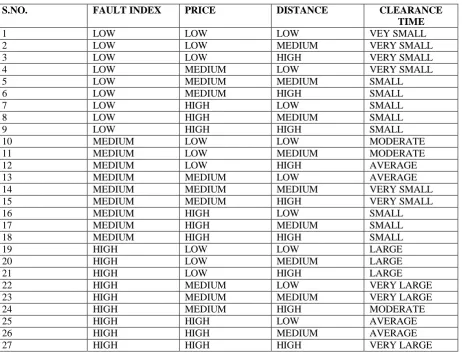
Table 4.2 Fuzzy Logic Rule Base for Clearance time of Fault
S.NO. FAULT INDEX PRICE DISTANCE CLEARANCE
TIME
1 LOW LOW LOW VEY SMALL
2 LOW LOW MEDIUM VERY SMALL
3 LOW LOW HIGH VERY SMALL
4 LOW MEDIUM LOW VERY SMALL
5 LOW MEDIUM MEDIUM SMALL
6 LOW MEDIUM HIGH SMALL
7 LOW HIGH LOW SMALL
8 LOW HIGH MEDIUM SMALL
9 LOW HIGH HIGH SMALL
10 MEDIUM LOW LOW MODERATE
11 MEDIUM LOW MEDIUM MODERATE
12 MEDIUM LOW HIGH AVERAGE
13 MEDIUM MEDIUM LOW AVERAGE
14 MEDIUM MEDIUM MEDIUM VERY SMALL
15 MEDIUM MEDIUM HIGH VERY SMALL
16 MEDIUM HIGH LOW SMALL
17 MEDIUM HIGH MEDIUM SMALL
18 MEDIUM HIGH HIGH SMALL
19 HIGH LOW LOW LARGE
20 HIGH LOW MEDIUM LARGE
21 HIGH LOW HIGH LARGE
22 HIGH MEDIUM LOW VERY LARGE
23 HIGH MEDIUM MEDIUM VERY LARGE
24 HIGH MEDIUM HIGH MODERATE
25 HIGH HIGH LOW AVERAGE
26 HIGH HIGH MEDIUM AVERAGE
27 HIGH HIGH HIGH VERY LARGE
VI. RESULT AND CONCLUSION
The most common problem for the operator sitting in transmission or distribution station is to prioritize the
531 | P a g e
more time for clearance of fault and majority of the times the fault with lower priority is cleared first and with
the higher priority is cleared later. This can be minimized when handled by skillful and expericenced operator
The most common problem for the operator sitting in transmission or distribution station is to prioritize the
clearance of the fault in case of multiple fault occurrences at a time which is quite common. This leads in further
more time for clearance of fault and majority of the times the fault with lower priority is cleared first and with
the higher priority is cleared later. This can be minimized when handled by skillful and experienced operator.
An efficient method to prioritize the fault is by using fuzzy logic controller which on the basis of pre- defined
rule base can prioritize the fault resulting in clearance of fault in minimum time in a smart energy delivery
system
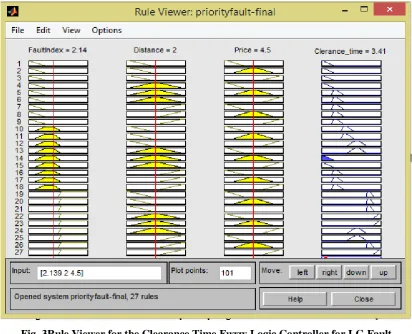
When the case of Line to Ground fault is been considered and the ratio of fault current and fault index obtained
from the Table 5.1 the fault index reads 2.14 and then distance considered for the same fault is 2 km and the
arbitrary price of Rs. 4.5 then according to the membership function designed for the inputs the values are all
medium as and from the rule base design as discussed in table IV the crisp value obtained is moderate clearance
time which is shown in Fig.3
Fig. 3Rule Viewer for the Clearance Time Fuzzy Logic Controller for LG Fault
When a fault occurs, the fault is reported within a period of 5 to 10 minutes. After this the field crew report to
the location of the fault which takes time to travel and the time to investigate by patrolling the line which
utilizes a minimum time of 15 minutes. After this restoration process is done by manual switching which, take a
532 | P a g e
multiple fault occurs at a time within same vicinity of transmission or distribution then the situation becomes
more complex and a lot more time is also wasted in deciding the priority of clearance of the fault which may
often result in wrong decision and the higher priority fault is attended last which is unhealthy and un-economical
for the system
To reduce the complication in the above mentioned scenario the fuzzy logic controller for the prioritization of
fault is been developed. The prototype model not only locates the distance of the occurrence of fault but also
determine the fault Index and priority of clearance of fault is generated using fuzzy logic controller which
defines the order of the clearance of the fault and thus reduces the fault restoration time significantly.
The Reduction of fault analysis time in Smart Energy Delivery System concludes that fuzzy set model can be
applied in decision making of restoration of fault and is comparatively faster in computation. It can be used to
filter out the best combination when a decision is crucial in terms of time.
This model not only limit to transmission system but can be applied in distribution section because the fuzzy set
model are extremely scalable .In this way, it can incorporate self- healing characteristic in the grid function.
REFERENCES
[1] Qiang Suna, Xubo Ge, Lin Liu, Xin Xu, Yibin Zhang, Ruixin Niu, YuanZeng, “Review of Smart Grid Comprehensive Assessment System”, Elsevier, SciVerse ScienceDirect,27-30 September 2011,
China,pp.219-229
[2] Lee-Cheun Hau, Jer-Vui Lee, Yea-Dat Chuah and An-Chow Lai, “Smart Grid-The present and Future of
Smart Physical Protection-A Review”, International Journal of Energy, Information and communications,
Volume 4, Issue 4,August 2013,Malaysia, pp.43-54
[3] Syed Afsar, Govardhan Nadendla, Dr.Rama Sudha, “A Review of Recent Development in Smart Grid systems”, International Journal of Advance Research in Electrical, Electronics and Instrumentation
Engineering, Volume 4, Issue 1,January 2015,India, pp.97-103
[4] Xiang Lu, Wenye Wang, Jianfeng Ma and Limin Sun, “Domino of the Smart Grid : An Empirical Study of Behaviour in Independent Network Architecture”, IEEE SmartGridComm 2013 Symposium - Smart Grid
Standards, Co-simulation, Test-beds, and Field Trials, January 2013,China,pp.612-617
[5] Murtadha N. Albasrawi, Nathan Jarus, Kamlesh A. Joshi, and Sahra Sedigh Sarvestani, “ analysis of Reliability and Resilience for Smart Grid”, Proceedings of IEEE Conference on Smart Grid
Communications ,February 2014, USA, pp.516-521
[6] Saint B, ″ Rural distribution system planning using Smart Grid Technologies, ″IEEE Rural Electric Power
Conference, REPC '2009, April 2009 ,USA, pp. B3-B8.
[7] Pei Zhang, Fangxing Li and Navin Bhatt,“Next Generation Monitoring, Analysis and Control for Smart Grid Control Centre”, IEEE Transaction on Smart Grid, Volume 1, No. 2, September 2010, USA,pp.186-192
[8] Hannu Jaakko Laaksonen,“Protection Principle of Future Micro Grids”, IEEE Transactions on Power
533 | P a g e
[9] Robin Roche, Benjamin Blunier, Abdellatif Miraoui, Vincent Hilaire, Abder Koukam, “Multi Agent System
for Grid Energy Management- A Short Review”, Proceedings of IEEE System and Transport, February
2010, France, pp. 3341-3346
[10]Vito Calderaro, Christoforos N. Hadjicostis, Antonio Piccolo, and Pierluigi Siano, “Failure Identification in Smart Grids Based on Petri Net Modelling”, IEEE transaction on Industrial Electronics, Volume 58, No.10,
October 2011, Italy ,pp. 4613-4624
[11] Mladen Kezunovic, “Smart fault location on smart Grids”, IEEE transaction on Smart Grid Volume 2,
No.1, March 2011, USA, pp. 11-22
[12] Thomas Strasser, Filip Andrén, ohannes Kathan, Carlo Cecati, Concettina Buccella, Pierluigi Siano, Paulo
Leitão, Gulnara Zhabelova, Valeriy Vyatkin, Pavel Vrba and Vladimír Maˇrík, “A Review of Architectures and concepts for Intelligence in Future Electrical Energy System”, IEEE Transaction on Industrial
Electronics Volume 62, No.4, April 2015, Prague,pp.2424-2438
[13] H.-C. Chin, “Fault section diagnosis of power system using fuzzy logic,”IEEE Transaction on Power Syst.,
vol. 18, no. 1, x, Feb. 2003,pp. 245-250.
[14] D. E. Goldberg, Genetic Algorithms in Search, Optimization and MachineLearning. Reading, MA:
Addison-Wesley, 1989.
[15] T. A. Short, D. D. Sabin, and M. F.McGranaghan, “Using PQmonitoring and substation relays for fault
location on distribution Systems,” in Proceedings of IEEE Rural Electric Power Conference, May 6–7,
2007,pp. B3–B3-7
[16] H. Nouri, C. Wang, and T. Davies, “An accurate fault location technique for distribution lines with tapped loads using wavelet transform,” Proceedings of IEEE Power Tech Proc. Porto, Sep. 10–13, 2001, vol. 3,