η
bound state: theory and experiment
HartmutMachner1,
1Fakult¨at f¨ur Physik, Universit¨at Duisburg-Essen, Lotharstr. 1, 47048 Duisburg, Germany
Abstract. The search for a quasi boundηmeson in atomic nuclei is reviewed. This tentative state is studied theoretically as well as experimentally.
1 Introduction
This report is based on a recent review by the author [1]. Other reviews covering the topic in part are in [2] and [3]. Atomic nuclei are built up by nucleons. The quark substructure is not visible. The nucleons are bound together by the strong force. The replacement of nucleons byΛ- orΣ-hyperons was successfully studied, by producing them via recoil-free kinematics, i. e. they are produced at rest. Bound system consisting of an atomic nucleus and another negatively charged particle, where binding appears due to the Coulomb interaction, are atoms. The successful method of producing pionic atoms was again recoil free kinematics. We will come back to this point.
Since theηis electrically neutral, binding can occur only via the strong interaction. The observa-tion of anηbound state would be the first time that a boson is bound in a nucleus. Since a boson is not effected by the Pauli principle, it can be in a state where the nucleon density is maximal. Observation of such a state would allow to study the in medium properties of bound objects. Theηis short lived (τ=5∗10−19s) and therefore secondary beams of them are impossible.
It is well known that the Delta resonanceP33(1232) plays a dominant role in case of pion
produc-tion. It seems that theS11(1535) plays a similar role in case ofηproduction although cross sections
in this case are much smaller.
The scattering lengths of the pion-nucleon interaction is rather small and as a result the strong interaction shift in the 1sstate of pionic atoms is repulsive. Contrary to this, theη-nucleon interaction at small momenta is attractive and rather strong. This was first pointed out by Bhalerao and Liu [4] and later applied by Haider and Liu [5] to predict quasi boundηmesons in atomic nuclei for mass numbersA≥12. In the following text we apply the standard sign convention in meson physics [6] for theswave scattering parameters pcotδ0 =1/a+1/8(r0p2) with ptheηmomentum,δo theswave phase shift,athe scattering length andr0 the effective range. For a real attractive potentialar < 0 means binding. Contrary to theπ−Nsystems where the scattering length is real at very small energies here theηN → πN channel is always open and hence the scattering length is complex. From such large values for the scattering lengtha(ηN), Haider and Liu[5] have shown thatη can be bound in nuclei with A≥12. In the following text we frequently use the term bound state instead of the more strict quasi bound state. This is common in the literature.
2 Theoretical Considerations
A state is called a bound state in the usual sense when the sum of its constituent masses is larger than the mass of the composite. In non-relativistic quantum mechanics binding is represented by an attractive potential and the state is a solution of the radial Klein-Gordon equation. These solutions lie on the imaginary axis in the momentum plane with Im(p) = pi > 0. However, a possibleηbound state is not stable since always the interaction
η+N→π+N (1)
with a nucleonN is possible. If the ηbound state was in a s-state the energy of the final state is mη+mN−Bη=mπ+mN+Tπ+TNwithT the kinetic energies in the final state andBηthe binding energy. Here we have neglected Fermi motion of the nucleon and the recoil of the residual nucleus. Assuming a binding energyBη =10 MeV, this leads toTπ ≈317 MeV andTN ≈47.3 MeV. These energies are clearly too large for the two final state particles to stay in the nucleus. Because of the possible decay of the state it is a quasi bound state and this fact is accounted for by a complex potential. The task is now to produce a complex potential for elastic scatteringηN→ηN, construct from this a complexηA→ηApotential and then search for poles in the upper part of the second quadrant in the complex plane.
Theη-nucleon scattering lengtha(ηN) or more generally the matrixT(ηN→ηN) is quite poorly known. As stated above the lifetime ofη’s is short, soa(ηN) orT(ηN →ηN) has to be extracted in rather indirect ways. The inputs are production cross sections ofπ−p →ηnandγp→ηpreactions. Also decays into the channelsγN, πN,ππN andηN were considered. The major mechanism that generates the imaginary part ofa(ηA) is the reactionηAi → N∗(A−1) → πAf, where N∗ is the nucleon resonanceN∗(1535) with a strong coupling to both theηand the pion [7], [8]. The deduced values for the scattering length range from 0.22+i0.235 fm to 1.14+i0.31 fm.
The standard approach is to construct from theη-nucleon scattering length an optical potential for theη-nucleus interaction withAthe mass number of the nucleus, and then to solve a wave equation with this potential [5], [9], [8], [10]. The complex optical potential is given by
Uopt =V+iW=−
2π
μ T(ηN→ηN)Aρ(r) (2)
withμthe reducedηNmass,T(ηN→ηN) theη-nucleon transition matrix andρthe nuclear density. We will call this relation as theTρapproximation. In the impulse approximation the relation
a(ηN)=T(ηN→ηN,√s0) (3)
with√s0 =mη+mNholds. For a bound state one needs to know theT matrix at
√
s= √s0−Bηi.e.
below threshold.
Different groups employed different wave equations to search for poles. This leads of course to different results. Another source of ambiguities are the differentηnucleon scattering lengths.
Here we study the importance of the input on the final result. We compare the mass dependence of the binding energy and the width for the two extreme values of the scattering length. Such a comparison was made in [9]. The results with the smallest value of the scattering length is from [12] and the largest from [11]. The results are shown in figure 1. The larger real part of the scattering length leads to rather strong binding. However, the imaginary parts although are almost identical lead to strongly different widths. The Green-Wycech results give an almost mass independent width.
A possible way to extract the properties of a bound state is to extract theη nucleus scattering length from the final state interaction [6]. One has to measure an excitation function of a reaction
Z1A
Figure 1.Theoretical calculations of the complex energies forη-bound nuclei in 1sstate(from [9]). The results labeled with GW use the Green-Wycech [11] result of the scattering lengtha(ηN)=0.97+i0.26 fm, while those labeled M1 use the result from Mai et al. [12]a(ηN)=0.22+i0.24 fm. Left frame: the binding energy, right frame the width.
with{Z1A
1+Z2A2}gsthe fused nuclear system in its ground state and theηrelative to that in asstate. One can either measure theηor the fused nuclear system. The measurement of the decay of theηinto photons does not allow the conclusion that the nuclear system is in its ground state due to the limited resolution in the two photon detection. Instead one measures the four-vector of the fused nucleus together with particle identification and reconstructs the properties of theη. This, however, limits the method to light nuclei.
The method is to extract the effective range parameters from the matrix element
|fs|2 = dσs
dΩ pi pf
(5)
withpthe momenta in the incident and final state in the centre-of-mass (cm) system anddσs/dΩthe swave part of the cross section, as it will be discussed in the next section. The scattering lengthaand effective ranger0parameters have to be complex since always the channelη+N → π+Nis open.
Because the square ofais fitted to the data the sign ofarcannot be found from such measurements. The case with more than oneswave will be discussed below.
One can naively assume that the s wave part of the cross section close to threshold is just dσs/dΩ = σtot/4π. However, often other waves than just the swave contribute to the total cross section even close to threshold. In this case the decomposition of the total cross section into partial waves is possible from the knowledge of spin observables in addition to cross sections. In the follow-ing paragraphs we will give some theoretical prerequisites allowfollow-ing to extract theswave contribution from measurements.
3 Experiments
The experimental searches for bound or quasi bound states is not a story of successes. Early ex-periments [13] were later shown not to be quasi free [14] and hence no effect could be seen. Other experiments [15], [16] and [17] were not conclusive. See [1] for a detailed discussion.
A photoproduction experiment was performed at the MAMI accelerator in Mainz making use of the TAPS spectrometer [18]. A tagged photon beam with 800 MeV maximum energy on a3He target was used. The reaction studied was
γ+3He→π0+p+X (6)
as a function ofW, which is the cm energy reduced by the deuteron mass and the3He binding energy.
An enhancement was found in the difference of the spectra of the angular range 180oto 170oand 170oto 150o. The authors [18] claimed to have seen a bound η state which implies that the first occurred stepγ+3He→η⊗3He was followed byη+p→N+∗→π++p.
0 0.2 0.4 0.6 0.8 1
400 600 800 1000
E (MeV)
counts E
6(arb. units)
1100
Figure 2.Excitation functions ofπ0pback-to-back pairs for
different ranges of the opening angleθπ0+θpafter removal of
the overall energy dependence∝E−6
γ . From top to bottom opening angle ranges of: 165o- 180o, 150o- 165o, 140o- 150o,
130o- 140o, and 120o- 130o. The vertical line indicates the
η-production threshold.
Almost the same group repeated the experiment with again the TAPS spectrometer plus the Crystal Ball detector [19]. The experiment benefitted not only from the now almost 4πacceptance but also from much higher statistics. The photon energies ranged from 0.45 GeV to 1.4 GeV. The result of this measurement is shown in figure 2. The strong rise of theπ0pcross section above theη production
threshold is similar to the previous experiment and supports the possibility of a resonance in the threshold region. However, the structures visible at higher energies have not been seen in [18]. They are in the so-called second and third resonance region and their walk with angle is purely kinematical. The WASA collaboration [20] studied the reactiond+d → π−+p+3He. The idea is that an
intermediateη αbound state might exist. The whole reaction chain is then
d+d→η⊗α→N∗(1535)+3He→(π−+p)+3He. (7)
The deuteron beam momentum varied between 2.185 GeV/c and 2.400 GeV/c. No anomaly in the excitation function for beam momenta below and above threshold has been seen.
not carry linear momentum and thus favours the probability that a producedηis bound to the residual nucleus. This method, originally developed in the production of hypernuclei [21], was successfully applied in the study of pionic atoms [22]. In order to transfer the beam momentum almost completely to the emerging particle it has to be emitted in the forward direction close at zero degree. One such experiment [23], [24] employed the GSI fragment separator. The search was done with thed,3he
reaction. The spectrometer is flooded by break up protons having beam velocity and therefore the same magnetic rigidityp/Zas the3He particles of interest and are thus undistinguishable. So far no
final result is published [25].
One nucleon transfer guarantees a rather large cross section. This is not the case for two nucleon transfer reaction A+p → (A−1)η+3He. However, it is just this experiment by the GEM
collaboration [26] which claims to have observed anηmesic bound state with sufficient significance. We will therefore discuss this experiment in more detail. The experiment made use of two signatures simultaneously: transfer reaction with recoil free kinematics and back to back emission of a pion and a nucleon from a possible reaction chainη+N →N∗ →N+πwith theN∗almost at rest. A proton beam from the COSY J¨ulich accelerator with momentum of 1745 MeV/c was used, whereηmesic states with binding energies−30 MeV ≤ Bη ≤ 0 MeV can be produced with a momentum transfer q≤30 MeV/c. The high resolution magnetic spectrograph Big Karl [28] was used to identify3He
Figure 3.The ENSTAR detector [27] surrounding the target. It consists of wedges from scintillating material. Read out is performed by scintillating fibres collecting the light in grooves milled in the wedges and transporting it to photo tubes. One half of this detector is shown. The inner two layers are extruded for clarity.
ions and their momenta. The decay into a proton andπ−with the two final particles emitted almost back to back to each other was measured with a dedicated detector ENSTAR [27]. It surrounds the target and one half of it is shown in figure 3. By construction it is capable of determining azimuth and polar angle.
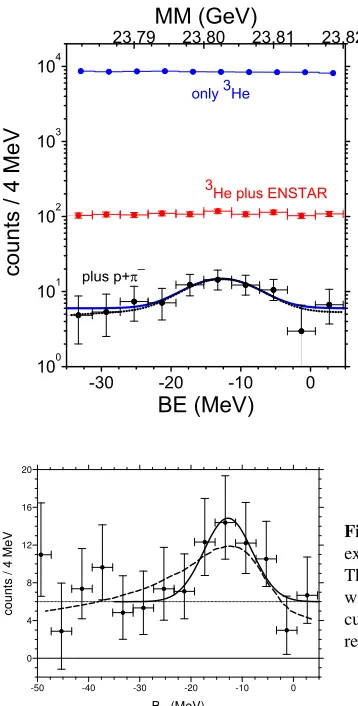
We want now to discuss the effect of the conditions applied to missing mass spectrum or binding energy spectrum. The momenta measured in the FP are shown in figure 4, converted to binding energy. This spectrum shows a peak on a continuum. This continuum was parameterized by a constant as well as polynomials while for the peak a Gaussian was assumed. In addition fits were performed applying Poisson statistics. The significance of the peak is around 5σ[26]. The centroid EB and Gaussian widthσwere found to be -12.0±2.2 MeV and 4.7±1.7 MeV.
100 101 102 103 104
c
o
u
n
ts
/
4
M
e
V
-30 -20 -10 0
BE (MeV)
23.79 23.80 23.81 23.82
MM (GeV)
plus p+π−
3
He plus ENSTAR only 3He
Figure 4.Binding energy spectra. Upper curve: data with the requirement of a3He in the focal plane. Middle curve:
a coincidence between3He and the ENSTAR detector.
Lower curve: coincidence between3He and aπ−and
proton being back to back (bb) emitted recorded in the ENSTAR detector. The solid curve is a fitted Gaussian together with a constant, the dashed curve a gaussian plus a polynomial. 0 4 8 12 16 20 c o u n ts / 4 M e V
-50 -40 -30 -20 -10 0 Bη (MeV)
Figure 5.The final binding energy spectrum. Note the expanded view and the different binning compared to figure 4. The data are shown with Poisson error bars. A fit to the data with a Gaussian and a constant background are shown (solid curve). A fit with a Breit-Wigner form with a coherent non resonant fraction is shown as dashed curve (from [29]).
Another method proposed to search forηbound states is to study the final state interaction (FSI ) between theηmeson and a nucleus.
The most intensively system studied is thed+p →3He+ηreaction. Data are from Refs. [31],
[32], [33], [34], [35], [36], [37]. Those close to threshold are shown in figure 6. In this figure the
0 100 200 300 400 500 600 σ ( n b )
0 2 4 6 8 10 12 14
Q (MeV)
Smyrski
Mayer
Mersmann
dd→ηα (x25)
dp→η3He 2 pole fit
dd→ηα fit
Figure 6.Comparison of the excitation functions for the two reactionsd+p→η+3He andd+d→η+4He. The total cross
sections for the former reaction are from [35] (diamonds), [36](squares), and[37] (dots, five points together). The solid curve is the two pole fit. Data for the latter reaction (triangles up) are from Frascaria et al. [38], Willis et al. [39], Wronska et al. [40], and the GEM collaboration Budzanowski et al. [41] The dotted curve is the scattering length fit to these data.
sets. This leads of course to different results for the final state parameters. COSY 11 [36], quoted also as Smyrski, and ANKE [37], quoted also as Mersmann, were measured at COSY applying the internal deuteron beam. The momentum of the beam increased linearly with time. Data were taken continuously and later put into bins with widthsΔQ. Details of corrections for nonlinearity within bins and correction due to finite beam resolution are given in [36] and [42]. COSY 11 [36] applied (2) to their data and obtained
aη3He=±(2.9±2.7)+i(3.2±1.8) fm. (8)
This corresponds to a possible bound state atBη =−0.2±0.8 MeV. So this result points more to a virtual than to a bound state. The half width isΓ/2 = 1.9±0.4 MeV. However, when we repeated the fit for the data from [36] we found different values and moreover they depend on the fit inter-val. While the value foraiis quite stable,ar varied from 0.0±6000 fm, when the full data set is included in the fit, to 2.1±2.7 fm, when the range is limited to 2.2 MeV. The large error is an in-dication that the option of fitting the full range is useless, because the assumption of pureswave is wrong. The imaginary part is 3.6±1.2 fm. These numbers are in agreement with the published values. This finding is an indication that already for excess energies above 2.2 MeV (2) is no more applicable and the effective range has to be considered in addition to the scattering length as it has been stressed in [43]. On the other hand the ANKE data show after the rapid rise a gentle decrease with increasing energy. Mersmann [42] has performed a corresponding fit to the ANKE data including the smearing as discussed above. This fit yieldedaη3He=[±(0.000±2.416)+i·(6.572±0.501)] fm andr0,η3He=[(0.000±2.416)+i·(1.268±0.212)] fm.The scattering length and the effective range are thus determined by the imaginary parts alone. The fit results don’t fulfill the criterion|ar| >|ai|. The ANKE collaboration [37] applied in addition another fitting form. They assumed a two pole representation of the final state interaction
fs(p)=
fB (1− pp
1)(1− p p2)
(9)
withp1 andp2 two complex pole positions. From the position of the first pole one gets scattering
length and effective range. which areaη3He=
±10.7±0.8+0.1
−0.5
+i·1.5±2.6+1.0
−0.9
fm andr0,η3He =
(1.9±0.1)+i·2.1±0.2+0.2
−0.0
fm. In obtaining these values a smearing of the energy scale due to a finite beam momentum distribution was applied. This results in a pole (if exists) atBη=0.30±0.15± 0.04 MeV andΓη/2=0.21±0.29±0.6 MeV.
Although the FSI parameters differ drastically from those of the fit the two fit curves are practically indistinguishable especially in the strong rising part which is decisive for the scattering length. It is somewhat surprising that two fits with five parameters each and a one to one correspondence give so different results.
Measurements of reactiond+d →η+4He were reported in [38], [39], [40] and more recently in
[41]. The cross section is much smaller than for the previously discussed reactiond+p→η+3He.
In a simultaneous analysis of thed+p→3He+ηreaction and thed+d→4He+ηreaction in terms
The experiment was performed at a deuteron beam momentum of 2385.5 MeV/c corresponding to an excess energy of 16.6 MeV [41]. Recoilingαparticles were identified and their four momentum vector measured with the magnetic spectrograph Big Karl [28]. The experiment made use of polarized as well as unpolarize deuteron beams. The experiment had certain acceptances so that the polarized cross section depends practically only on the analyzing powerAxx. The angular distribution of the
-0.8 -0.4 0.0 0.4 0.8
A x
x
0 1 2 3
d
σ
/d
Ω
(
n
b
/s
r)
0.0 0.1 0.2 0.3 0.4 0.5 0.6 0.7 0.8 0.9 1.0
cos2(θ)
Figure 7.Angular distributions of the unpolarized cross section and the analyzing powerAxx(from [41]). The solid curves
represent a fit with four partial waves, the dotted curves show fits with helicity amplitudes.
tensor analyzing power and of the unpolarized cross section are shown in figure 7. The swave amplitudefscan now be extracted. We find that|fs|2=4.4±1.1 nb/sr.
For the two highest energy measurements from [39]dwave contributions have to be considered. With the present result previous analysis could be corrected lading It is a good approximation to assume thed wave amplitudesA2andBto depend on theηmomentum as p2ηand apply the results discussed here. This yields|fs|2 =13.8±1.2 nb/sr and|fs|2 =10.6±1.3 nb/sr for the momenta at 73 MeV/c and 91 MeV/c, respectively. For the Wronska result we find|fs|2 =14.3±2.4 nb/sr at 86 MeV/c. We are now in a position to make a comparison of the world data for the swave amplitude. This is done in figure 6. In a fit the production amplitude and the scattering length were fitted to the data yieldingaηα =[±(3.1±0.5)+i(0.0±0.5)] fm. This result corresponds to a bound state - if it exists - ofBη =3.71±0.09 MeV andΓ/2 =0.0±0.2 MeV. In this figure we compare the excitation functions for the present reaction with the one ford+p→η+3He. The latter reaction shows a much
more rapid rise than the former. This is an indication of the larger scattering length in case of the lighter system.
Two experiments have been reported leading to the mirror nucleus7Be. The experiments were performed at SATURNE Saclay [44] and COSY J¨ulich [45]. Both studies employed the reaction
p+6Li→η+7Be. (10)
At Saclay theηwas measured through its twoγdecay at a beam energy of 683 MeV corresponding to a beam momentum of 1322 MeV/c or to an excess energy ofQ=19.13 MeV. In total eight events were observed. Four excited states withL = 1 and L = 3 can contribute. The other experiment [45] was performed at a beam energy of 673.1 MeV, corresponding to 1310 MeV/c momentum or an excess energy ofQ = 11.28 MeV. The recoiling7Be nuclei were detected in the spectrograph Big
to measure the track, followed by two layers of scintillation detectors one meter apart. They allow particle identification via TOF measurement. All these devices were housed in a large vacuum box made of stainless steel.
0 4 8 12 16 20 24
σ
(g
s)
(n
b
)
0 10 20
Q (MeV) Al-Khalili et al.
Upadhyay et al. (no fsi)
Scomparin
GEM phase space
Upadhyay et al. (with fsi)
Figure 8.Excitation function for thep+6Li→η+7Be(g.s.)
reaction. The two data points are from Refs. [44] and [45]. The dashed curve is the Al-Khalili model [46] and the dashed-dotted is the phase space behaviour, both normalized to the GEM data point. The solid and the dotted curves are calculations [47] with and without final state interactions. The arrow indicates the region where only the ground state is involved in the reaction.
The η meson events were identified via the missing mass technique. Finally the counts were converted to a cross section. Assuming isotropic emission one gets the total cross section shown in figure 8. Together with the form factors from [46] and the amplitude f(pd →η3He) extracted from
the two data sets discussed above, the cross section for the reaction leading to the7Be ground state
could be extracted. The two data are shown in figure 8. Also shown is the energy dependence of the Al-Khalili model [46] normalized to the cross section of the GEM collaboration [45]. Also the normalized phase space dependence is shown. In addition model predictions [47] with and without FSI are shown. A measurement even closer to threshold preferably below the first excited state could distinguish between the different models and could answer whether strong FSI exists in this final channel. Upadhyay et al. [47] got fromaηN =(0.88+i0.41) fm a valueaη7Be=(−9.18+i8.53) fm.
References
[1] H. Machner, J. Phys. G42(4), 043001 (2015)
[2] N. G. Kelkar, K. P. Kemchandani, N. J. Upadhyay, and B. K. Jain, Rep. Progr. Phys.76, 066301 (2013)
[3] B. Krusche and C. Wilkin, Prog. Part. Nucl. Phys.80, 43–95 (2014) [4] R. S. Bhalerao and L. C. Liu, Phys. Rev. Lett.54, 865 (1985) [5] Q. Haider and L. C. Liu, Phys. Lett. B172, 257 (1986)
[6] M. K. Goldberger and K. M. Watson,Collision Theory(John Wiley and Sons, New York, Lon-don, Sidney, 1964)
[7] J. Behringer et al. (Particle Data Group), Phys. Rev. D86, 010001 (2012) [8] S. Wycech, A. M. Green, and J. A. Niskanen, Phys. Rev. C52, 544 (1995) [9] E. Friedman, A. Gal, and J. Mares, Phys. Lett. B725, 334 (2013)
[10] C. Wilkin, Phys. Rev. C47, R938 (1993)
[11] A. M. Green and S. Wycech, Phys. Rev. C71, 014001 (2005)
[12] M. Mai, P. C. Bruns, and U.-G. Meißner, Phys. Rev. D86, 094033 (2012) [13] R. E. Chrien et al., Phys. Rev. Lett.60, 2595 (1988)
[14] H. Nagahiro, D. Jido, and S. Hirenzaki, Phys. Rev. C80, 025205 (2009)
[16] G. A. Sokol et al., Fizika B8, 85 (1999)
[17] V. A. Baskov et al., arXive nucl-ex:1212.6313 (2012) [18] M. Pfeiffer et al., Phys. Rev. Lett.92, 252001 (2004) [19] F. Pheron et al., Phys. Lett. B709, 21 (2012)
[20] P. Adlarson et al. (WASA collaboration), Phys. Rev. C87, 035204 (2013) [21] W. Br¨uckner et al., Phys. Lett. B62, 481 (1976)
[22] T. Yamazaki et al., Z. Physik A355, 219 (1996)
[23] R. S. Hayano and A. Gillitzer et al., GSI proposal S214 (1997) [24] A. Gillitzer, Acta Physica Slovaka56, 269 (2006)
[25] A. Gillitzer, priv. communication (2014)
[26] A. Budzanowski et al. (COSY-GEM Collaboration), Phys. Rev. C79, 061001(R) (2009) [27] M. Betigeri et al., Nucl. Instruments and Meth. in Phys. Res. A578, 198 (2007)
[28] M. Drochner et al., Nucl. Phys. A643, 55 (1998) [29] Q. Haider and L. C. Liu, J. Phys. G37, 125104 (2010)
[30] Lon-Chang Liu and Q. Haider, Acta Physica Polonica45, 837 (2014) [31] J. Berger et al., Phys. Rev. Lett.61, 919 (1988)
[32] M. Betigeri et al., Phys. Lett. B472, 267 (2000) [33] H. H. Adam et al., Phys. Rev. C75, 014004 (2007) [34] T. Rausmann et al., Phys. Rev.80, 017001 (2009) [35] B. Mayer et al., Phys. Rev. C53, 2068 (1996) [36] J. Smyrski et al., Phys. Lett. B649, 258 (2007) [37] T. Mersmann et al., Phys. Rev. Lett.98, 242301 (2007) [38] R. Frascaria et al., Phys. Rev. C50, R537 (1994) [39] N. Willis et al., Phys. Lett. B406, 14 (1997) [40] A. Wro´nska et al., Eur. Phys. J. A26, 421 (2005)
[41] A. Budzanowski et al. (The GEM Collaboration), Nucl. Phys. A821, 193 (2009) [42] T. Mersmann, PhD thesis, University M¨unster (2007)
[43] J. A. Niskanen and H. Machner, Nucl. Phys. A902, 40 (2013) [44] E. Scomparin et al., J. Phys. G19, L51 (1993)
[45] A. Budzanowski et al., Phys. Rev. C82, 041001(R) (2010)
![Figure 1. Theoretical calculations of the complex energies for η-bound nuclei in 1s state(from [9])](https://thumb-us.123doks.com/thumbv2/123dok_us/8147585.1358478/3.482.50.400.81.236/figure-theoretical-calculations-complex-energies-bound-nuclei-state.webp)

![Figure 3. The ENSTAR detector [27] surrounding the target. It consists ofwedges from scintillating material](https://thumb-us.123doks.com/thumbv2/123dok_us/8147585.1358478/5.482.39.161.301.416/figure-enstar-detector-surrounding-consists-ofwedges-scintillating-material.webp)
![Figure 7. Angular distributions of the unpolarized cross sectionand the analyzing power Axx (from [41])](https://thumb-us.123doks.com/thumbv2/123dok_us/8147585.1358478/8.482.41.199.150.315/figure-angular-distributions-unpolarized-cross-sectionand-analyzing-power.webp)
![Figure 8. Excitation function for thereaction. The two data points are from Refs. [44] and [45]](https://thumb-us.123doks.com/thumbv2/123dok_us/8147585.1358478/9.482.40.201.123.246/figure-excitation-function-thereaction-data-points-refs.webp)
