Scholarship@Western
Scholarship@Western
Electronic Thesis and Dissertation Repository
10-20-2015 12:00 AM
Lead Hip Kinematics and Weight Bearing Patterns of Amateur
Lead Hip Kinematics and Weight Bearing Patterns of Amateur
Golfers With and Without Low Back Pain
Golfers With and Without Low Back Pain
Steven K. McRae
The University of Western Ontario
Supervisor Dr. Jim Dickey
The University of Western Ontario Graduate Program in Kinesiology
A thesis submitted in partial fulfillment of the requirements for the degree in Master of Science © Steven K. McRae 2015
Follow this and additional works at: https://ir.lib.uwo.ca/etd Recommended Citation
Recommended Citation
McRae, Steven K., "Lead Hip Kinematics and Weight Bearing Patterns of Amateur Golfers With and Without Low Back Pain" (2015). Electronic Thesis and Dissertation Repository. 3387.
https://ir.lib.uwo.ca/etd/3387
This Dissertation/Thesis is brought to you for free and open access by Scholarship@Western. It has been accepted for inclusion in Electronic Thesis and Dissertation Repository by an authorized administrator of
by
Steven McRae
Graduate Program in Kinesiology
A thesis submitted in partial fulfillment of the requirements for the degree of
Masters of Biomechanics Degree
The School of Graduate and Postdoctoral Studies The University of Western Ontario
London, Ontario, Canada
ii
Abstract
Purpose: The purpose of this study was to investigate the relationship between lead hip
kinematics, weight bearing patterns and lumbar kinematic differences between golfers who
experience golf related low back pain and golfers who do not. Methods: A total of 12
amateur male golfers were recruited, 7 without low back pain and 5 with low back pain.
IRED motion capture was used to determine kinematics and two force plates were used to
collect kinetic data. Results: Low back pain golfers externally rotated their lead hip
significantly less during address (p= 0.048), and internally rotated their lead hip significantly
more at peak follow through (p=0.030) than golfers without low back pain. Golfers with low
back pain bore significantly more body weight on their rear leg (p=0.030) at peak follow
through then golfers without low back pain. No statistically significant difference was found
between groups for lumbar spine kinematics at any phases of the swing. Conclusion: This
study identified a significant relationship between the orientation of the lead leg segment
during the address position and at peak follow through with respect to golf related low back
pain. These findings may be an important teaching tool for reducing the risk of golf related
low back pain.
Keywords
iii
Acknowledgments
Firstly I would like to thank my lab mates, for the many hours of trail by fire with the
Optotrak system, extra hands during data collection and general answering of the many
questions I have had over the past two years.
I would like to thank my mom, dad and siblings for the constant encouragement and
support. I could always count on you to listen and reassure me when I needed it most. I
would also like to thank my girlfriend, for always pushing me to keep working, even when it
meant cutting into spending time with you.
Finally I would like to thank Jim, for your tireless commitment to your students, your
iv
Table of Contents
Abstract ... ii
Acknowledgments... iii
Table of Contents ... iv
List of Figures and Tables... vii
Chapter 1 ... 1
1 Literature Review ... 1
1.1 Injury incidence and occurrence ... 1
1.2 Physical Traits of golfers with low back pain ... 2
1.3 Golf swing kinematics ... 3
1.4 Golf swing Kinetics ... 5
2 Introduction ... 6
2.1 Kinematics ... 7
2.2 Kinetic Measures ... 10
2.3 Purposes ... 12
2.4 Hypotheses ... 12
Chapter 2 ... 13
3 Methodology ... 13
3.1 Participants ... 13
3.2 Instrumentation ... 14
3.2.1 Kinematic Equipment ... 14
3.2.2 Kinetic Equipment ... 17
3.2.3 Microphone ... 18
3.3 Golf Equipment ... 18
v
3.5.1 Lead hip internal range of motion test ... 21
3.5.2 Warm up... 22
3.5.3 Golf Swing Testing ... 22
3.6 Post Processing ... 23
3.7 Data Reduction... 24
3.8 Statistical analysis ... 25
Chapter 3 ... 25
4 Results ... 26
Chapter 4 ... 37
5 Discussion ... 37
5.1 Kinematic Measures... 37
5.1.1 Lead Hip Orientation ... 37
5.1.2 Lead foot Orientation ... 41
5.1.3 Range of motion test ... 43
5.1.4 Lead hip range of motion test vs peak follow through lead hip internal rotation ... 45
5.1.5 Pelvic orientation ... 47
5.1.6 Lumbar axial rotation ... 47
5.1.7 Lumbar lateral bend ... 49
5.1.8 Lumbar flexion/extension ... 50
5.2 Kinetic Measures ... 51
5.3 Limitations ... 53
Chapter 5 ... 55
6 Conclusion ... 55
vii
List of Figures
Figure 1: Ben Hogan’s suggestions for positioning of the feet for different clubs... 8
Figure 2: Components of the experiment set up.. ... 16
Figure 3: Thoracic Rigid body assembly (above) sacrum rigid body assembly (below). ... 17
Figure 4: Location of calibration markers ... 19
Figure 5: Rotating platform used for lead hip internal range of motion test ... 22
Figure 6: Lead foot orientation for both golfers with and without low back pain during address, at ball contact and peak follow through. ... 26
Figure 7: Lead hip internal/external rotation for golfers with and without low back pain during address, at ball contact and peak follow through. ... 27
Figure 8: Pelvic orientations in the transverse plane for golfers with low back pain and golfers without low back pain during address, at ball contact and peak follow through. ... 28
Figure 9: Lumbar axial rotation for golfers with and without low back pain during address, at ball contact and peak follow through. ... 29
Figure 10: Lumbar lateral bend for golfers with and without pain during address, ball contact and peak follow through.. ... 30
Figure 11: Lumbar flexion/extension angle for golfers with and without low back pain at address, ball contact and peak follow through. ... 31
Figure 12: Percentage of bodyweight on the rear foot for golfers with and without low back pain during address, at ball contact and peak follow though. ... 32
Figure 13: Percentage of bodyweight borne on the front foot for golfers with low back pain and golfers without low back pain during address, ball contact and peak follow though. ... 34
viii
lead hip internal rotation at peak follow through.. ... 36
Table 1: Participant Information ……….13
Chapter 1
1
Literature Review
1.1
Injury incidence and occurrence
Golf related lower back injuries can be divided into two types: chronic and acute injuries
(Cabri et al., 2009). Chronic injuries, despite the cause, develop over time. In contrast,
acute injuries are unforeseen events, such as a golfer hitting a root or rock during their
golf swing. This literature review will focus on the more common, chronic lower back
injuries (Finn, 2013).In a year-long retrospective mail survey of 1021 Australian amateur
golfers, 93 injuries were observed in 78 golfers (McHardy et al., 2007a). This is
equivalent to 15.8 injuries per 100 golfers per year. Lower back injuries were identified
as the most common injury site (18.3%), followed by elbow and forearm (17.2%) then
shoulder (11.8%). Injury mechanism was also reported; 46.2% of the injuries were
attributed to the golf swing itself, and 23.7% were attributed to overuse. Participants
attributed ball contact in which 23.7% of injuries occurred, the majority of which were
wrist and elbow injuries. Follow through was attributed for 21.5% of total injuries.
However, low back injuries were spread evenly across all components of the swing.
McHardy et al. (2007a) also reported that 61.3% of injured golfers sought medical
attention, 47.4% of which consulted a medical practitioner such as chiropractor or
physiotherapist.
In a similar retrospective cohort study, the injury data of 703 golfers (643
amateur, 60 professional) was analyzed using a 6 page injury questionnaire (Gosheger et
rate was higher in professionals (3.06 per golfer) than amateurs (2.07 per golfer). The
most commonly reported professional injury site was the spine (34.5%). Amateurs
reported elbow (24.9%) as the most common injury site, followed closely by the spine
(24.7%). Severity of reported injuries was minor (51.5%), moderate (26.8%), and major
(21.7%).
A similar study by (Fradkin et al., 2007) analyzed the injury data of 304 golfers
using a questionnaire that covered demographics, golf and warm up history over a 12
month history. 36.5% of golfers reported injuries in the 12 month period (111 injuries).
Of these injuries, 37.8% were strains. The most commonly reported mechanism of injury
was overuse (29.7%). The most common anatomical location was the back (40 of the 111
injuries). Similar to previously reported data, 64% of golfers missed participation due to
injury, and 51.3% reported that their injury had an impact on their daily lives.
The previously mentioned studies do not identify specific structures injured, only
the anatomical area. Golf related low back pain can present itself in several ways such as
disc herniation, spondylosis, facet pain as well as muscle strain or spasm (Reed and
Wadsworth, 2010). Considering that overuse is the major cause of injury in golfers, and
the majority of injuries involve the lower back region, it is not surprising that some
studies report muscle strains as the most common form of low back injury in golfers
(Fradkin et al., 2007).
1.2
Physical Traits of golfers with low back pain
The lower back plays a prominent role in the golf swing. In kinematic terms, a
well as left and right bending (Zheng et al., 2008). A comparative study looked at
physical characteristics of golfers with and without low back pain and reported that
golfers with low back pain presented significantly less lumbar extension flexibility, as
well as reduced left hip adduction strength (Tsai et al., 2010). An earlier study by the
same authors reported that golfers with low back pain demonstrated reduced hamstring
flexibility as well (Tsai, 2005).
The hip joint has also been implicated in golfers with low back pain. The hip joint
is the articulation between the proximal femur and the acetabulum. The primary hip
motions are flexion/extension, ab/adduction and internal/external rotation, and
circumduction. Specific muscles act to produce moments in each of these directions. For
example, the gluteus medius muscle is one of the muscles which produces external
rotation moments (Prins and Van Der Wurff, 2009). Significant limitations in lead hip
passive internal rotation has been reported in golfers with low back pain (Kim et al.,
2015; Gulgin, 2005; Vad et al., 2004; Murray et al., 2009) compared to golfers without
low back pain. Golfers with a known limited lead hip internal rotation range of motion
(<20 degrees) also demonstrated a reduction in lead hip range of motion during a golf
swing compared to matched control golfers with a normal lead hip range of motion (>20
degrees) (Kim et al., 2015). Unfortunately no information on low back pain prevalence
in these golfers was presented in this study.
1.3
Golf swing kinematics
Golf, like many sports, has gone through an evolution in recent decades in regards
to equipment as well as technique. One documented technique change in professional
2004). The kinematic and kinetic differences between the modern and classic swing are
suggested as a potential cause of low back pain in golfers. The modern golf swing
emphasizes an increase in shoulder rotation along with limited hip rotation during the
backswing (Gluck et al., 2008). This restricted hip rotation is accomplished by keeping
the lead foot firmly planted on the ground during the backswing rather than by lifting the
heel. By restricting the hip rotation a separation is created between the transverse axis of
the hip segment and shoulder segment, which has been termed the “factor”. The
X-factor created during the modern swing has itself been suggested as a cause of low back
pain in golfers (Vad et al., 2004). Cole and Grimshaw (2009) identified that low
handicap golfers demonstrated reduced hip rotation during the back swing, paired with
increased shoulder rotation, compared to high handicapped golfers. There may be a
relationship between X-factor and performance, however, the X-factor as a risk factor for
low back pain has only been suggested, not been proven (Vad et al., 2004) . Grimshaw
and Burden (2000) investigated this notion in a case study where swing mechanics were
altered in an attempt to reduce low back pain. The participant shortened their back swing,
reducing the separation between the hips and shoulders, lowering their X- factor. The
participant’s low back pain was alleviated within a three month period. The authors did
not report any kinematic data on the follow through phase and it would have been
interesting to see if there was any changes in the hip and shoulder ranges of motion in the
follow through associated with the swing alterations. Lindsay and Horton (2002a)
investigated spinal motions of golfers with and without low back pain, but did not
Lumbar lateral bending has also been indicated as a kinematic difference between
the modern and classic swing. Lateral bending refers to the position of the thoracic spine
relative to the pelvis and lumbar spine. In the modern swing, golfers laterally bend their
torso toward target, while rotating axially away from target, as they perform their back
swing. The lateral bending is thought to increase the amount of shoulder rotation, which
would lead to an increased X factor (Grimshaw and Burden, 2000).
Only one study reported lead foot orientations during the golf swing. Lynn and
Noffal (2010) reported that increased rotation of the lead foot toward the desired target
decreased knee moments in the frontal plane. We are not aware of any studies that have
evaluated the relationship between lead foot orientation and golfer’s low back pain.
1.4
Golf swing Kinetics
Several studies have investigated the ground reaction forces of skilled compared
to unskilled golfers, establishing clear differences in weight transfer patterns between the
two groups (Okuda et al., 2010; Queen et al., 2013; Keogh and Reid, 2005). However
little literature exists comparing the ground reaction forces of golfers with and without
low back pain. A 2005 paper collected ground reaction forces from golfers; it reported
that there was no significant difference between spinal loads of golfers with and without
low back pain while swinging a driver (Tsai, 2005). Unfortunately weight bearing
patterns were not reported in this study. Accordingly, given the significant differences in
weight bearing patterns within golfers of high and low skill level, this is a fruitful avenue
2
Introduction
Approximately 27.1 million individuals participated in amateur golf in North America in
2010 and that number is expected to increase to nearly 30 million by the year 2020
(Beditz and Kass, 2010). Older golfers (over 50 years old) have been reported to make
up 25% of the golfer population, however this older population is responsible for nearly
half of the rounds played in a season (Beditz and Kass, 2010). With the increasing age of
the general population, an increase in the percentage of golfers that are 50 years or older
is also expected. The layperson’s perception of golf is a leisurely game that is acceptable
for the elderly, as it is thought to have a low risk of injury and to not be very physically
demanding (Vandervoort et al., 2012). However, when examined biomechanically, a full
golf swing includes extreme ranges of motion (Sinclair et al., 2014) as well as large joint
moments and compressive forces at several joints including the knees, hips and spine
(Ferdinands et al., 2014). These stressors compound with reduced flexibility and muscle
tone in aging individuals and may result in injury (Versteegh et al., 2008).
Between 15.8 and 36.5% of amateur golfers experience an injury in a season
(McHardy et al., 2007a; Fradkin et al., 2007; McHardy et al., 2007b). Of these injuries,
82.6% have been identified as chronic injuries that developed over time. Interestingly, the
low back region has been reported as the most common injury site in amateur players and
the second most common professionals (Sutcliffe et al., 2008; McHardy et al., 2007a;
Fradkin et al., 2007). Of the chronic injuries reported, overuse was the self-reported cause
of injury in several anatomical regions, including the elbow, knee and the low back (24%
pain was attributed to poor swing technique, and the golfers identified that 41.6 % of low
back pain occurred during the follow through (McHardy et al., 2007b). These factors may
compound such that overuse and poor swing technique could be comorbid causes of low
back pain. While player skill and golf exposure do not seem to differentiate whether
individuals experience low back pain while golfing, it appears that there may be
differences in swing technique between players who experience pain, and those that do
not.
2.1
Kinematics
The first potential difference between golfers with and without low back pain may be
related to how the individuals orientate their lead foot in relation to their desired target.
This aspect of the golf setup has been overlooked in the scientific literature. Especially
regarding any considerations for a causal relationship between lead foot orientation and
low back pain. For optimal golf performance, Ben Hogan, one of the game’s greatest
champions, listed proper lead foot orientation during the address position as part of lesion
#2 in his classic book entitled Five Lessons of Golf (Hogan, 1985). He stated that the foot
of the lead leg (the leg closest to target) should be rotated towards the target “a quarter
This rotation of the lead foot will cause an associated external rotation of the lead hip in
the address position prior to the initiation of the back swing. The relationship between the
orientation of the lead foot, knee moments and lead knee injuries has been investigated in
golfers (Lynn and Noffal, 2010). However, the effect of the lead foot orientation on lead
hip kinematics in golfers who experience low back pain has not been investigated. It is
not known if the lead foot orientations are different between golfers with and without low
back pain.
The orientation of a golfer’s lead foot at address will carry over and affect the
kinematics of the lead hip during a golf swing; these lead foot orientation differences
would contribute to the magnitude of internal and external rotation in the lead hip
Figure 1: Ben Hogan’s suggestions for positioning the feet for
different clubs. The left Foot is lead foot, and he suggests that it
should be externally rotated toward the target. Adapted from
throughout a golf swing. A golfer’s lead hip passive internal and external range of motion
is one physical factor that may influence lead foot orientation and therefore lead hip
kinematics during the swing. Significant differences in lead hip passive internal rotation
ranges of motion have been identified in golfers with and without low back pain. For
example, Murray et al 2009 reported that golfers with low back pain, in a prone position
with a flexed knee, presented 10° less lead hip internal rotation than golfers without pain.
Similarly (Vad et al., 2004) reported that golfers with low back pain had significantly
lower FABRES scores (measure of hip rotation) as well as significantly lower lead hip
internal ranges of motion. There have also been several case studies which have
identified limited internal rotation of the lead hip as a potential risk factor for low back
pain in golfers. In these case studies, specific treatment and exercises have been
administered for improving lead hip range of motion, resulting in a reduction of low back
pain symptoms (Reinhardt, 2013; Lejkowski and Poulsen, 2013). Although informative,
these interventions focused on increasing passive hip range of motion outside of the
dynamic golfing context and did not include swing or foot orientation modifications. Kim
et al (2015) is the first research study to report significant lead hip kinematic differences
in golfers with measured deficits in internal hip range of motion when compared to
non-limited internal hip range of motion controls. They studied the kinematic differences
between thirty professional male golfers with either limited hip internal rotation (range of
motion <20o) or the normal hip internal rotation (range of motion ≥30o). Golfers with
limited lead hip internal rotation presented greater lumbar flexion, right and left lumbar
spine axial rotation and right side bending than golfers with normal hip internal rotation.
pain. Bilateral hip range of motion differences have also been identified in female golfers
when compared to non-golfing control groups in passive internal rotation rests, however
no regard to low back pain was given (Gulgin, 2005; Vad et al., 2004). Differences in
pelvic and hip kinematics during sport participation have also been reported in athletes
with and without low back pain who participate in other rotational sports, such as judo
and baseball (Almeida et al., 2012; Van Dillen et al., 2008). At the current time, the
literature has shown that low back pain golfers have limited passive internal range of
motion in their lead hip, and golfers with limited passive internal range of motion in their
lead hip have been shown to have altered swing kinematics. The goal of this study is too
go one step further by investigating the relationship between lead limb hip internal
rotation and joint kinematics in both golfers that experience low back pain associated
with golfing and those that do not.
2.2
Kinetic Measures
Along with kinematic differences, there are also kinetic differences between golfers.
Significant differences have been identified in the weight transfer patterns of skilled
versus unskilled golfers during the backswing, downswing and the peak maximum
vertical ground reaction force of the lead leg (Okuda et al., 2010). In contrast, some
studies have not identified differences between skilled and unskilled golfers. For
example, Richards et al., (1985) identified similar medial-lateral weight transfer patterns
between golfers with a low handicap (<10) compared to those with a high handicap
(>20). However, the author did identify differences between the anterior/posterior weight
transfer between groups. Nevertheless, little research has evaluated differences in
ground reaction forces between golfers with and without low back pain (Tsai et al.,
2010). Although they did not report the weight distribution data, they did use the raw
ground reaction force data to compare spinal joint moments between groups. They did
not find statistically significant differences between groups (Tsai et al., 2010).
Two distinct swing styles regarding weight transfer have been identified: the
front foot style and the reverse style (Ball and Best, 2007). Weight transfer is similar at
address and back swing between the two styles; the differences are during the
downswing. During the front foot style the center of pressure moves to the front foot
earlier in the downswing and during ball contact, whereas during the reverse style the
center of pressure moves to the back foot during ball contact and follow-through (Ball
and Best, 2007). They did not investigate the relationship between level of handicap and
swing style. No kinematic research specifically focusing on these two swing styles has
been reported, nor has the relationship between these kinetic swing styles and low back
pain been investigated. A potential reason for the center of pressure moving to the rear
foot in the reverse style would be an increased lateral trunk lean away from target. This
movement pattern has been labelled as the reverse C position (Finn, 2013), which is a
component of what some authors call the modern golf swing. The reverse C position has
been reported as an excessive lateral lean and spinal extension from ball contact to follow
through (Finn, 2013). The kinematics inherent in the reverse C are consistent with the
kinetic reverse style as described by Ball and Best (2007). This thesis will investigate the
relationship between the presentation of low back pain in golfers and weight transfer
2.3
Purposes
The primary purpose of this thesis was to investigate the relationship between lead hip
kinematics of golfers who experience low back pain in relation to golfers without pain.
This purpose also encompasses evaluation of the lead foot orientation given its influence
on the lead hip internal rotation. The secondary purpose was to investigate the
relationship between weight bearing patterns of golfers who experience low back pain
and golfers without low back pain. The final purpose was to investigate the relationship
between lumbar spinal kinematics between groups.
2.4
Hypotheses
It was hypothesized:
- that golfers with low back pain will have reduced internal rotation of the lead hip when
compared to the golfers without low back pain at peak follow through
- Golfers with low back pain will have an increased percentage of body weight on the trail
leg during address, ball contact and follow through in relation to golfers without pain
- Golfers with low back pain will have increased axial separation between the thorax
3
Methodology
3.1
Participants
Twelve male recreational golfers between the ages 52-63 (mean = 57) were recruited
through a poster campaign at local golf facilities in the area. Each participant completed a
low back pain questionnaire (APPENDIX) and based on their answers they were pain.
Inclusion criteria were as follows. Golfers without low back pain: must play a minimum
of 18 holes of golf per week, 30-65 years of age and no history of golf related low back
pain within the last year of play, no other lower body injuries (within 6 months). Golfers
with low back pain: must play a minimum of 18 holes of golf per week, 30-65 years of
age and they have experienced at least one episode of golf related low back pain within
the last year of play. This was defined as pain in the low back musculature during or
following a round of golf. The participants believed that their low back pain was directly
related to golf, however it did not restrict or stop them from playing or practicing.
Individuals were not eligible to participate in the study if they reported any diagnosed
low back disorder (such as herniated discs or previous spine surgery) or lower body
injury (such as knee or hip replacements) which would potentially alter their normal golf
swing. Five of the twelve participants were classified as golfers with low back pain and
seven were classified as golfers without low back pain. Their basic demographics are
Table 1: Participant information, including their swing direction, amount of golf
played per week, handicap, the location and type of their low back pain.
Group Swing Rounds/wk Handicap Pain Location(side) Type Age
No Pain Right 3 16 -- -- 63
No Pain Right 5 7.6 -- -- 56
No Pain Right 3 15 -- -- 54
No Pain Right 3 8 -- -- 52
No Pain Right 3 9 -- -- 55
No Pain Right 2 9 -- -- 52
No Pain Right 1 18 -- -- 54
PAIN Left 4 10 BOTH STRAIN 57 PAIN Right 1 24 BOTH STRAIN 56 PAIN Right 1 18 BOTH STRAIN 60 PAIN Right 2 22 LEAD STRAIN 65 PAIN Right 1 24 LEAD STRAIN 59
All but one participant swung right handed, as in the path of their club went from right to
left. All kinematics and kinetic data were harmonized as if they were right handed, and
accordingly this thesis will refer to the left limb as the lead limb and the right limb as the
trail limb. The participants had unofficial handicaps ranging from 8-24. The study was
approved by Western’s Health Sciences Research Ethics Board, and written informed
consent was obtained from all participants.
3.2
Instrumentation
3.2.1
Kinematic Equipment
All kinematic data was collected using a system of three Optotrak 3020 camera banks
connected to an Optotrak System Control Unit (Northern Digital Inc., Waterloo, Canada).
First Principles software (Version 1.2.4, Northern Digital Inc.) was used for data
collection and post processing. Three rigid bodies were constructed: shank, sacrum and
Diodes (IREDs) securely attached that served as markers. The shank rigid body had four
IREDs, the sacrum and thoracic rigid bodies both consisted of eight markers. Two
Optotrak cameras were vertically mounted 6.7 m apart on the left and right posterior wall
at a 45 degree angle to the participants hips (Figure 1). The third camera bank was
horizontally mounted on a 0.3 m tall platform which was located 3.9 m in front of the
golfer. All kinematic data was recorded in 100 Hz. All participants wore a cotton t-shirt
with the back removed in order that the rigid bodies were visible. The sacrum rigid body
was secured on the midline between the left and right posterior superior iliac spines using
a velcro belt around the waist as well as double-sided tape attached directly to the skin.
The thoracic rigid body was attached as close as possible to the spinous process of the 8th
additional block was mounted to the underside of the thoracic rigid body so that the face
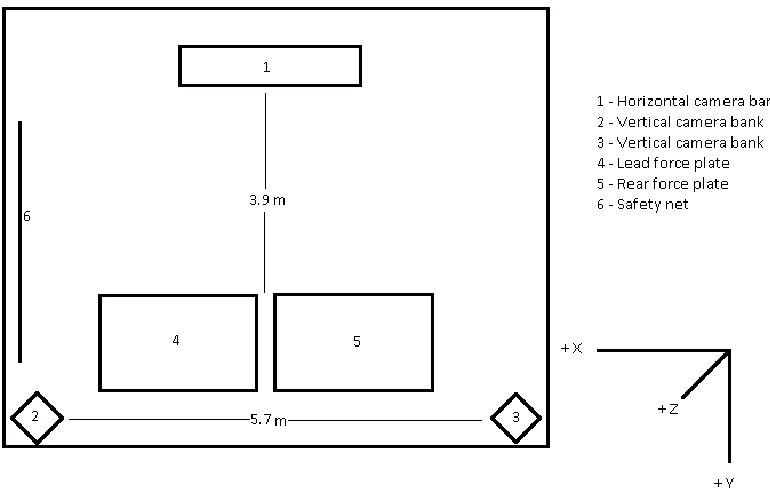
of the rigid body sat above the musculature on either side of the spine (Figure 2).
Figure 2: Components of the experiment set up. The golfers stood with one foot on each
force plate (labelled 4 and 5) and drove foam golf balls into the safety net. Their kinematics
Figure 3: Thoracic rigid body assembly (top) sacrum rigid body assembly (bottom).
3.2.2
Kinetic Equipment
Golfers performed all swings while standing with each foot on separate piezoelectric
Kistler force plates (9287B and 9287BA, Kistler Holding AG, Winterthur, Switzerland).
The 9287BA had an integrated amplifier and the 9287B had an external amplifier
(9865c). A 16 bit, +/- 10 V Kistler A/D board (PCIM-DAS 1062/16) converted the
analog signals from the 9287B Kistler force plate at 300 Hz. Bioware software (Version
5.3.0.7, Kistler Holding AG, Winterthur, Switzerland) was used to collect, analyse and
export the force and center of pressure data for each of the force plates. The Fz1,2
using the Optotrak system using a 16-bit analog to digital convertor (ODAU II, NDI,
Waterloo, Ontario, Canada). This signal was used to synchronize the Kistler and Optotrak
data. The Kistler data were subsequently decimated to 100 Hz to match the Optotrak data.
3.2.3
Microphone
The analog output of a miniature omnidirectional electret condenser microphone
(CME-1538-100LB, CUI Inc, Tualatin, OR) was collected together with the FZ1,2 on the
Optotrack ODAU system. This signal was used to define the instant of ball contact.
3.3
Golf Equipment
All participants brought their personal golf driver, golf shoes, golf glove (if they used
one) along with a pair of athletic shorts. All swings were performed using a foam golf
ball hit off of a 7.62 cm rubber practice golf tee into a safety net. The golfers stood such
that one foot was on each force plate. A golf driving range practice mat was secured with
double-sided tape over the two force plates; this enabled the golfers to obtain traction in
their golf shoes and make their swings as natural as possible. The force plate outlines
were marked on the practice mat with black tape to ensure the golfers’ feet remained on
the force plates at all times during testing.
3.4
Calibration
A five second reference position trial was performed that included additional IRED
markers placed on various anatomical landmarks. This was performed in order to align
the local coordinate system for each rigid body with the anatomical coordinate system
and Noffal, 2010b). The additional individual IRED markers were placed on the
following landmarks. For the lead leg segment, reference markers were placed on the
medial and lateral malleoli, fibular head and tibial tuberosity. For the sacrum segment,
reference markers were placed on the right and left anterior superior iliac spines and a
single sacrum marker was placed on the midline, 2 cm below the sacrum rigid body. For
the thorax segment, reference markers were placed on the skin overlying the spinous
process of the 9th thoracic vertebra (directly below the thoracic rigid body), and overlying
the right and left acromion processes. The individual markers were removed before
testing began.
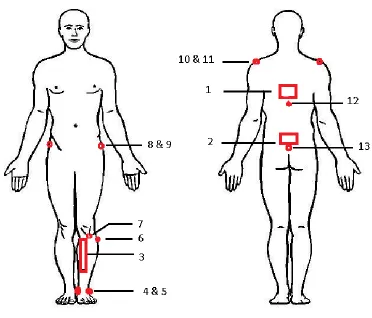
Figure 4: Location of calibration markers, thoracic rigid body and sacrum rigid
body. 1) thoracic rigid body 2) sacrum rigid body 3) shank rigid body 4) medial
tuberosity marker 8) left anterior superior iliac spine marker 9) right anterior
superior iliac spine marker 10) left acromion process marker 11) right acromion
process marker 12) 9th thoracic spinous process marker 13) sacrum marker
The coordinate systems for each of the rigid bodies were aligned to the individual
participant’s skeleton using commercial software (NDI 6D Architect Version 1.03.03,
NDI, Waterloo, Ontario). For the shank rigid body, the ISB convention for a tibiofibular
coordinate system was used (Wu et al., 2002), however axis names and directions differ.
For example, the ISB convention describes the long axis of the tibia as the Y axis while
the long axis of the tibia is called the Z axis in this thesis. The origin was defined as the
mid-point of the two malleoli reference markers. The vector from the origin to the lateral
malleolus defined +X axis. A vector from the origin in the same Y plane as the tibial
tuberosity, bisecting the tibial tuberosity and fibular head marker in the X plane, in the
superior direction is +Z. The +Y axis was perpendicular to these two vectors, and
oriented in the posterior direction.
A modified ISB (Wu et al., 2002) pelvic coordinate system was used to align the sacrum
rigid body to the pelvis. The origin in the ISB convention is located at the center of the
acetabulum which is different than this thesis. The single sacrum reference marker
defined the pelvic origin. Also, similarly to the tibiofibular coordinate system, the ISB
convention describes the vertical axis of the pelvis as the Y axis while that axis is called
the Z axis in this thesis. The vector from right anterior superior iliac spine marker to the
left was defined as the orientation of the +X axis. The vector from the origin to the
orientation of the -Y axis. The +Z axis was perpendicular to these two vectors, pointing
superior.
To align the thoracic rigid body to the thoracic region of the participant, no ISB
coordinate system exists. Therefore the thorax was aligned using the single T-9 marker as
the origin. The vector from the right acromion process reference marker to the left
acromion process reference marker defined the orientation of the +X axis. The +Z axis
was defined as the vector from the origin to the midpoint of the line joining the acromion
markers, pointing superiorly. The +Y axis was perpendicular to these two vectors,
pointing posteriorly. Accordingly the coordinate systems for the thorax, pelvis and leg
were all oriented similarly when the participants were standing.
3.5
Procedures
Upon arrival at the research lab (Thames Hall 2125) the participants read the letter of
information, and completed the consent form and the low back pain questionnaire.
3.5.1
Lead hip internal range of motion test
The participants lead foot, wearing their golf shoe, was placed and strapped securely to a
custom built rotating platform (Figure 4) similar to (Gulgin et al., 2010). The participants
began standing in a comfortable stance with their feet shoulder width apart and their feet
aligned; they keep their thorax and pelvis stationary. They then actively internally rotated
their entire lower lead extremity at the hip while keeping their knee fully extended. Once
they reached the end of their active range of motion, the researcher applied a force using
a handle mounted to the rear of the apparatus to achieve greater internal rotation. The hip
rotation range of motion was identified as the peak internal rotation angle between the
shank rigid body relative to the sacrum rigid body.
3.5.2
Warm up
In an attempt to replicate the participants typical golfing routines, they were instructed to
perform exactly what they would do prior to a round of golf. Whether this was
performing a warm up or stretching routine, no instructions or limitations were given.
3.5.3
Golf Swing Testing
Before data collection began, the participants stood behind the force plates while tare
voltages were collected. Once cued, the participant stepped forward and positioned their
feet on the separate force plates. Participants had as much time as they needed to
complete a swing. Once they swung they stepped off of the force plates. This process was
repeated 10 times. Post processing revealed that some trials had extensive segments with
missing markers and had to be discarded. Each of the participants had at least six trials
with minimal missing markers and accordingly six trials were analyzed for each
participant.
3.6
Post Processing
First principles software was used in post processing to calculate the relative angles
between rigid bodies using Euler angles calculated in the sequence Z-Y-X. Angles
between the thorax and pelvis rigid bodies described lumbar motion. Angles between the
pelvis and shank rigid bodies were used to describe lead hip rotations. Specifically, a
relative angle calculation of the shank with respect to the sacrum was used to define the
lead hip orientation during the golf swing at address, ball contact and peak follow
through and the internal rotation range of motion test. It was assumed that rotation of the
shank rigid body represented an associated rotation of the femur, which is reasonable due
to the high stiffness and decreased laxity of the knee when it is in an extended position
(Markolf et al., 1976). This approach is similar to the “rigid shank clusters only” method
for calculating hip joint motions reported by Schulz and Kimmel (2010), and is consistent
with other researchers’ approach that have reported improved estimates of hip joint
motion using markers on the tibia rather than the thigh (Wren et al., 2008). This approach
for calculating hip motions is more accurate than using thigh marker sets as there is a
(Schulz and Kimmel, 2010). Whereas the medial portion of the tibial plateau has very
little soft tissue between the bone and the skin.
The relative angle between the thoracic rigid body with respect to the sacral rigid body
defined the lumbar axial rotation, lumbar lateral bend angle and flexion. These angles
were calculated using Euler angles in the sequence Z-Y-X.
The kinematic data contained spikes of noise, likely due to “camera switching” (Kuxhaus
et al., 2009) as IREDS were lost to the field of view of one camera bank and picked up by
another camera bank. Accordingly a median filter (5 point moving median filter) was
used similar to other protocols (Kuxhaus et al., 2009), since typical IIR filters such as
Butterworth low-pass filters, are not suitable for this type of signal contamination (Smith,
1997) . During data collection there were short durations when IREDs on a rigid body
was not visible, therefore Optotrak could not identify the rigid body, creating gaps in the
Euler angle data. These small gaps of missing data were re-constructed using linear
interpolation, which has been shown to be an accurate reconstruction method by Howarth
and Callaghan (2010).
3.7
Data Reduction
Each of the six trails for each participant were broken down into three phases, address,
ball contact and peak follow through. Address was defined as the average position and
orientation of the three rigid bodies over a 50 frame span. This 50 frame time span was
chosen manually during post processing to identify when the golfer was motionless
before beginning their swing. Ball contact was defined as the instant corresponding to the
ball. Peak follow through was defined as the peak rotation of the thoracic rigid body
relative to the global coordinate system.
3.8
Statistical analysis
Visual analysis of several of the variables revealed several outlying trials that did not
reflect the other participants in the group. Due to the presence of these outliers, and the
uneven distribution within groups, non-parametric analyses were used (Whitley and Ball,
2002). Un-paired analyses using Mann-Whitney tests were performed using Prism
Software (version 6.07, GraphPad Software, San Diego, CA, USA). The threshold for
4
Results
On average, the golfers without low back pain started in the address position with
approximately 10 more degrees of external rotation of their lead foot than golfers with
low back pain (Figure 6), though this difference was not statistically significant
(p=0.267). This 10 degree average difference was maintained at the other phases (ball
contact and peak follow through), though these differences were also not statistically
significant (p=0.202 and p=0. 0.431, respectively). Both groups progressively increased
the external rotation of their lead foot from address to ball contact to peak follow though.
Figure 6: Lead foot orientation for both golfers with and without low back pain during address, at ball contact and peak follow through. 0° represents orienting the lead foot perpendicular to target and positive values represent external rotation of the lead foot (i.e. toward target). On average, the golfers without low back pain externally rotated their lead foot more than golfers with low back pain in all three
phases, however these differences were not statistically significant.
Ad dre
ss - n
o p ain
Ad dre
ss - p
ain
Ba ll c
on tac
t - no
pa in
Ba ll c
on tac
t - pa
in
Fo llo
w t hro
ug h
no pa
in
Fo llo
w t hro
ug h
pa in - 2 0
0 2 0 4 0 6 0 8 0 1 0 0
On average, golfers with low back pain externally rotated their lead hip significantly less
during address than golfers without low back pain (average difference of 12.3°; p= 0.048)
(Figure 7). On average, the golfers with low back pain’s lead hips were internally rotated
at ball contact when the lead hip of golfers without pain was still externally rotated; the
average difference was 16.9°, but was not statistically significant (p=0.073). The lead hip
internal rotation angle at peak follow through was significantly greater, on average 9°
greater, in the golfers with low back pain than the golfers without low back pain
(p=0.030).
Figure 7: Lead hip internal/external rotation for golfers with and without low back pain during address, at ball contact and peak follow through. 0° represents neutral orientation of the lead hip. Negative values represent external rotation, and positive values represent internal rotation. Golfers with low back pain had significantly less lead hip external rotation at address and significantly more lead hip internal
rotation than golfers without pain at peak follow through. No statistically significant difference was found between groups at ball contact.
Ad dre
ss - n
o p ain
Ad dre
ss - p
ain
Ba ll c
on tac
t - no
pa in
Ba ll c
on tac
t - pa
in
Fo llo
w t ho
ug h
no pa
in
Fo llo
w t hro
ug h
pa in - 4 0
On average, both golfers with low back pain and golfers without pain began their swings
during address with their pelvises rotated toward target (Figure 8). On average, pelvic
rotation progressively increased from address, to ball contact and peak follow through.
There was no significant difference between global pelvic orientation of golfers with low
back pain and golfers without pain at address (p=0.202)), ball contact (p=0.755) or peak
follow through (p=0.876).
Figure 8: Pelvic orientations in the transverse plane for golfers with low back pain
and golfers without low back pain during address, at ball contact and peak follow
through. 0° represents the X axis of pelvis (a vector from right ASIS to left ASIS) i.e
oriented towards the target. Positive values represent pelvic rotation towards the
target. No statistically significant differences were found between groups at address,
ball contact or peak follow through.
Ad dre
ss - n
o p ain
Ad dre
ss - p
ain
Ba ll c
on tac
t - no
pa in
Ba ll c
on tac
t - pa
in
Fo llo
w t hro
ug h
no pa
in
Fo llo
w t hro
ug h
pa in - 5 0
0 5 0 1 0 0 1 5 0
On average, the golfers without low back pain had more lumbar axial rotation toward
target at address than the golfers with low back pain (Figure 9), although this difference
was not statistically significant (p= 0.106). On average, at ball contact and peak follow
through, both groups rotated their lumbar spine within 4° of each other. (p= 0.755 at ball
contact, and p>0.999 at peak follow through).
Figure 9: Lumbar axial rotation for golfers with and without low back pain during
address, at ball contact and peak follow through. Positive values represent rotation
toward target, negative values represent away from target, relative to the pelvis. On
average, the golfers without low back pain rotated their lumbar spine towards
target more than the golfers with low back pain during all three phases, though it
was not statistically significant.
Ad dre
ss - n
o p ain
Ad dre
ss - p
ain
Ba ll c
on tac
t - no
pa in
Ba ll c
on tac
t - pa
in
Fo llo
w t hro
ug h
no pa
in
Fo llo
w t hro
ug h
pa in - 2 0
On average, the golfers with and without low back pain addressed the ball with
approximately 5° lumbar lateral bend away from target (Figure 10); there was no
significant difference between groups (p= 0.876). At ball contact the golfers with low
back pain had more lumbar lateral bend than the golfers without pain, although this
difference was not statistically significant. On average, the golfers without low back pain
increased their lumbar lateral bend at peak follow through while the golfers with low
back pain decreased their lateral lean angle. However the differences between groups
where not significant at ball contact (p= 0.530) or peak follow through (p= 0.343).
Figure 10: Lumbar lateral bend for golfers with and without pain during address,
ball contact and peak follow through. 0° represents neutral (where the X axis of
both the thorax and pelvis are oriented in the same direction). Negative is right
lateral bend (away from target). No statistically significant difference was found
between groups at any of the three phases.
Ad dre
ss - n
o p ain
Ad dre
ss - p
ain
Ba ll c
on tac
t - no
pa in
Ba ll c
on tac
t - pa
in
Fo llo
w t hro
ug h
no pa
in
Fo llo
w t hro
ug h
pa in - 3 0
On average, there was no significant difference between lumbar flexion angles between
golfers with and without low back pain during address (p= 0.202), at ball contact (p=
0.530) and at peak follow through (p= 0.876). Golfers with low back pain showed less
variability in lumbar flexion angles at address compared to golfers without low back pain.
Figure 11: Lumbar flexion/extension angle for golfers with and without low back
pain at address, ball contact and peak follow through. 0° represents neutral posture
(thoracic Y axis and pelvic Y axis parallel). Positive values represent lumbar flexion.
No significant differences were found between groups at any of the three phases.
Ad dre
ss - n
o p ain
Ad dre
ss - p
ain
Ba ll c
on tac
t - no
pa in
Ba ll c
on tac
t - pa
in
Fo llo
w t hro
ug h
no pa
in
Fo llo
w t hro
ug h
pa in - 4 0
During the address position on average, golfers with low back pain bore more weight on
their rear foot compared to golfers without pain (Figure 12), however the difference was
not statistically significant (p= 0.149). Golfers with low back pain, on average, bore more
body weight onto their rear foot at ball contact than golfers without low back pain,
however this difference was not statistically significant (p= 0.267). On average, golfers
with low back pain bore significantly more of their body weight onto their rear foot at
peak follow through than golfers without low back pain, which was statistically
significant (p= 0.030). These findings indicate a trend between groups for golfers with
low back pain to maintain a higher percentage of bodyweight on their rear foot from ball
contact to peak follow through compared to golfers without low back pain.
Figure 12: Percentage of bodyweight on the rear foot for golfers with and without low back pain during address, at ball contact and peak follow though. Golfers with low back pain bore significantly more bodyweight on their rear leg at peak follow through compared to golfers without low back pain.
Ad dre
ss - n
o p ain
Ad dre
ss - p
ain
Ba ll c
on tac
t - no
pa in
Ba ll c
on tac
t - pa
in
Fo llo
w t hro
ug h
no pa
in
Fo llo
w t hro
ug h
pa in 0 2 0 4 0 6 0 8 0 1 0 0
The data about the amount of weight borne on the lead leg mirror the data from the trail
limb. During the address position, on average, the golfers with low back pain bore less of
their body weight on their lead leg than the golfers without low back (Figure 13);
however, this difference was not statistically significant (p= 0.149). On average, the
golfers with low back pain bore less of their body weight onto their lead foot at ball
contact than the golfers without low back pain, although this difference was not
statistically significant (p=0.267). On the other hand, at peak follow through there was a
statistically significant increase in weight borne through the lead leg for the golfers
without low back pain compared to the golfers with low back pain (p= 0.030). These
findings indicate a trend between groups of the golfers without low back pain
maintaining more of their body weight on their lead leg from ball contact through to peak
Figure 13: Percentage of bodyweight borne on the front foot for golfers with low
back pain and golfers without low back pain during address, ball contact and peak
follow though. Golfers with low back pain had significantly less body weight on
their lead leg at peak follow through than golfers without low back pain.
Ad dre
ss - n
o p ain
Ad dre
ss - p
ain
Ba ll c
on tac
t - no
pa in
Ba ll c
on tac
t - pa
in
Fo llo
w t hro
ug h
no pa
in
Fo llo
w t hro
ug h
pa in 0 2 0 4 0 6 0 8 0 1 0 0
We did not observe any statistically significant difference in the lead hip internal rotation
range of motion (Figure 14) for golfers with and without low back pain (p= 0.755). Large
variability was found for both groups in passive internal rotation.
Figure 14: Internal rotation range of motion of lead hip of golfers with and without
low back pain. There was no statistically significant difference between groups.
All of the golfers with low back pain exceeded their lead hip internal rotation range of
motion at peak follow through, while there was a large amount of variability in the
golfers without low back pain – some of the participants had less internal rotation at peak
follow through than their passive range of motion, others had similar magnitudes and one
participant had a large amount of internal rotation at peak follow through (larger than any
of the golfers with low back pain). The amount of lead leg internal rotation at peak follow
through compared to their lead hip internal rotation range of motion was significantly
greater in the golfers with low back pain compared to the golfers without low back pain
(p= 0.048; Figure 15).
Figure 15: Difference in lead hip internal rotation range of motion test angles compared to lead hip internal rotation at peak follow through. 0° represents no difference in lead hip internal rotation range of motion compared to lead hip
internal rotation at peak follow through. Negative values represent a golfer who had larger lead hip internal rotation at peak follow through values than lead hip internal rotation range of motion test values. On average, golfers with low back pain had a significantly larger difference between their internal rotation range of motion test value and peak follow through internal rotation value.
N o P a in P a in
5
Discussion
The purpose of this paper was to investigate the potential kinetic and kinematic
differences in golfers with and without golf related low back pain. It was hypothesized:
1) that golfers with low back pain will have reduced internal rotation of the lead hip at
peak follow through compared to the golfers without low back pain, 2) that golfers with
low back pain will have an increased percentage of body weight on the trail leg during
address, ball contact and follow through in relation to golfers without pain, and 3) that
golfers with low back pain will have increased lumbar axial rotation compared to golfers
without pain.
5.1
Kinematic Measures
5.1.1
Lead Hip Orientation
The main purpose of this study was to investigate the relationship between the lead hip
kinematics of golfers who experience low back pain and those who do not. It was
hypothesized that the golfers with low back pain would exhibit less lead hip internal
rotation at peak follow through than golfers without low back pain. The findings of this
study did not support this hypothesis. In fact, we observed the opposite. We observed that
golfers with low back pain had significantly less lead hip external rotation at address and
significantly greater lead hip internal rotation at ball contact and peak follow through
phases.
During the address position the golfers with low back pain presented significantly less
external rotation of the lead hip than their pain free counterparts (on average 12.3° less).
This decrease in lead hip external rotation at address may be related to the decreased
rotation of the lead foot toward target.On average, the golfers with low back pain
without low back pain. These findings are interesting given that the participants were not
given any direction regarding proper stance or orientation of their lead foot – they
performed their natural swings. The target location and target direction was the same for
each group. Therefore, the trends in lead foot orientation between groups may reflect a
difference in stance setup. Since the foot, shank and femur are all part of the same limb,
and the stiffness of the knee increases when extended in regards to internal and external
rotations (Markolf et al., 1976), a change in the foot orientation will have an associated
effect on the orientation of the femoral head in the acetabulum. These findings have
important implications for golfers as a small change in their lead foot orientation in
relation to their desired target may have a significant effect on their hip kinematics. The
relationship between reduced lead hip internal rotation at peak follow through and golf
related LBP needs to be investigated further. Future studies could control for lead foot
orientation in relation to target with golfers who experience low back pain. For example,
they could allow the golfers to swing using their normal address setup while collecting
hip kinematics during golf swings, then increase their lead foot rotation toward target in
an attempt to identify any potential differences in their hip kinematics. These findings
could also be used in an intervention study. For example, golfers with identified low back
pain could be instructed to increase their lead foot external rotation towards their target
when they play. Back pain could be monitored to identify whether this change in foot
orientation causes changes in pain levels.
No statistically significant difference in lead hip internal rotation was identified between
groups at ball contact. However, the lead hip of the golfers without low back pain, on
golfers with low back pain was already internally rotated 12.6° at ball contact. Although
not statistically significant, this 16.9° difference identifies a potential trend in the hip
kinematics between each group. This trend is interesting because the goal of the golf
swing is ball contact. After ball contact, the goal of the swing has been achieved; now the
golfer needs to decelerate in order to maintain balance. The current findings are
interesting because the lead hip of a golfer with low back pain is already 12.6° internally
rotated at ball contact. Given that there was no significant difference in hip range of
motion between groups, this internal rotation position at ball contact means that the golfer
has less internal range of motion available to decelerate. Comparatively, the golfers
without low back pain made contact with the ball with 4.3° of external lead hip rotation.
These golfers achieved the goal of the swing prior to their lead hip becoming internally
rotated, meaning they could begin to decrease their momentum while their lead hip was
still in external rotation. This reduction of momentum when the lead hip is in external
rotation could mean the lead hip never reaches the peak internal rotation range of motion.
This trend was observed in the difference in lead hip internal rotation angles between
range of motion test and peak follow through; the golfers in the low back pain group
surpassed their internal range of motion significantly more than the golfers in the no pain
group.
As well, a statistically significant difference was found between the lead hip orientations
of the two groups at peak follow through. Golfers with low back pain, on average, had 9°
more internal rotation of the lead hip than golfers without pain. The lead hip internal
rotation of the golfers with low pain on average reached 36.9°. This significant difference
related to the golfers with low back pain presenting less rotation of lead foot toward
target at address. Increasing the lead foot rotation toward target has been identified as a
successful way of reducing frontal knee moments in golfers (Lynn and Noffal, 2010), but
the relationship between lead foot orientation and low back pain has not been previously
reported. The range of lead foot rotation from address to peak follow through in the
current study in both groups was similar (48.8° and 43.3° for the golfers with and without
low back pain respectively), and accordingly the golfers with low back pain had 12.7°
less foot rotation toward target at follow through compared to the golfers without low
back pain due to the initial orientation of the foot. These results suggest that the degree of
lead foot rotation toward target at address could be a potential predictor of the lead foot
rotation towards target at peak follow through as well. This highlights the need to
monitor the orientation of the lower leg segment when investigating the hip kinematics of
golfers, since the orientation of the lead foot appears to have a major impact on the
kinematics of the lead hip as the swing progresses. It is unknown if the difference in lead
foot orientation between groups is deliberate. It is possible that golfers without LBP are
aware of their anatomical limitations or have an increased understanding of golf swing
mechanics and increase their lead foot rotation towards target intentionally. Future
research should investigate the rationale for golfers adopting their address setup. It may
be that some golfers may have learned to externally rotate their lead foot through
experience, while others may be following suggestions from golf pros or others.
Alterations of foot orientation have also been investigated in youth baseball pitchers
(Kibler et al., 2013), where a 25° alteration in lead foot external rotation in relation to
stride hip internal rotation (what this paper has referred to as lead hip) is correlated with
decreased scapular posterior tilt at shoulder maximum external rotation, which reduces
performance (Oliver and Weimar, 2014). These findings in baseball literature highlight
the influence that the orientation of the lead foot has on hip kinematics and performance
in sports that require trunk rotation.
During the golf swing the lead leg is the pivot point of the swing. If the foot is planted
and the knee extended, then the pelvis will rotate around the leg towards the target, which
in turn causes the lead hip to internally rotate if hip range of motion allows it. Once ball
contact has been made, the golfer must decelerate in order to maintain balance.
Deceleration of a body segment has been shown to be a potential source of hamstring
injury in soccer players and track athletes (Petersen et al., 2011; Sugiura et al., 2008).
These injuries result from the forces the muscle and tendon experience while dissipating
the energy of the decelerating segment. This corresponds with the theory of Vad et
al.(2004) who postulate that golfers with low back pain are reaching their lead hip peak
internal range of motion during the follow through phase of the golf swing. This inability
of the head of the femur to continue rotating in the acetabulum could contribute to low
back pain. Future research is needed in this area, in order to identify the direct
mechanism of injury in relation to hip deceleration and low back pain.
5.1.2
Lead foot Orientation
Lead foot orientation during the address position was hypothesized to be less externally