ANALYZING AND FILTERING BIG DATA
CONCERNED WITH ELECTIONS VIA HADOOP
FRAMEWORK
1
Dr. Gagandeep Jagdev,
2Mahabli Mann,
3Dr. Dinesh Kumar
1
Dept. of Computer Science, Punjabi University Guru Kashi College, Damdama Sahib (PB)
2
Research Scholar (M.Phil. Comp. Applications), Guru Kashi University, Talwandi Sabo (PB)
3
Associate Professor, Guru Kashi University, Talwandi Sabo (PB)
ABSTRACT
Data is not a new term in the field of computer science, but Big Data is essentially a new word. When data grows beyond the capacity of currently existing database tools, it begins to be referred as Big Data. Big Data possess a grand challenge for both data analytics and database. It has been only in 2013 to 2015 that humans have created 90 percent of data existing on the planet earth since existence of humans on this planet. The huge technological up gradation in social network, in retail industry, in health sector, in engineering disciplines, in the field of wireless sensors, in stock market, in public and private sector, all has collectively amassed enormous data. This data is very huge in volume, it gets created at very high speed, it may be structured, unstructured, semi-structured or may be in text, audio or video format and most important that it is not totally precise and can be messy or misleading. The central theme of the research paper is concerned with handling huge amount of data that is concerned with different formats of elections that are been contested in India. To support this fact, consider the examples of 2014 Lok Sabha elections in which BJP gained total majority and Mr. Narendra Modi became Prime Minister of India and then later in Bihar in 2015 where Nitish Kumar registered a huge victory against the same BJP. Latest addition to this list is the results of Punjab state 2017 elections where Congress came out with flying colors, the reason again been the efficient utilization of Big Data. All these results are inspired by making the best use of data related to past elections and targeting the voters. The research paper also elaborates the working of Apache Hadoop framework and Map-Reduce technology responsible for handling Big Data.
Keywords - Big Data, Big Data analytics, elections, Hadoop framework, Map-Reduce.
I. INTRODUCTION
Internet is the major source which has resulted in the tsunami of data in the past few years. Big data is too big,
it moves too fast, and doesn’t fit the structures of our existing database architectures. It is like an ocean of data
in which we people swim in every day with an effort to come on the surface, but every day the level of data
increases tremendously. Gone are the days when memory was used to be measured in Gigabytes or Terabytes or
Petabytes, today it is measured in exabytes, zettabytes or yottabytes. With Big Data solutions, organizations can
pretty nebulous, in the same way that the term ―cloud‖ covers diverse technologies. Utilizing big data requires transforming information infrastructure into a more flexible, distributed, and open environment [1, 2].
There is no hard and fast rule about exactly what size a database needs to be in order for the data inside of it to
be considered "big." Instead, what typically defines big data is the need for new techniques and tools in order to
be able to process it. In order to use big data, you need programs which span multiple physical and/or virtual
machines working together in concert in order to process all of the data in a reasonable span of time. Getting
programs on multiple machines to work together in an efficient way, so that each program knows which
components of the data to process, and then being able to put the results from all of the machines together to
make sense of a large pool of data takes special programming techniques. Since it is typically much faster for
programs to access data stored locally instead of over a network, the distribution of data across a cluster and
how those machines are networked together are also important considerations which must be made when
thinking about big data problems.
Big data promises deeper insights that data scientists are highly involved in exploring this data in such a manner
that organizations are benefited to its best with total customer satisfaction. Big data analytics is one of the great
new frontiers of IT. Emerging technologies such as the Hadoop framework and MapReduce offer new and
exciting ways to process and transform big data—defined as complex, unstructured, or large amounts of data—
into meaningful insights, but also require IT to deploy infrastructure differently to support the distributed
processing requirements and real-time demands of big data analytics [3, 4].
II. CHALLENGES FACED WITH BIG DATA
Heterogeneity, scale, timeliness, complexity, and privacy problems with Big Data impede progress at all phases
of the pipeline that can create value from data. The problems start right away during data acquisition, when the
data tsunami requires us to make decisions, currently in an ad hoc manner, about what data to keep and what to
discard, and how to store what we keep reliably with the right metadata. Much data today is not natively in
structured format; for example, tweets and blogs are weakly structured pieces of text, while images and video
are structured for storage and display, but not for semantic content and search: transforming such content into a
structured format for later analysis is a major challenge. The value of data explodes when it can be linked with
other data, thus data integration is a major creator of value. Since most data is directly generated in digital
format today, we have the opportunity and the challenge both to influence the creation to facilitate later linkage
and to automatically link previously created data. Data analysis, organization, retrieval, and modeling are other
foundational challenges. Data analysis is a clear bottleneck in many applications, both due to lack of scalability
of the underlying algorithms and due to the complexity of the data that needs to be analyzed. Finally,
presentation of the results and its interpretation by non-technical domain experts is crucial to extracting
actionable knowledge [6, 7, 12].
Where to put data
Even small and medium amounts of data can be difficult to manage, both technically in terms of how to store it
and in terms of analyzing it. So, the more data companies have the even more complex the problems of
managing it can become.
One issue with a lot of data is that it can create bias. If one has two polls, it can be pretty easy to decipher what
those polls are saying. Now if one is analyzing 100 surveys, there can be much more nuanced issues within that
data. Well the more data you have, the more wiggle room there can be to sway the stats.
False positives
Sometimes people rush decisions based on a subset of data (thinking fast). A better practice is to ―think slow‖
and really rationalize data. With big data, thinking fast (not analyzing the data fully) can lead to false positives.
Big complexity
Complexity refers to the problem of finding the needle in the haystack. The more data you have, sometimes the
harder it can be to find true value from the data.
I.
FIVE PHASES OF BIG DATABig data processing involves four different phases [2, 6, 7, 16].
Educate
The key to the Educate phase is developing a crisp vision for one’s organization's application of Big Data. While
the Educate phase is all about research, any organization wanting to integrate Big Data into their business has to
take definite ownership in this phase. Otherwise, they risk never exiting this phase. Conflicting messages about
Big Data - sometimes driven by vendors or self-styled pundits - can make this phase more difficult as companies
seek to gain a base level of knowledge in Big Data so they can figure how it will help their business.
Explore
After the Educate phase comes the Explore phase. This is where an organization develops a strategy and Big
Data roadmap based on their particular business needs and challenges. The Explore phase is the time to do your
due diligence on Big Data tools and seek out the right tools for your organization.
Big data is a much broader discussion than any one particular type of technology or data.
The average enterprise company is hoarding data and trying to get more insight from it.
Some aspects of big data like volume and diversity (or variety) are not new, but new capabilities like
real-time analytics are adding complexity.
There is still a lot of uncertainty around Big Data. The HDS executives point to the reality that a company's
ownership over a Big Data vision is necessary to proceed to a successful Big Data implementation.
Engage
The Engage phase, is where organizations pilot Big Data initiatives to validate business requirements and value.
This phase is where the developing and testing of Big Data tools, processes, and methodologies meet reality in
the form of proof of concepts and pilots.
Execute
The Execute phase is where companies have deployed two or more Big Data initiatives and continue to focus on
their use of advanced analytics. The Execute phase seems to be the domain of larger players such as
multinational companies. For example, HDS points to multiple Big Data implementations throughout their
product and services portfolio. However, their implementations have been in support of data intensive
construction equipment that generate massive amounts of machine data versus the customer based data we
commonly associate with Big Data.
Companies need to chart their own course through these phrases as business and technology discoveries dictate
and play an active role in the formation of their Big Data strategy to ensure its overall success.
The four stages are a good observation but, at the end of the day, you have to start with the business problem
that you decompose iteratively into what algorithms and environment you build for customers.
II.
ELECTIONEERING - USING BIG DATA IN ELECTIONS IN INDIAOne method for predicting the results of upcoming elections is via exit poll. The most valuable information
regarding campaigns and their effect on general public is provided by citizens themselves. Data analysts develop
models based on this information and perform predictions regarding winning and losing chances of any political
party and any political leader. If such results are properly harnessed, they could gain sizeable gains. Elections in
India have always comprised issues based on caste, religion, sentiments, traditional wisdom, opinion polls and
rallies. But 2014 Lok Sabha elections witnessed the use of technology to its very best by political parties. All
this idea was actually borrowed by the way Barack Obama contested his elections in America and raise to power
in 2008 and 2012.
In an extraordinary attempt to engage digitally literate electorates of India, Google and some other social
platforms started a forceful digital information campaign. Google India launched one such hub related to
elections where electorates can search for political candidates, political parties, and election platforms and
voting related information in their regions. They even launched one site on the counting date which updated
about live status of results on the day of counting. It was revealed that Narendra Modi consistently topped the
search trends when compared to other candidates [14].
For conducting 2014 Lok Sabha elections, 543 Parliamentary constituencies and 4120 assembly constituencies
were set up. All over India total of 9 lakh 30 thousand polling booths were set up for conducting fair elections.
Voter rolls were prepared in 12 different languages and total of 9 lakh pdf files which amounted to 2.5 crore
pages were deciphered. The real challenge was extraction of voter info from these 2.5 crore PDF pages and
transliteration of the same into English to fuse with other sources. Technology was a big hurdle.
Behavior scores use past behavior and demographic information to calculate explicit probabilities that citizens
will engage in particular forms of political activity. The primary outcomes campaigns are concerned with
include voter turnout and donations, but other outcomes such as volunteering and rally attendance are also of
interest [15].
Support scores predict the political preferences of citizens. In the ideal world of campaign advisers, campaigns
would contact all citizens and ask them about their candidate and issue preferences. However, in the real world
of budget constraints, campaigns contact a subset of citizens and use their responses as data to develop models
that predict the preferences of the rest of the citizens who are registered to vote. These support scores typically
range from 0 – 100 and generally are interpreted to mean ―if you sample 100 citizens with a score of X, X
preferences at the aggregate-level, not the individual-level. That is, people with support scores of 50 are not
necessarily undecided or ambivalent about the candidate/issue and, in fact, may have strong preferences. But
when citizens have support scores of 50, it means that it is difficult to predict their political preferences.
Responsiveness scores predict how citizens will respond to campaign outreach. While there are theoretical
rationales as to who might be most responsive to blandishments to vote, and attempts at persuasion, in general,
predicting which individuals will be most and least responsive to particular direct communications in a given
electoral context is difficult. Campaigns can use fully randomized field experiments to measure the response to a
campaign tactic. The results of these experiments can then be analyzed to detect and model heterogeneous
treatment effects (i.e., predictive scores) that guide targeting decisions. Some of the results of these experiments
can only be used to inform decisions in future elections (e.g., the results of most voter turnout experiments
necessarily come after Election Day), but others can be conducted during the election cycle to improve
efficiency in real time [8, 14].
III.
TECHNOLOGIES HANDLING BIG DATAA
.
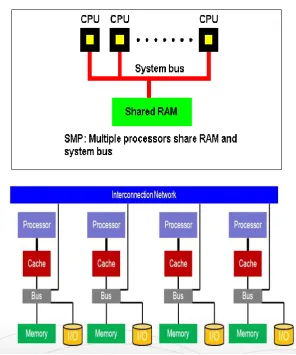
MPP – Massively Parallel Processing
Massive Parallel Processing (MPP) [11, 13] is the ―shared nothing‖ approach of parallel computing. It is a type
of computing wherein the process is being done by many CPUs working in parallel to execute a single program.
One of the most significant differences between a Symmetric Multi-Processing or SMP and Massive Parallel
Processing is that with MPP, each of the many CPUs has its own memory to assist it in preventing a possible
hold up that the user may experience with using SMP when all of the CPUs attempt to access the memory
simultaneously (Fig. 1).
MPP databases use multi-core processors, multiple processors and servers, and storage appliances equipped
for parallel processing. That combination enables reading many pieces of data across many processing units at
the same time for enhanced speed. This method is necessary because the frequencies of processors are hitting
the limits of the technologies used and are slow to increase.
Massively parallel processing (MPP) is a form of collaborative processing of the same program by two or more
processors. Each processor handles different threads of the program, and each processor itself has its own
operating system and dedicated memory. A messaging interface is required to allow the different processors
involved in the MPP to arrange thread handling. Sometimes, an application may be handled by thousands of
processors working collaboratively on the application.
The Massively Parallel Processing relational database architecture spreads data over a number of independent
servers, or nodes, in a manner transparent to those using the database. Big Data environments often use analytic
MPP systems usually called ―shared-nothing‖ databases. In this the nodes that make up the cluster operate
independently and communicate via a network but do not share disk or memory resources. With modern
multi-core CPUs, MPP databases can be configured to treat each multi-core as a node and run tasks in parallel on a single
Fig. 1. Working of SMP AND MPP
B. Hadoop and Map Reduce
Hadoop [9, 10, 12] is a java based framework that is efficient for processing large data sets in a distributed
computing environment. Hadoop is sponsored by Apache Software Foundation. The creator of Hadoop was
Doug Cutting and he named the framework after his child’s stuffed toy elephant. Applications are made run on
systems with thousands of nodes making use of thousands of terabytes via Hadoop. Distributed file system in
Hadoop facilitates fast data transfer among nodes and allows continuous operations of the system even if node
failure occurs. This concept lowers the risk of disastrous system failure even if multiple nodes become
inoperative. The inspiration behind working of Hadoop is Google’s Map reduce which is a software framework
in which application under consideration is broken down into number of small parts [5, 6].
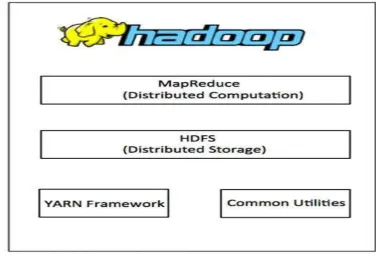
Hadoop framework includes following four modules:
Hadoop Common: These are Java libraries and utilities required by other Hadoop modules. These libraries
provide filesystem and OS level abstractions and contains the necessary Java files and scripts required to
start Hadoop.
Hadoop YARN: This is a framework for job scheduling and cluster resource management.
Hadoop Distributed File System (HDFS™): A distributed file system that provides high-throughput
access to application data.
Fig. 2 depict these four components available in Hadoop framework.
Fig. 2 Figure shows four components involved in Hadoop framework
MapReduce [5] is a processing technique and a program model for distributed computing based on java. The
MapReduce algorithm contains two important tasks, namely Map and Reduce. Map takes a set of data and
converts it into another set of data, where individual elements are broken down into tuples (key/value pairs).
Secondly, reduce task, which takes the output from a map as an input and combines those data tuples into a
smaller set of tuples. As the sequence of the name MapReduce implies, the reduce task is always performed
after the map job.
The major advantage of MapReduce is that it is easy to scale data processing over multiple computing nodes.
Under the MapReduce model, the data processing primitives are called mappers and reducers. Decomposing a
data processing application into mappers and reducers is sometimes nontrivial. But, once we write an
application in the MapReduce form, scaling the application to run over hundreds, thousands, or even tens of
thousands of machines in a cluster is merely a configuration change. This simple scalability is what has
attracted many programmers to use the MapReduce model.
MapReduce program executes in three stages, namely map stage, shuffle stage, and reduce stage.
Map stage: The map or mapper’s job is to process the input data. Generally, the input data is in the form of
file or directory and is stored in the Hadoop file system (HDFS). The input file is passed to the mapper
function line by line. The mapper processes the data and creates several small chunks of data.
Reduce stage: This stage is the combination of the Shuffle stage and the Reduce stage. The Reducer’s job is
to process the data that comes from the mapper. After processing, it produces a new set of outputs, which
will be stored in the HDFS.
The framework manages all the details of data-passing such as issuing tasks, verifying task completion, and
copying data around the cluster between the nodes.
Most of the computing takes place on nodes with data on local disks that reduces the network traffic.
After completion of the given tasks, the cluster collects and reduces the data to form an appropriate result,
and sends it back to the Hadoop server.
Fig. 3. Working of Map Reduce Technology
IV.
IMPLEMENTATION OF RESEARCH WORK CONDUCTEDIn this research paper, a self-constructed huge database has been constructed comprising different political leaders
and political parties who have contested both Lok Sabha and Rajya Sabha elections from different constituencies of
Punjab state since India’s independence [8]. This data is enormous and can be categorized as big data. The primary
aim is to create and provide the electorates of Punjab with information that would help them to analyze different
political parties, political leaders, their history, background, assets, liabilities, criminal cases, achievements,
failures, scams, educational qualification and then finally think and decide who to vote for. On analyzing this
database using Apache Hadoop framework and Map-Reduce algorithm, fruitful results can be obtained in tabular
as well as visualization format as shown in Fig. 4.
V.
CONCLUSION
The next elections may be path breaker in the way it’s fought. It could turn into a massive data gathering work
out where unique databases (for e.g. voter registration, social media, subscription data, transaction profile,
mobile records, television viewership and channel bouquet, work profile, location, etc.) will be integrated
together and analyzed with eagerness to find correlations and patterns. It has been analyzed that about 160
million of those who are not sure about who to vote could be targeted through mobile phones and about a 100
million through television. These people are waiting to hear the right message to make that choice of which
party to vote for and may be the right message is hidden somewhere waiting to be uncovered. So, it can be
concluded that big data analytics could act as a key to reveal the winning mantra which could get a political
party their major win [8, 17].
It can be concluded that big data is all set to play a major role in any national elections to be conducted in future.
Political parties have to concentrate on the use of technology much more than other matters. Appropriate use of
big data guarantees the big win of the political parties.
REFERENCES
[1] Laney, Doug. 2012. ―3D Data Management: Controlling Data Volume, Velocity and Variety.‖
[2] Information Week. 2012. ―Big Data Widens Analytic Talent Gap.‖ Information Week April.
[3] Heudecker, Nick. 2013. ―Hype Cycle for Big Data.‖ Gartner G00252431
[4] Edala, Seshu. 2012. ―Big Data Analytics: Not Just for Big Business Anymore.‖ Forbes.
[5] Dean, Jeffery, and Ghemawat Sanjay. 2004. ―MapReduce: Simplified Data Processing on Large Clusters.‖
Google.
[6] Kaisler, S., Armour, F., Espinosa, J. A., & Money, W. (2013). Big Data: Issues and Challenges Moving
Forward. International Conference on System Sciences (pp. 995-1004). Hawaii:IEEE Computer Soceity.
[7] Katal, A., Wazid, M., & Goudar, R. H. (2013). Big Data: Issues, Challenges, Tools and Good Practices.
IEEE, 404-409.
[8] Gagandeep Jagdev et. al.,‖ Scrutinizing Elections Strategies by Political Parties via Mining Big Data for
Ensuring Big Win in Indian Subcontinent‖, 4th Edition of International Conference on Wireless Networks
and Embedded Systems.
[9] http://hadoopilluminated.com/hadoop_illuminated/Intro_To_Hadoop.html#d1575e686
[10] http://hadoop.apache.org/docs/r1.2.1/ hdfs_design.html
[11]
http://searchdatamanagement.techtarget.com/definition/MPP-database-massively-parallel-processing-database
[12] http://www.slideshare.net/rupenmomaya/big-data-insights-challenges
[13] http://www.salient.com/docs/books/SALIENT_MPP.pdf
[14] Dr. Gagandeep Jagdev et. al., ―Big Data commence a new Trend for Political Parties to Contest Elections
in Indian Subcontinent‖ at National Conference FPIIT-2015 at D.A.V. College, Abohar, Punjab.
[15] Dr. Gagandeep Jagdev et. al., ―Big Data proposes an innovative concept for contesting elections in Indian
subcontinent‖, IJSTA Volume 1, Issue 3, pp. 23-28, 2015, ISSN No. 2454-1532.
[17] Gagandeep Jagdev et. al.,‖ Scrutinizing Elections Strategies by Political Parties via Mining Big Data for Ensuring Big Win in Indian Subcontinent‖, 4th Edition of International Conference on Wireless Networks
and Embedded Systems.
Dr. Gagandeep Jagdev is a faculty member in Dept. of Computer Science, Punjabi
University Guru Kashi College, Damdama Sahib (PB). His total teaching experience is
above 10 years and has 104 international and national publications in reputed journals and
conferences to his credit. He is also a member of editorial board of several international peer
reviewed journals and reviewer panel member of reputed universities. His field of expertise