Understanding Alternative Investments:
A Primer on Hedge Fund Evaluation
Vanguard Investment Counseling & Research
Author
Christopher B. Philips
Executive summary
Sparked by the 2000–2002 equity bear market and fueled by general
expectations of lower future returns for stocks and bonds, popular opinion
has embraced the idea that hedge funds can deliver positive returns
regardless of the direction and magnitude of stock and bond market returns.
As a result, hedge funds have garnered considerable attention as a viable
alternative investment. But is such enthusiasm justified? What have been
the risk-adjusted returns of hedge funds? And what are the risks of hedge
fund investing?
This report examines the characteristics and historical performance of a
common set of hedge fund strategies available to investors. While we find
that most hedge funds operate in a risk-controlled framework, we caution
that investing in hedge funds may not be as simple or safe as often
portrayed. Indeed, this report concludes that:
• Reported hedge fund returns contain significant biases that skew
conventional mean-variance and regression analysis.
• Distinct and enduring differences exist between opportunistic and
non-directional strategies.
• Because of serious data limitations, quantitative analysis of hedge
funds should be supplemented by qualitative judgment.
Background and investment structure
Designed to deliver positive returns independent of returns in the stock and bond markets, hedge fund investments should theoretically enhance a portfolio’s risk-adjusted performance. These return opportunities ostensibly emanate from investing in an expanded universe of securities, employing a wide array of trading strategies, and operating under loose (or nonexistent) regulatory constraints.
Hedge funds are commonly classified as a unique asset class, much like commodities, private equity, and other “alternative” investments. Yet unlike other asset classes, hedge funds do not share unique structural characteristics (e.g., bonds represent a loan to a company or government agency, and stocks represent ownership in a corporation). Consequently, hedge funds should not be thought of as an alternative asset class per se, but rather as investment strategies that trade existing asset classes to generate returns.
While in theory hedge funds enhance the risk-adjusted returns of traditional portfolios, they are also often acknowledged to be potentially risky investments.
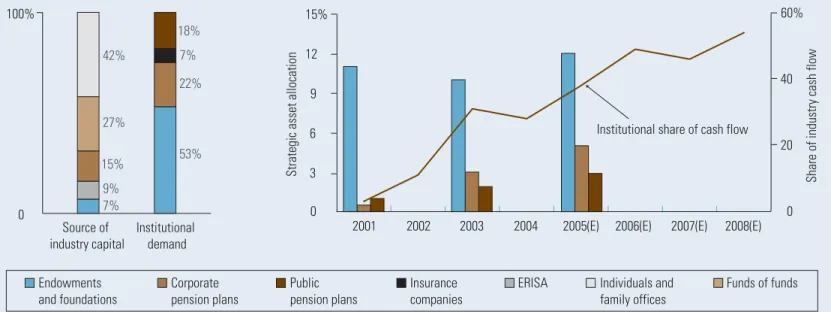
Because of their potential pitfalls, hedge funds should be viewed as long-term investments. It is therefore unsurprising that, as Figure 1 above illustrates, while individuals have historically been the largest investor base for hedge funds, accounting for 42% of total investment, demand is rising among institutions as strategic allocations to hedge funds are increased. Indeed, long-term investors such as endowments, foundations, and defined benefit pension plans are helping to drive the mushrooming interest in hedge fund products.
Given the increasing interest, the number of hedge funds has nearly quadrupled in the last decade, from close to 2,000 in 1994 to more than 8,000 in 2005 (see Figure 2a). At the same time, industry assets have increased from approximately $150 billion in 1994 to over $1 trillion. But is such rapid growth truly driven by a desire to invest in a long-term investment product? Figure 2b and the equity bear market of 2000–2002 may shed additional light on the likely reason for such growth. In Figure 2b, cash flows into hedge funds lag index returns for stocks and hedge funds by one year. 0 100% Source of industry capital Institutional demand 42% 7% 22% 53% 18% 27% 15% 9% 7%
2001 2002 2003 2004 2005(E) 2006(E) 2007(E) 2008(E) 0 20 40 60%
S
trategic asset allocation
S
hare of industry cash flow
Institutional share of cash flow
Endowments and foundations Corporate pension plans Public pension plans Insurance companies
ERISA Individuals and family offices Funds of funds 0 3 6 9 12 15%
Figure 1. Asset flows and industry allocations to hedge funds
E = Estimated.
Note: Industry capital as of December 2002; institutional demand—representing 400 institutions and $66 billion in hedge fund assets—as of December 2003. Survey conducted in 2001 and 2003; values projected for 2005.
Sources: For industry capital, Barclays Capital, 2003; for institutional demand and share of cash flow, Casey, Quirk & Acito and the Bank of New York, 2004; for strategic asset allocation, Goldman Sachs International and Russell Investment Group, 2003.
From this simple exercise, rising interest in hedge funds appears to be attributable to the combination of poor equity returns and positive hedge fund returns during the equity bear market.
Measuring performance: Less than meets the eye
Investment managers use indexes primarily for two purposes: to gauge their skill relative to the overall performance of the market they’re investing in and to establish historical and future expectations for risk, return, and portfolio impact as part of the asset allocation process. Available hedge fund index data indicate that hedge funds commonly provide modest excess returns with low correlation to the returns
of traditional and alternative asset classes. As a result, mean-variance portfolio analysis (a standard evaluation of returns and volatility) suggests that a large allocation to hedge funds is prudent, as it should increase expected portfolio return and lower expected portfolio variance. However, most hedge fund index returns are subject to a number of significant biases that can distort such an analysis.
It should be understood that the values reported from a standard mean-variance analysis are likely unrepresentative of the average investor experience. For several reasons, hedge fund index returns are probably overstated, while volatilities are probably understated. First, reliable data are available only since 1994, causing analysis to be time-period dependent. –40 –20 0 20 40 60 80 100 $120
Figure 2. Hedge fund industry: Market growth
2a. Industry assets and hedge funds 2b. Fund flows and total returns
1994 1995 1996 1997 1998 1999 2000 2001
Number of hedge funds Fund flows (Billions)
Net assets (Billions) Index total return
Index returns year ended December 2000, Cash flow year ended December 2001
Bear market –30 –10 10 30 50 70 90% 0 2,000 4,000 6,000 8,000 10,000 12,000 2002 2003 2004 2005 0 200 400 600 800 1,000 1,200 1994 1995 1996 1997 1998 1999 2000 2001 2002 2003 2004 2005 Estimated assets Net asset flow Estimated number of hedge funds
Dow Jones Wilshire 5000 Index: trailing 12-month return
CSFB/Tremont Hedge Fund Index: trailing 12-month return The performance data shown represent past performance, which is not a guarantee of future results. The performance of an index is not an exact representation of any particular investment, as you cannot invest directly in an index.
Second, failed hedge funds may be excluded from the index data series, particularly from the early years. Funds routinely shut down because they are unable to deliver consistently positive returns, and this has led to a consistently high attrition rate.1
(Estimates from academic research place the average failure rate at more than 8.5% per year for individual funds and more than 6.8% for “fund of fund” hedge funds [Chan, Getmansky, Haas, and Lo, 2005].) Such high attrition results in index returns that are primarily representative of those funds successful enough to survive—biasing returns upward and lowering apparent downside volatility. The smoothed volatility has the additional effect of lowering correlations to other strategies and asset classes.
Additionally, hedge fund returns are self-reported. For obvious reasons, many of the worst-performing funds choose not to report performance, resulting in index risk and return characteristics unrepresentative of the investment options available to investors at any given time. Because the reporting of returns can influence asset growth, most managers are inclined to report returns when performance is positive. But even when performance is good, managers may cease reporting to limit the size of the fund. Therefore, the absence of such funds (both negative and positive performers) from index returns not only reduces the reported range of returns, but also obscures the probability of extreme negative outcomes. This characteristic of hedge fund indexes is commonly referred to as “membership bias.”
Moreover, returns are often reported on an infrequent basis, typically monthly or quarterly. Infrequent fund valuation masks the potential daily volatility of the fund’s individual holdings. These returns may also be overstated and volatility understated for funds investing in illiquid securities, as managers may rely on appraisals that do not reflect realistic market transaction prices.2Appraisal
pricing may lead to better apparent returns than had the fund been marked to market on a daily basis. The combination of appraised security values and infrequent fund valuations can result in return volatility and correlations that appear much better than those of traditional investments, but may also simply be a product of opaque valuation reporting practices.
Finally, methodological differences among index providers can complicate evaluation. No common standard exists: Indexes differ on the number of funds covered, inclusion criteria, strategy definitions, etc. They even account for membership and survivorship bias differently. For instance, while Tremont Capital Management segments funds into 9 strategies, Hedge Fund Research uses 20 strategies, and the Hennessee Group uses 23 strategies. Inclusion criteria range from minimum assets to proof of an audited statement, for example. Such differences can result in significant variation in performance statistics. As such, even simple comparisons among hedge funds can be misleading.
At the broadest level, these index data
characteristics can overstate return and understate risk measures. Consideration of these issues should challenge the assumption that hedge funds, on average, consistently enhance a portfolio’s risk and return profile. But hedge funds are also extremely varied in nature and can influence a traditional portfolio in vastly different ways.
1 Speculation surrounding the high attrition rate focuses primarily on fee structures and the existence of “high watermarks.” A high watermark stipulates that performance fees are only earned when the fund’s net asset value reaches a new high. Negative performance, however, can quickly cause operating costs to mount, which in turn makes it difficult to retain staff, and the fund subsequently closes. In addition, if managers attempt to make up losses through increased leverage or speculation, funds may fail.
Examining hedge fund regulation
Legally, a hedge fund may take the form of a limited partnership, limited liability company, corporation, or trust, depending on where it is domiciled and the investors it is trying to attract.
Historically, hedge funds for U.S. investors have been formed as limited partnerships or limited liability companies. Profits from the investment, as well as tax deductions and other items, are usually split according to each investor’s interest in the partnership. Virtually all partnerships have a general partner, who is usually responsible for the day-to-day duties of running the partnership’s investment. The general partner usually has total liability, while the investors—known as limited partners––are liable only for the amount they invest.
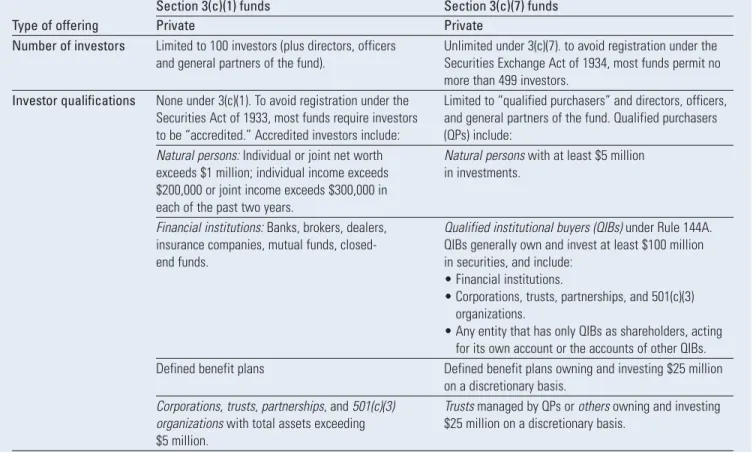
To avoid registering under the Securities Act of 1933 or the Securities Exchange Act of 1934, hedge funds typically comply with either section 3(c)(1) or
3(c)(7) of the Investment Company Act of 1940 (see Table 1). These sections permit a hedge fund to avoid regulation on:
• Compulsory transparency.
• Registration and prospectus requirements. • Restrictions on investments and leverage. • Limitations on fees and sales charges. • Daily valuations.
• Liquidity requirements to meet redemptions. In an important step in increasing hedge fund transparency, a new Securities and Exchange Commission regulation that went into effect in early 2006 requires hedge funds to register as investment advisors. The impact of this regulation on hedge fund returns has yet to be evaluated.
Table 1. Characteristics of section 3(c)(1) funds and section 3(c)(7) funds
Section 3(c)(1) funds Section 3(c)(7) funds
Type of offering Private Private
Number of investors Limited to 100 investors (plus directors, officers Unlimited under 3(c)(7). to avoid registration under the and general partners of the fund). Securities Exchange Act of 1934, most funds permit no
more than 499 investors.
Investor qualifications None under 3(c)(1). To avoid registration under the Limited to “qualified purchasers” and directors, officers, Securities Act of 1933, most funds require investors and general partners of the fund. Qualified purchasers to be “accredited.” Accredited investors include: (QPs) include:
Natural persons:Individual or joint net worth Natural persons with at least $5 million exceeds $1 million; individual income exceeds in investments.
$200,000 or joint income exceeds $300,000 in each of the past two years.
Financial institutions:Banks, brokers, dealers, Qualified institutional buyers (QIBs) under Rule 144A. insurance companies, mutual funds, closed- QIBs generally own and invest at least $100 million
end funds. in securities, and include:
• Financial institutions.
• Corporations, trusts, partnerships, and 501(c)(3) organizations.
• Any entity that has only QIBs as shareholders, acting for its own account or the accounts of other QIBs. Defined benefit plans Defined benefit plans owning and investing $25 million
on a discretionary basis.
Corporations, trusts, partnerships, and 501(c)(3) Trustsmanaged by QPs or othersowning and investing organizationswith total assets exceeding $25 million on a discretionary basis.
$5 million.
Hedge fund strategies: An overview
Although no two funds or strategies are exactly alike, many funds operate within a common framework, namely using offsetting positions to control one or more identified risk factors. In fact, Alfred Winslow Jones formed the first hedge fund in 1949—hedging long stock positions by shorting other positions—in order to mitigate the gyrations in the equity market. Jones’s model was based on the premise that performance depends more on stock selection than market direction. This practice of hedging market risk remains common in today’s hedge fund environment.
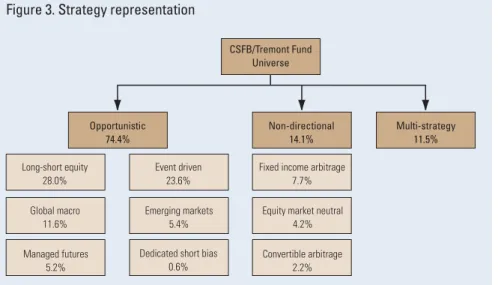
While some hedge funds do mitigate market risk, the degree of risk hedging depends on the strategy. As illustrated in Figure 3, hedge funds can be classified into two broad categories: non-directional andopportunistic. Non-directional strategies tend to neutralize a majority of market risk, largely assuming only idiosyncratic risks (i.e., the risks inherent to individual securities), while opportunistic strategies tend to remain exposed to a degree of market risk in addition to idiosyncratic risks. As a result, opportunistic portfolios tend to be “net long” or “net short” of the market.
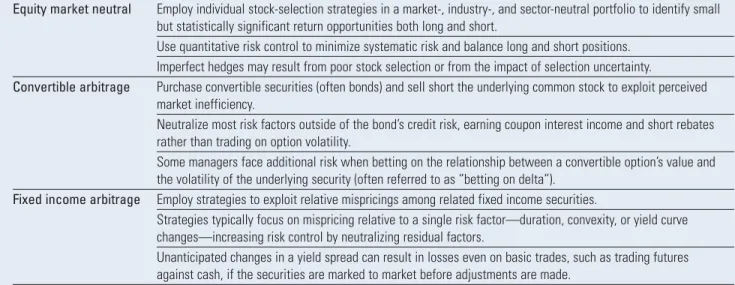
Non-directional strategies adhere most closely to the original intent of hedge funds, whereby long and short positions are established in securities that share similar risk factor exposures (see Table 2 on page 8). In this way, non-directional strategies are generally “risk neutral” to the market. The potential excess return from non-directional strategies emanates from identified mispricings among the related securities held between the long and short positions. Consequently, security selection is critical for a non-directional hedge fund to achieve alpha, or returns in excess of a benchmark, since the fund is otherwise neutral to systematic risk factors in the marketplace. Arbitrage strategies are more likely to utilize leverage ratios exceeding 2:1, with the goal of amplifying historically small spreads, while true market-neutral strategies often do not exceed that level, instead relying on short interest and the manager’s security-selection skills.3
By contrast, opportunistic hedge funds cover a broad spectrum of investment strategies that tactically overweight or underweight exposure to systematic risk factors in an attempt to exploit general market trends (see Table 3 on page 8). In doing so, opportunistic hedge funds are rarely
independent of the risk factors that can drive the returns of more conventional asset classes such as stocks and bonds. Opportunistic funds often invest in a variety of assets, including stocks and bonds, but also in commodities, index and interest rate futures, and currency and global securities markets. Funds may also seek to take advantage of market, economic, geopolitical, and firm-specific events (e.g., bankruptcy or corporate restructuring) that may result in substantial changes in a variety of security prices. Portfolio weights are often linked to technical as well as fundamental information.
3 When a manager shorts a security, the cash that is received must be kept with a prime broker as collateral. The broker will lend the collateral, receiving interest as compensation. A majority of the interest is returned to the manager as short interest, while a small portion is retained by the broker as a fee.
CSFB/Tremont Fund Universe
Fixed income arbitrage 7.7%
Convertible arbitrage 2.2% Equity market neutral
4.2%
Figure 3. Strategy representation
Note: Percentages represent the portion of the CSFB/Tremont hedge fund universe allocated to each strategy as of December 2005; 11.5% of total hedge fund assets were classified as multi-strategy.
Source: Credit Suisse First Boston Tremont Index LLC.
Non-directional 14.1% Opportunistic 74.4% Event driven 23.6% Managed futures 5.2%
Dedicated short bias 0.6% Long-short equity 28.0% Global macro 11.6% Emerging markets 5.4% Multi-strategy 11.5%
Neutralizing market risk
Market risk may be neutralized in an array of markets—stocks, bonds, currency, interest rates, or futures, for example. Broadly speaking, hedging strategies yield a return that equals a spread between the long and short positions, plus a Treasury bill return on cash components.
Consider a $100 million investment placed in a hedge fund that executes a long-short strategy using the Standard & Poor’s 500 Index. At any point in time, the “spread” return on that $100 million investment, RHedge, would equal: R
tHedge= RtLong– RtShort+ Tbill t Margin+ Tbill t Collateral.
To execute such a strategy, a hedge fund manager would:
Establish a long position with the initial $100 million:
Trade #1: Approximately 90% of the initial
investment (i.e., $90 million) is invested to establish the “net long” position, earning RtLong.
Trade #2: Because the Federal Reserve requires that a cash reserve be maintained for a short position (typically 10%, but varying according to the credit quality of the manager), the other $10 million is placed in a cash reserve that earns a Treasury bill return, or TbilltMargin.
Establish a short position to offset the risk exposure of the $90 million long position:
Trade #3: To “sell short” an amount equal to the $90 million net long position, the manager first borrows securities from a securities lending firm.
Trade #4: The manager subsequently sells the borrowed securities, earning RtShort.
Trade #5: The sale proceeds are returned to the lender to be held as collateral. The collateral earns a Treasury bill return, or TbilltCollateral.
The investments in the long and short positions are not limited to equities; long and short positions may be entered in any market where shorting is an option—corporate bonds, options, or futures, for example. The primary goal is to match the risk characteristics of the long and short positions, neutralizing systematic market risk. With market risk neutralized, the manager employs relative-value security selection—going long on underrelative-valued securities and shorting overvalued securities— capturing the spread. A manager will earn a positive excess return (or “alpha”) from a long-short strategy, when compared with a long-only strategy, if the manager possesses superior security-selection skills.
In the best-case scenario, a skilled manager would earn a significantly positive excess return when RtLong> 0 > R
t
Short, or in other words, when
the absolute value of the return on the securities that were sold short was negative, while the return of the long investment was positive.
In the worst-case scenario, a long-short strategy would earn a significantly negative absolute return. This could result if RtShort> 0 > R
tLong, with the net
long investment posting a negative return and the net short position realizing a positive return. Of course, if the returns on a basket of securities that a manager sold short were exactly the inverse of the returns on the long position (i.e., if Rlong= –Rshort),
the return on the hedge fund investment would approximate the return of a money market fund (i.e., a Treasury bill return), before expenses.
Leverage can greatly enhance the spread return of a hedge fund strategy. But leverage also greatly increases volatility and the risk of fund failure, particularly in illiquid or small markets. Leverage can be applied to either the long or the short side, and is often employed using borrowed money or derivatives.4
4 Derivatives—futures, forwards, swaps, and plain-vanilla options—increase the leverage ratio because small movements in the underlying financial instrument translate into large moves within the portfolio. A manager may attain indirect exposure to an investment for an amount that is less than the value of the investment, thus enabling the manager to increase exposure without additional investment.
Table 2. Non-directional strategy descriptions
Equity market neutral Employ individual stock-selection strategies in a market-, industry-, and sector-neutral portfolio to identify small but statistically significant return opportunities both long and short.
Use quantitative risk control to minimize systematic risk and balance long and short positions. Imperfect hedges may result from poor stock selection or from the impact of selection uncertainty.
Convertible arbitrage Purchase convertible securities (often bonds) and sell short the underlying common stock to exploit perceived market inefficiency.
Neutralize most risk factors outside of the bond’s credit risk, earning coupon interest income and short rebates rather than trading on option volatility.
Some managers face additional risk when betting on the relationship between a convertible option’s value and the volatility of the underlying security (often referred to as “betting on delta”).
Fixed income arbitrage Employ strategies to exploit relative mispricings among related fixed income securities.
Strategies typically focus on mispricing relative to a single risk factor—duration, convexity, or yield curve changes—increasing risk control by neutralizing residual factors.
Unanticipated changes in a yield spread can result in losses even on basic trades, such as trading futures against cash, if the securities are marked to market before adjustments are made.
Source:Vanguard Investment Counseling & Research.
Table 3. Opportunistic strategy descriptions
Long-short equity Take independent long and short stock positions, typically using various quantitative models to rank stocks, then buying top-tier stocks and shorting those in the bottom tier, seeking to “double alpha.”
Portfolios often are net long or net short with systematic risk exposure and bets on size, industry, sector, and/or country risk factors.
Emerging markets Invest in emerging-market currencies and equity and fixed income securities with the goal of exploiting perceived market inefficiencies considered to occur more frequently and yielding larger returns.
Managers face unique risks in undeveloped markets that are typically characterized by limited information, lack of regulation, and instability.
Dedicated short bias Sell borrowed securities, hoping to later repurchase at a lower price and return them to the lender. Short selling earns a profit if prices fall. Interest is also received on the cash proceeds from the short sale. Portfolio is typically exposed to industry, sector, and company-specific risk factors, as well as the risk that the market will appreciate.
Global macro Bet on global macroeconomic events, anticipating shifts in government policy or market trends.
Focus primarily on directional trades using currencies, derivatives, stocks, and bonds, rapidly shifting between perceived opportunities while taking on significant market risk (more when leveraged).
Success depends directly on the skill of the manager.
Managed futures Rely on technical or fundamental trend-following models to invest in global options and futures based on currencies, interest rate and index derivatives, and commodities.
Risks include unanticipated commodity shocks, incorrect forecasts, and poor trade timing or positioning. Event driven Profit on firm events such as acquisitions, mergers, tender and/or exchange offers, capital structure
change, the sale of entire assets or business lines, and entry into or exit from new markets. Returns tend to be highly dependent on a manager’s ability to spot these opportunities. Do not hedge against factors such as a weak merger environment or the risk that deals are not completed.
Hedge fund strategies: Traditional performance measures
Since hedge funds differ markedly in their exposure to market risk, a useful starting point in gauging the historical performance of the various strategies is to examine their risk-return profiles. To do so, we examined historical returns of the nine style indexes in the Credit Suisse First Boston/ Tremont (CSFB/ Tremont) Hedge Fund Database. The CSFB/ Tremont Hedge Fund indexes have been reported monthly since 1994, and because they control survivorship bias and eliminate backfill bias, they serve as reliable benchmarks.5The CSFB/ Tremont index constituents
are selected from a database of more than 4,500 funds, representing more than $400 billion in invested
capital. In addition, the indexes maintain a well-defined and transparent construction methodology.
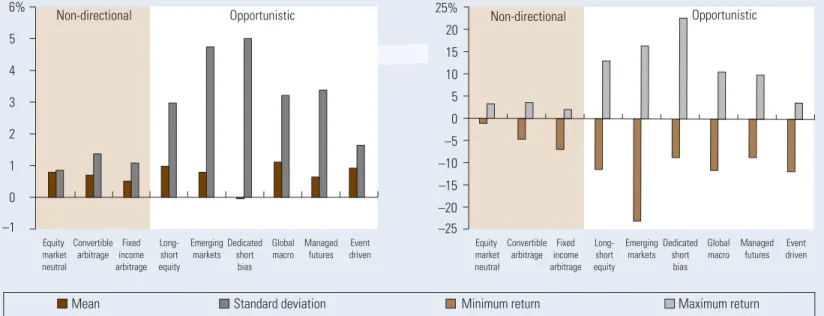
Figure 4a presents the most basic measures of return and risk: the mean and standard deviation, or volatility, of the historical returns of the hedge funds in the CSFB/ Tremont universe. Several important findings emerge from Figure 4a. First, it illustrates that non-directional funds have experienced less volatility than opportunistic funds. This is consistent with the structural differences between the strategies. Opportunistic managers may limit leverage or security bets, but a net long or short portfolio is exposed to market volatility in addition to the volatility associated with idiosyncratic overweights and underweights. For example, a long-short manager may match short positions to only 60% of the long positions, hedging
5 Backfill bias occurs when a fund reports returns for the first time and is subsequently allowed to populate historical returns. The primary concern is that the backfilled returns are unaudited and are more likely to be positive as the manager attempts to establish a track record.
Figure 4. Hedge fund risk and return statistics
4b. Monthly range of returns 4a. Mean monthy returns and standard deviations
Equity market neutral Convertible arbitrage Fixed income arbitrage Emerging markets Dedicated short bias Global macro Managed futures Event driven Long- short equity Opportunistic
Non-directional Non-directional Opportunistic
Note: Data cover period from January 1994 to December 2005.
The performance data shown represent past performance, which is not a guarantee of future results.
Sources: Thomson Datastream, Vanguard Investment Counseling & Research.
–1 0 1 2 3 4 5 6% –25 –20 –15 –10 –5 0 5 10 15 20 25% Equity market neutral Convertible arbitrage Fixed income arbitrage Emerging markets Dedicated short bias Global macro Managed futures Event driven Long- short equity
much of the systematic risk—but not all. The manager still hopes to add alpha through security selection, but maintains exposure to market movements as well.
Second, Figure 4a on page 9 illustrates that mean returns are similar, suggesting that opportunistic strategies may not have appropriately compensated investors for the increased volatility. But are there other risks to non-directional strategies that are not represented by traditional measures of volatility?
Figure 4b on page 9 shows that of the non-directional strategies, convertible arbitrage and fixed income arbitrage have recorded steeper losses than gains. This significant relative downside risk
suggests that volatility in these funds is asymmetric, disproportionately penalizing investors during poor markets. For the most part, this has not been the case with opportunistic strategies, but opportunistic strategies have experienced a much wider dispersion of returns.
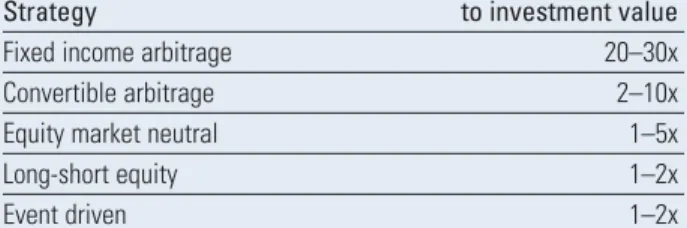
One possible explanation is that convertible arbitrage and fixed income arbitrage tend to use more leverage. In these markets, the use of leverage can exacerbate challenging environments, even in a portfolio that is structured to be market neutral. Table 4 confirms that arbitrage strategies employ leverage to greater degrees. Another possible explanation is that there are limited investment opportunities in the fixed income and convertible markets because of the overwhelming influence of systematic risks relative to idiosyncratic opportunities. Most funds, therefore, would attempt to capitalize on the same perceived inefficiencies. If this were the case, a majority of these funds would be exposed to similar risk factors and likely move in lockstep.
Hedge fund performance: A more robust risk-adjusted measure
As noted, mean and variance cannot convey the entire risk profile of hedge funds. While Figure 4a suggests that investors may want to consider non-directional strategies, Figure 4b illustrates that even risk-controlled funds cannot eliminate the possibility of extreme events. In fact, a consideration of only mean and variance evaluates deviations above and below the mean equally, without gauging the likelihood of large deviations from the mean, particularly to the downside. Of course, a critical assumption in such mean-variance calculations is that the return distribution is normally distributed (i.e., bell-shaped). However, the use of leverage and derivatives can cause disproportionate movements in hedge fund returns relative to the underlying asset class returns. These disproportionate (or “nonlinear”) movements can distort the interpretation of mean and variance. Traditional analytical techniques characterize proportional (“linear”) relationships between asset class returns and hedge fund returns. Disproportionate influences are not reflected and can result in significantly non-normal distributions.
Not adhering to a normal distribution is important for several reasons. Most obviously, traditional risk management is formulated under normal statistical assumptions; as a result, multi-standard deviation events are not effectively considered. As such, using value-at-risk (VaR) measures based on normal return distributions do not effectively model characteristics such as excessive negative skew. A negatively skewed distribution is characterized by more returns slightly above the mean return, combined with fewer but much larger losses. In a statistical sense, for a normal distribution, a skew coefficient of ±0.5 is considered large (Defusco, McLeavey, Pinto, and Runkle, 2001).
Table 4. Leverage levels
Portfolio value relative
Strategy to investment value
Fixed income arbitrage 20–30x
Convertible arbitrage 2–10x
Equity market neutral 1–5x
Long-short equity 1–2x
Event driven 1–2x
With hedge funds, strategies subject to negative skew also tend to exhibit a greater probability of extreme returns in either direction—a type of non-normality referred to as “kurtosis” or “fat tails.”6
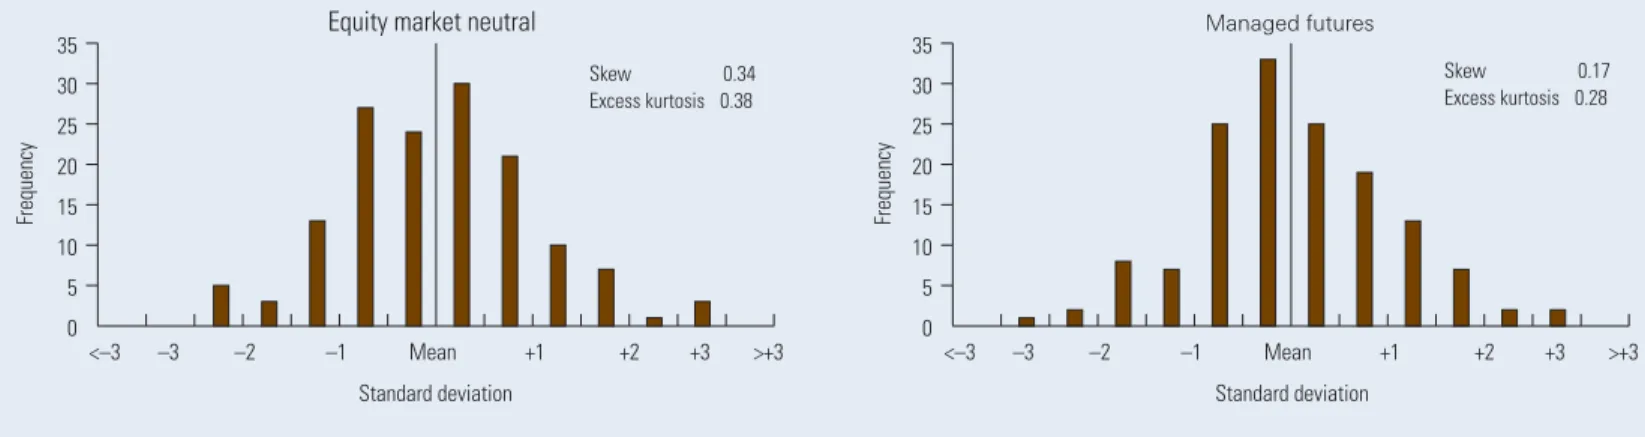
This leads to underestimation of the probability of large losses and often an inability to protect a fund from collapse. Again, in practice, one would expect index results to be better than actuality, as the returns of the worst-performing funds are often unreported and failed funds are often excluded. Figure 5 shows that equity market neutral and managed futures funds have return patterns that are normally distributed. Normality in these two types of funds likely stems from limited use of excess leverage and from investments in liquid, continuously priced assets. While normal return distributions suit traditional analytic techniques, those responsible for evaluating hedge funds should be aware of the data-integrity issues that affect all hedge fund indexes. As a result, regardless of a normal distribution, mean and variance results may still be influenced by the lack of hedge fund transparency.
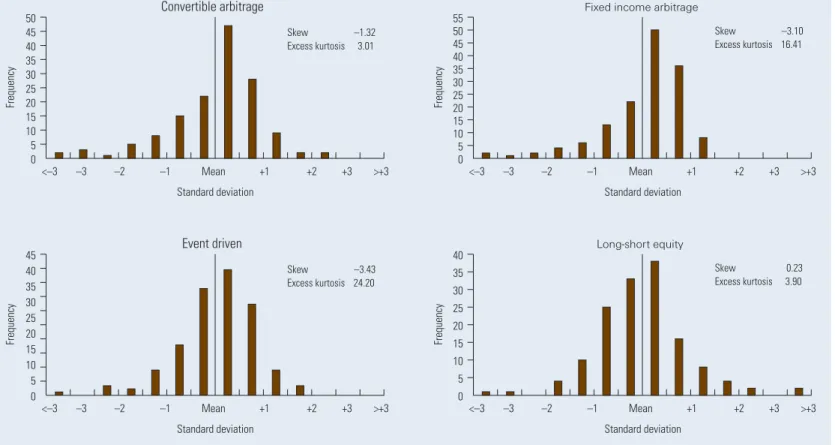
Even with index performance reporting that is tilted in favor of hedge funds, distribution results suggest that many hedge funds violate the normality assumption. An empirical inspection of the data reveals that several strategies can result in non-normally distributed returns. For instance, Figure 6 on page 12 shows that convertible arbitrage, fixed income arbitrage, and event-driven funds have highly negatively skewed returns.7And while long-short
funds display slightly positive skewness, normality is violated by significant excess kurtosis.
The implications of this are important, because even with index returns largely self-reported and concentrated on those funds that do not fail, investors remain exposed to significant levels of extreme returns, particularly to the downside. Accounting for survivorship bias and self-reporting would likely increase the non-normality represented in hedge fund indexes. In sum, the experiences of individual and institutional investors probably differ greatly from what might be expected from index-level analysis, with investors exposed to greater probabilities of extreme returns.
6 A kurtosis value of three is considered normal. This analysis, however, has subtracted three from each measure, resulting in a normal distribution represented by the value of zero. All kurtosis measures, therefore, may be considered excess kurtosis. Excess kurtosis of ±1.0 is considered large (Defusco, McLeavey, Pinto, and Runkle, 2001).
7 Relative-value managers, such as those employing these strategies, bet on a convergence of prices that they believe are misaligned. If the manager is correct, the Figure 5. Monthly return distributions of normally distributed strategies
Managed futures
Equity market neutral
<–3 –3 –2 –1 Mean +1 +2 +3 >+3
Standard deviation Standard deviation
Frequency
Skew 0.34 Excess kurtosis 0.38
Note: Data cover period from January 1994 to December 2005.
The performance data shown represent past performance, which is not a guarantee of future results.
Sources: Thomson Datastream, Vanguard Investment Counseling & Research. 0 5 10 15 20 25 30 35 Skew 0.17 Excess kurtosis 0.28 <–3 –3 –2 –1 Mean +1 +2 +3 >+3 Frequency 0 5 10 15 20 25 30 35
Incorporating downside risk in the risk-return equation
From the return distributions in Figure 6, it’s clear that evaluating downside risk is important. In fact, ranking strategies based on their likelihood of achieving a particular return level, relative to the downside risk associated with that target return, is particularly useful, as managers commonly market specific goals—inflation or a T-bill plus 5% annually, for example. Investors should be able to gauge the effectiveness of a manager in achieving a return level, relative to the risk assumed.
Two new ranking statistics—“Kappa,” developed by Kaplan and Knowles (2004), and “Omega,” developed by Keating and Shadwick (2002)— facilitate strategy comparison, especially when distributions are non-normal and skew and kurtosis can influence investor preference. Kappa is a ratio of returns in excess of a target return (often referred to as a “loss threshold,” or the minimum acceptable return), relative to volatility below the target return. Omega is a ratio of the cumulative likelihood of gain versus loss at a target return. In other words, these statistics allow strategies and funds to be ranked based on the probability of meeting a target return with the least downside risk.
Figure 6. Monthly return distributions of non-normally distributed strategies
Fixed income arbitrage
Convertible arbitrage
<–3 –3 –2 –1 Mean +1 +2 +3 >+3
Standard deviation Standard deviation
Frequency
Skew –1.32 Excess kurtosis 3.01
Note: Data cover period from January 1994 to December 2005.
The performance data shown represent past performance, which is not a guarantee of future results.
Sources: Thomson Datastream, Vanguard Investment Counseling & Research.
Skew –3.10 Excess kurtosis 16.41 <–3 –3 –2 –1 Mean +1 +2 +3 >+3 Frequency 0 5 10 15 20 25 30 35 40 45 50 0 5 10 15 20 25 30 35 40 45 50 55 Long-short equity Event driven <–3 –3 –2 –1 Mean +1 +2 +3 >+3
Standard deviation Standard deviation
Frequency Skew –3.43 Excess kurtosis 24.20 Skew 0.23 Excess kurtosis 3.90 <–3 –3 –2 –1 Mean +1 +2 +3 >+3 Frequency 0 5 10 15 20 25 30 35 40 45 0 5 10 15 20 25 30 35 40
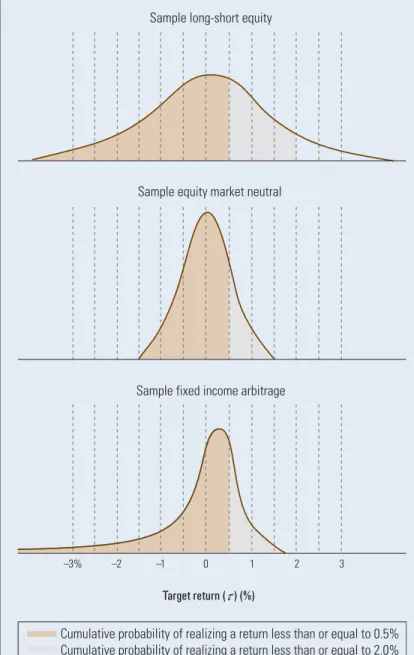
Adding a target rate of return and measuring downside risk can dramatically alter the perception of the risks and returns of the various hedge fund strategies. To illustrate, Figure 7 poses three hypothetical examples with the mean of each curve centered on 0.0%. The long-short equity and equity market neutral indexes are assumed normal for this example, while the fixed income arbitrage index is assumed non-normal. The brown-shaded areas in Figure 7 represent the cumulative likelihood of meeting a 0.5% monthly target return (meaning that any return lower than 0.5% is unacceptable), while the brown-shaded areas plus the gray-shaded areas represent the cumulative likelihood of meeting a 2.0% monthly return threshold. In these hypothetical examples, the brown-shaded areas may represent 65%, 85%, and 80% of the long-short equity, equity market neutral, and fixed income arbitrage distributions, respectively. Intuitively, this means that for long-short equity, 65% of the historical observations fell below 0.5%. If the entire distribution is shaded, the
probability of realizing a return equal to or lower than the largest observation is 100%. As the target return threshold increases, from 0.0% to 0.5%, for example, the shaded area also increases in size, meaning that the likelihood of realizing a return equal to or lower than the threshold grows closer to 100%. If a distribution has a larger portion of its curve shaded relative to another distribution, the curve with the greater shaded area is more likely to realize a return equal to or lower than the threshold and less likely to exceed the threshold.
Relative to the long-short equity and fixed income arbitrage indexes, the equity market neutral index has returns tightly distributed around the mean. This implies that changing the return target from 0.0% will change the brown area more for equity market neutral. At a 0.5% threshold, for example, the equity market neutral index has a larger portion of the distribution shaded than either long-short equity or fixed income arbitrage.
Figure 7. Likelihood of meeting target return with various strategies
–3% –2 –1 0 1 2 3
Cumulative probability of realizing a return less than or equal to 0.5% Cumulative probability of realizing a return less than or equal to 2.0%
Sample fixed income arbitrage Sample equity market neutral
Sample long-short equity
Note: Hypothetical.
Source: Vanguard Investment Counseling & Research.
Therefore, the probability of exceeding the 0.5% threshold is less likely for equity market neutral funds than fixed income arbitrage funds, and much less likely when compared with long-short equity funds. But because the distribution is compact, equity market neutral funds have 0% probability of large negative returns, while both long-short equity and fixed income arbitrage funds have realized large negative returns.
Similarly, at a target return threshold of 2.0%, long-short equity funds are the only funds able to meet the target. In this scenario, long-short funds outperform non-directional funds because the larger standard deviation, identified in Figure 4a, has resulted in monthly observations meeting or
exceeding the 2.0% return threshold from time to time. By design, equity market neutral and fixed income arbitrage funds consistently capture small returns and quite simply, on average, do not achieve monthly returns of that magnitude. While long-short funds have realized such returns, it should be recognized that the probability of failing to meet this target far exceeds the probability of meeting it, as the shaded area is much larger than the unshaded area.
Figure 7 on page 13 also helps to explain the impact of non-normal distributions. Using fixed income arbitrage as an example, the fat tail, representing an increased probability of large negative returns, shifts the mean return (0.0%) to the left of the median (50th percentile) return. This means that while the likelihood of meeting the 0.5% return target slightly exceeds that of equity market neutral funds, the impact of not meeting the target is much greater. In other words, in gaining a slight edge in the ability to meet the return threshold, the cost is the occasional large relative loss. It is beneficial therefore not only to measure the ability to meet a threshold but also to account for the likelihood of falling well short of the threshold, and then rank the strategies accordingly.
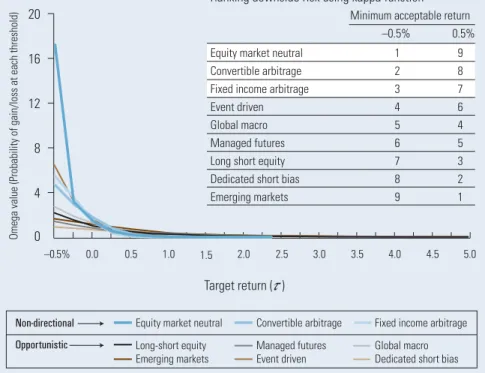
In the data, we find that the theoretical intuition is correct. Figure 8 applies the theoretical framework outlined in Figure 7, ranking the nine hedge fund strategies at various monthly return thresholds. The graph uses the Omega function to rank strategies based on the likelihood of a monthly return failing to meet an identified threshold. At any given target return (x axis), the strategy with the greatest likelihood of meeting that threshold over the measurement period will be positioned higher than the other strategies (y axis).
Figure 8. Strategy rankings using downside performance measures
Omega value (Probability of gain/loss at each threshold)
Non-directional Opportunistic
–0.5% 0.0 0.5 1.0 1.5 2.0 2.5 3.0 3.5 4.0 4.5 5.0
Equity market neutral Long-short equity Emerging markets
Convertible arbitrage Managed futures Event driven
Fixed income arbitrage Global macro Dedicated short bias
Ranking downside risk using kappa function Minimum acceptable return
–0.5% 0.5%
Equity market neutral 1 9
Convertible arbitrage 2 8
Fixed income arbitrage 3 7
Event driven 4 6
Global macro 5 4
Managed futures 6 5
Long short equity 7 3
Dedicated short bias 8 2
Emerging markets 9 1
Note: Table ranks strategies by downside volatility using Kappa equation to measure downside standard deviation, downside skew, and downside kurtosis. Ranked from 1 to 9, with 1 signifying the best risk-adjusted likelihood of the target return relative to the remaining 8 strategies. Data cover period from January 1994 to December 2005. The performance data shown represent past performance, which is not a guarantee of future results.
Sources: Keating and Shadwick, 2002; Kaplan and Knowles, 2004; Thomson Datastream; Vanguard Investment Counseling & Research.
Target return ( ) 0 4 8 12 16 20
When using Omega to rank solely on the likelihood of returns above and below the target return, non-directional strategies outperform opportunistic strategies at targets as high as 0.5% monthly. However, as outlined in Figure 7, if the monthly returns threshold is set at 2.0%, opportunistic strategies have a much higher probability of beating the threshold even though the probability of outperforming the threshold remains low.
The table in Figure 8 takes Omega one step further, using the Kappa statistic to rank the
strategies based on return at two distinct thresholds, but adjusted for risk—downside standard deviation, downside skew, and downside kurtosis (see the
Appendixfor Omega and Kappa equation details). For purposes of Kappa, the upper limit of 50 basis points was chosen to approximate an average target of 6% annually, while the lower limit of –50 basis points was chosen to help illustrate the impact of tight and non-normal distributions relative to the Omega rankings. By ranking the strategies based on the likelihood of meeting each threshold and accounting for downside volatility, we find that non-directional strategies have the best risk-adjusted performance at –0.5%, but also have the worst risk-adjusted performance at thresholds greater than 0.5%.
The rankings in the table confirm that measuring downside volatility is just as critical to the evaluation of hedge funds as measuring traditional mean return and standard deviation. The rankings further confirm the volatility differences between opportunistic and non-directional strategies illustrated in Figure 4a, and are consistent with the understanding that the tighter performance variation of non-directional strategies is the result of hedging market risk. By changing the return target by 1% (from –0.5% to 0.5%), non-directional strategies fall from the highest to the lowest rankings.
While this reversal is dramatic, this behavior is expected from strategies with returns tightly clustered around a mean. In other words, because of low volatility, deviations from the mean tend to be small in magnitude. As the return threshold approaches and surpasses the mean return, the probability of falling short of the threshold increases (and the probability of a monthly return exceeding the threshold decreases). If non-directional strategies have a low probability of exceeding 0.5% monthly, while opportunistic strategies have such large volatility that consistently beating 0.5% is unlikely, can hedge funds, on average, be relied upon to consistently generate annual absolute returns in the 6% to 8% range?
Finally, because Kappa measures the likelihood of deviations below the return threshold, the ranking changes suggest that incorporating downside risk is particularly important when evaluating hedge funds. As illustrated in Figure 7 by the fixed income arbitrage distribution, as the return threshold changes, large losses play a more important role in determining a “win,” or a return in excess of the required return. The impact of large losses is enhanced when the bulk of the return distribution is tight, as it is with convertible arbitrage and fixed income arbitrage. Opportunistic strategies, while still exposed to extreme returns, also experience larger standard deviation, helping to mitigate the relative impact of large one-time moves.
Given the qualitative understanding of the differences in hedge fund strategies and the quantitative evidence of each strategy’s return characteristics, the Omega and Kappa statistics provide useful strategy rankings for various return threshold goals within the framework of the strategies’ distributional and return characteristics.
A word on hedge fund diversification
In addition to risk and return statistics and the analysis of downside risk in particular, the covariance of a strategy with long-only equity returns should be considered. This can be accomplished by regressing the excess returns of hedge fund strategies against the excess return of the Dow Jones Wilshire 5000 Composite Index.8Figure 9 reports the regression
coefficients, or betas, to determine the strategies’ relationship to the overall market. If a hedge fund strategy was independent of the market, the coefficient would be zero. While non-directional strategies reported estimated betas close to zero, opportunistic strategies had non-zero estimated betas over the period measured, indicating these returns were not independent of equity market returns. It would be expected for those strategies with higher positive or negative coefficients to be
more aligned with the directional movements of the market, suggesting that hedge funds may post negative returns when market returns are negative and fail in their intent to hedge market risk. Compared with market-neutral funds, for example, long-short funds would be expected to have a greater preponderance of negative returns when the market is negative.
Because the coefficients are less than one, however, there will be, on average, some
diversification benefit from including hedge funds in a portfolio. Correlations (as presented in Table 5) further support the diversification claim.
But with hedge funds, estimated beta is often a poor indicator of future market risk exposures. Since there are no constraints on investment strategies, an estimated beta of zero over a single time period does not indicate that a fund will continue to be independent of market movements in the future. Similarly, correlations change over time, as evidenced by Figure 10. This figure presents rolling 12-month correlations of the three non-directional strategies (10a) and the six opportunistic strategies (10b) versus the Dow Jones Wilshire 5000.
8 Excess return is defined as the strategy or asset class return, less contemporaneous T-bill return. Figure 9. Beta versus Dow Jones Wilshire 5000 Composite Index
Equity market neutral Convertible arbitrage
Long-short equity Fixed income arbitrage
Emerging markets Dedicated short bias Global macro Managed futures Event driven Opportunistic Non-directional + + + + + + + +
+ : Statistically different from zero at 95% confidence.
Note: All regressions run from January 1994 to December 2005 using excess returns of style index and Dow Jones Wilshire 5000 over the Citigroup 1-Month Treasury Bill Index. The performance data shown represent past performance, which is not a guarantee of future results.
Sources: Thomson Datastream, Vanguard Investment Counseling & Research. Estimated beta
–1.0 –0.8 –0.6 –0.4 –0.2 0.0 0.2 0.4 0.6 0.8
Table 5. Static correlations to stocks
Equity market neutral 0.36
Convertible arbitrage 0.15
Fixed income arbitrage 0.05
Long-short equity 0.69
Emerging markets 0.53
Dedicated short bias –0.82
Global macro 0.25
Managed futures –0.15
Event driven 0.61
Note: Single correlation calculation, covering the period from January 1994 to December 2005, compared against the Dow Jones Wilshire 5000 Index.
The performance data shown represent past performance, which is not a guarantee of future results.
Correlations below 0.4 are shaded to represent periods of greater diversification benefits to an equity portfolio.
While correlations fell below 0.4 a majority of the time for non-directional strategies, significant periods of time existed when even non-directional strategies behaved very similarly to the equity market, in contrast to their market-neutral claims. As expected, correlations of opportunistic strategies were similarly dynamic, but fell below 0.4 less frequently. These strategies therefore offered less diversification benefit against equity market
movements. Correlations and beta estimates against the equity market, however, may also paint an incomplete picture. For example, strategies such as global macro, fixed income arbitrage, and managed futures should not have any relation to the equity market, even though the reported betas and
correlations over different time periods may suggest otherwise. These strategies use investments that
are not available in the equity market and would be expected to be completely independent from equity market movements.
Alternatively, the non-zero coefficient estimates and higher correlations could represent “beta bets,” or bets on the direction of the market. Moving with the market is not necessarily an undesirable characteristic for a hedge fund—if the move is a tactical decision. Long positions would increase in an undervalued market, while short positions would increase in an overvalued market. However,
disentangling an active bet on the direction of the market from inadvertent market risk exposure is difficult. Additionally, positions may not be limited to long and short equities. Derivatives and other nontraditional securities may be used to change exposures, capitalize on market movements, or mitigate risk, further complicating the evaluation of regression results.
Figure 10. Dynamic hedge fund correlations: Rolling 12-month correlations versus Dow Jones Wilshire 5000 Index
10b. Opportunistic strategies 10a. Non-directional strategies
Note: Data cover period from January 1994 to December 2005.
The performance data shown represent past performance, which is not a guarantee of future results.
Sources: Thomson Datastream, Vanguard Investment Counseling & Research.
Equity market neutral Convertible arbitrage Fixed income arbitrage –1.0 –0.8 –0.6 –0.4 –0.2 0.0 0.2 0.4 0.6 0.8 1.0 1995 1996 1997 1998 1999 2000 2001 2002 2003 2004 2005 Correlation Long-short equity Global macro Emerging markets Managed futures
Dedicated short bias Event driven –1.0 –0.8 –0.6 –0.4 –0.2 0.0 0.2 0.4 0.6 0.8 1.0 1995 1996 1997 1998 1999 2000 2001 2002 2003 2004 2005 Correlation
What do regression results tell us about hedge fund alpha?
Including an intercept in the regression permits a strategy’s alpha to be estimated. While Figure 11 supports the traditional belief that, in most cases, hedge funds have added alpha when measured against the Dow Jones Wilshire 5000, alpha should not be considered enduring. The realization of alpha going forward will be impacted by the growth of hedge fund assets, by managers, and by trading strategies. In aggregate, alpha, like return, is a zero-sum game: For every trade that adds alpha to an investment strategy, there must be a trade providing that alpha. While undoubtedly some hedge funds will continue to show skill at capturing market inefficiencies, with the number of hedge fund managers rapidly increasing, it is conceivable
that alpha is increasingly generated not from inefficiencies in the market, but rather inefficiencies among other hedge funds or trading strategies. In other words, as more funds ply similar strategies and trades, some managers will be successful at the expense of other managers.
In addition, regression results are strongly influenced by the characteristics of the underlying data. The reported alpha emerges from data that excludes failed firms and consists of self-reported returns. In practice, the realized alpha may well be considerably less, and much more volatile. Moreover, the intercept of a single-factor regression versus a broad investable index may not be the best measure of true manager skill, as hedge funds have risk characteristics in stark contrast from those of the broad stock market.
For example, consider global macro strategies. An index of currencies, futures, or swaps may simply have outperformed U.S. stocks over the period measured. As a result, the apparent alpha would then reflect the performance of the underlying securities rather than the manager’s skill. In another period of time, the results could be opposite.
In addition to index construction and return distribution characteristics, this analysis highlights other challenges when evaluating hedge fund strategies. Once again, regression analysis supports the view that non-directional strategies differ dramatically from opportunistic strategies,
particularly regarding independence relative to the market. However, investors also must keep in mind that these regression results represent average performance. Individual fund performance will diverge from index results. Actual hedge funds may contribute substantially more or less to a portfolio’s overall structure and performance than these regressions might suggest.
Figure 11. Hedge fund alpha
Equity market neutral Convertible arbitrage
Long-short equity Fixed income arbitrage
Emerging markets Dedicated short bias Global macro Managed futures Event driven Opportunistic Non-directional + + + + + + +
+ : Statistically different from zero at 95% confidence.
Note: All regressions run from January 1994 to December 2005 using excess returns of style index and Dow Jones Wilshire 5000 over the Citigroup 1-Month Treasury Bill Index. The performance data shown represent past performance, which is not a guarantee of future results.
Sources: Thomson Datastream, Vanguard Investment Counseling & Research. Estimated alpha
Implementation: Issues to keep in mind
In theory, hedge funds provide a diversification opportunity, coupled with the possibility of out-performance of traditional asset classes. Successful investing, however, requires effective managers. The selection process should thus focus on risk control and transparency, as well as relative performance and qualitative aspects such as integrity, reliability, and experience.
However, researching hedge fund managers is difficult. For example, transparency and regulatory issues complicate quantitative and qualitative evaluations. Furthermore, even if top-tier managers can be identified and trusted to provide accurate performance data, many are not accepting new investments, particularly by smaller investors, and if they are, minimum investments can range from $1 million to $5 million (Stemme and Slattery, 2002). A 10% allocation (commonly cited as the minimum to achieve any meaningful impact in a portfolio), therefore, would require at least a portfolio of $10 million to $50 million.
Practical issues can be further exacerbated by the costs of investing in hedge funds. In addition to unseen fund costs such as brokerage commissions and borrowing costs that will rise and fall alongside interest rates, investors are faced with high management fees (typically 1%–2%), performance fees, and additional costs. The performance fee is typically 20% of any gains, although it is often subject to “hurdle rates” (an absolute return that the fund must achieve, typically 5% per year) and “high watermarks.” These costs, which go directly to the fund manager, can mount quickly. According to Institutional Investor, in 2003 the average take-home earnings of the top 25 individual hedge fund managers topped $207 million (Taub, 2004). “Fund of fund” hedge funds may charge an additional 1% management fee and 10% of profits.
For many individual investors, an additional cost exists—taxes. Hedge funds are implicitly designed to capture short-term returns. Because they are structured as partnerships or limited liability companies, all gains and losses are passed through. These capital gains and losses are usually short-term and are taxed as such.
After accounting for these costs, the likelihood of outperforming traditional assets is reduced. Thus, when considering hedge funds, investors should not only weigh a fund’s anticipated extra return and diversification benefit over traditional investments, but also examine and project the fund’s returns after all costs.
Complicating evaluation further is the frequency with which extreme negative returns may occur. Understanding hedge fund risk exposures is not a simple task, and even sophisticated tools such as VaR provide an incomplete risk picture. Risk in capital markets is not static, with market and economic shocks occurring with regularity (e.g., in 1987, 1994, 1997, and 1998). In addition, hedge funds are highly dynamic, often changing in response to market conditions. The interaction of dynamic markets and dynamic strategies makes it very difficult to model expected performance and risk with any certainty.
Risk in hedge funds, however, is not limited to the traditional definition. In fact, hedge fund investors are exposed to many risks that can dramatically increase or change the notion of
traditional risk. First, there is the widely documented issue of lack of transparency, the result of limited hedge fund regulation. Unless contractually specified, there is no regulation requiring individual managers to report holdings or to remain within guidelines for leverage, illiquid securities, or high-risk trades.
Second, there is growing concern regarding the imbalance between supply and demand, fueled by the significant investment inflows into the hedge fund industry. If demand continues to outstrip supply, a sudden shift in the markets could theoretically cause capital to dry up (as investors sell) and force many, if not most, managers to liquidate positions at any cost to meet redemption requests. A scenario such as this would likely be exacerbated by leverage and could lead to insolvency for many funds. For example, a 10:1 leverage ratio would translate a 10% loss into a 100% loss. Such a “demand crash” and resulting fund failures could be perpetuated by many factors—including rapidly rising interest rates or similar (i.e., correlated) investment strategies across funds.
Third, the issue of contagion must be considered. Contagion is best described as the spread of market calamities from one country or market to another, observed through co-movements in exchange rates, financial instrument prices, and capital flows (Dornbusch, Park, and Claessens, 2000). Large market events often affect hedge funds to a greater degree because of their illiquid nature and typical leveraged positions. However contagion is propagated, investors in hedge funds must be aware that broad exposure may not shield them from its effects. For example, the Asian crisis in 1997 was followed by the Russian debt default in 1998, which in turn led to the collapse of many hedge funds relying on the capital markets. August 1997 and August 1998 saw two-thirds of all strategies realize substantially negative returns, as global events negatively affected all areas of the markets. The result is that, in
extreme markets, hedge fund diversification has failed when it was needed most.
Finally, with more funds being offered, there is a growing risk of funds simply shutting down. For example, research has shown that in 1994 the attrition rate stood at 3% (i.e., 3% of funds shut down). By the early to mid-2000s, the attrition rate had increased almost fourfold, to approximately 11% on average (Chan, Getmansky, Hass, and Lo, 2005). But even thriving funds are not necessarily accessible. Many are open for transactions infrequently (often on a quarterly basis), require long notice periods of pending transactions (often up to 30 days), and have long settlement periods for accepted transactions (again, often up to 30 days). This means that, should an investor wish to remove capital to prevent or mitigate large losses, he or she may be unable to do so.
Conclusion
While hedge funds were formed on a theoretically sound premise, there are vast differences among strategies. And though hedge fund investing may yield certain results within a mean-variance framework, an examination of downside risk clearly indicates that investors must choose carefully. On average, alpha and diversification arguments in favor of hedge funds also are not as strong as commonly believed. While there are sure to be managers and strategies that post positive returns with low correlation to traditional markets, successful hedge fund investing over the long term is dependent on selecting an effective manager in the right strategy. And while hedge funds may make sense for certain accredited investors, the combination of data issues, downside risk, and structural characteristics suggests that hedge funds, on average, may not offer the desired return and diversification goals.
References
Barclays Capital Inc., 2003. Observations on the Rapid Growth of the Hedge Fund Industry (Sponsored Section). Retrieved November 2004 from https://www.barcap.com/hedgefunds/ documents/infocus_observations.pdf.
Casey, Quirk & Acito and the Bank of New York, 2004. Institutional Demand for Hedge Funds: New Opportunities and New Standards. Retrieved November 2004 from http://www.bankofny.com/ pages/data/hedge_funds_whitepaper.pdf.
Chan, Nicholas, Mila Getmansky, Shane M. Haas, and Andrew W. Lo, 2005. Systemic Risk and Hedge Funds. Cambridge, Mass.: National Bureau of Economic Research. NBER Working Paper No. 11200.
Defusco, Richard A., Dennis W. McLeavey, Jerald E. Pinto, and David E. Runkle, 2001. Quantitative Methods for Investment Analysis. Charlottesville, Va.: Association for Investment Management and
Research. 664 p.
Dornbusch, Rudiger, Yung Chul Park, and Stijn Claessens, 2000. Contagion: Understanding How It Spreads. World Bank Research Observer 15:177 –97.
Goldman Sachs International and Russell Investment Group, 2003. Report on Alternative Investing by Tax-Exempt Organizations 2003: A Survey of Organizations in North America, Europe, Australia, and Japan. Retrieved November 2004 from
http://www.gs.com/insight/research/reports/ 2003_Goldman_Russell_Survey.pdf.
Hedge Fund Research, Inc., 2005. Year End 2005 HFR Industry Report. Chicago, I11.: Hedge Fund Research.
Kaplan, Paul D., and James A. Knowles, 2004. Kappa: A Generalized Downside Risk-Adjusted Performance Measure. Journal of Performance Measurement 8(3):[no pages].
Keating, Con, and William F. Shadwick, 2002. A Universal Performance Measure. Journal of Performance Measurement 6(3):[no pages]. Stemme, Ken, and Paul Slattery, 2002. Hedge Fund Investments: Do It Yourself or Hire a Contractor? In Hedge Fund Strategies: A Global Outlook, B.R. Bruce (ed.). New York: Institutional Investor. p. 60-8. Investment Guides Series.
Taub, Stephen, 2004. The Bucks Stop Here. Institutional Investor (August):47–56.
Appendix
Risk-adjusted performance measures explained
The Sharpe ratio is calculated using standard deviation in the denominator and does not distinguish between volatility above and below the mean. The denominator of Kappa (see page 12), however, calculates the probability of a given deviation below an identified threshold. It is based on a cumulative distribution where each outcome is weighted by the likelihood of that outcome occurring. Since the ratio assumes no particular return distribution, the probability of extreme values is factored into the comparison.
Mathematically, Kappa = where:
τequals the minimum acceptable return threshold. n equals the distribution moment.
μequals the expected periodic return, . R equals the actual return.
d F(R) equals the probability of R.
LPMn(τ) equals the lower partial moment function, .
This allows hedge fund strategies to be evaluated and ranked based on the degree to which they are affected by higher moments of the return distribution relative to a targeted return level.
Two alternatives to Kappa—Omega and Sortino—have also recently gained traction in the move to accurately quantify downside risk, particularly with hedge funds.
The Omega function calculates the probability of a “win” relative to the probability for a “loss” at a return level.
Mathematically, Omega = , where:
[1–F(R)]d R equals the probability-weighted gain. F(R)d R equals the probability-weighted loss.
In other words, if the investor targets 0.5% as the desired return level, the Omega function ranks funds based on the “win” to “loss” ratio, with the highest-ranked funds posting the highest probability of winning versus losing at that return level.
The Sortino ratio measures returns in excess of a targeted return relative to volatility below the return target.
Mathematically, Sortino = .
The Sortino ratio differs from Kappa in that the Sortino ratio only accounts for the “second moment,” or standard deviation of returns. However, because the Sortino ratio specifically focuses on downside risk, it is superior to the Sharpe ratio when used to evaluate distributions with significant downside risk potential.
Interestingly, Kaplan and Knowles prove that both Omega and Sortino are direct derivations of Kappa. In a Kappa framework, the Omega function can be thought of as analysis of the first moment (mean) downside risk, while the Sortino ratio measures the second moment (variance) downside risk. Because Kappa allows any downside moment to be incorporated in the denominator of the function (i.e., the n variable), Kappa can also be expanded to include third (skew) and fourth (kurtosis) downside moment risks.
P.O. Box 2600
Valley Forge, PA 19482-2600
Connect with Vanguard
™>
www.vanguard.com
Vanguard Investment Counseling & Research Ellen Rinaldi, J.D., LL.M./Principal/Department Head Joseph H. Davis, Ph.D./Principal
Francis M. Kinniry Jr., CFA/Principal Daniel W. Wallick/Principal Nelson W. Wicas, Ph.D./Principal Frank J. Ambrosio, CFA John Ameriks, Ph.D. Donald G. Bennyhoff Maria Bruno, CFP®
Scott J. Donaldson, CFA, CFP Michael Hess
Julian Jackson
Colleen M. Jaconetti, CFP, CPA Kushal Kshirsagar, Ph.D. Christopher B. Philips Glenn Sheay, CFA Kimberly A. Stockton Yesim Tokat, Ph.D. David J. Walker, CFA For more information about Vanguard funds,
visit www.vanguard.com, or call 800-662-2739, to obtain a prospectus. Investment objectives, risks, charges, expenses, and other important information about a fund are contained in the prospectus; read and consider it carefully before investing.
Connect with Vanguard, Vanguard, and the ship logo are trademarks of The Vanguard Group, Inc. All other marks are the exclusive property of their respective owners.