Equity and Debt Issuance by Firms Violating GAAP
Abstract
We examine security issuance in restated periods by firms that misreport financial statements and find that only a small percent of such firms issues securities in the restated period. Investors are misled by mistakes made by firms issuing equity more so than other restating firms at the initial announcement of misreported earnings, but are not misled by mistakes made by debt-issuing firms. Equity-issuing firms that manage earnings to beat analyst expectations experience abnormally high returns in the restated period prior to security issuance. Firms that restated more reports and have higher pre-mistake returns are more likely to issue equity. High leverage, firm size and number of restated periods are positively associated with the likelihood of debt issuance by restating firms.
1. Introduction
We study equity and debt issuance in restated periods by firms that violate Generally Accepted Accounting Principals (GAAP).1 Prior literature suggests that one of the reasons firms violate GAAP is to reduce the cost of security issuance (Dechow, Sloan, and Sweeny (1996), Richardson, Tuna and Wu (2003), Burns and Kedia (2006), Efendi, Srivastava and Swanson (2006)). These studies find that firms that restate financial statements or are subject to Securities and Exchange Commission (SEC) enforcement actions for financial reporting violations (AAERs) raise more capital than control firms during violation periods. They also find that security issuance in the violation period increases the likelihood of a restatement or an AAER. They interpret these results as evidence that firms manage earnings to issue securities at better prices.
However, these results are weak evidence to suggest that restating firms violate GAAP in order to issue securities at inflated prices. For example, it is plausible that when equity and debt issuance is motivated by other considerations, it results in higher scrutiny of the firm’s accounting by managers, auditors, the SEC and other market participants and thus increases the likelihood of a restatement or an AAER. Another explanation for high security issuance in the restated period is the successful market timing by management. Above mentioned studies also find that firms restating financial statements experience abnormally high performance prior to the first restated year. Therefore, abnormally high firm performance prior to misreporting can be driving both security issuance and the likelihood of misreporting. In fact, Efendi, Srivastava and Swanson (2006) find that security issuance does not explain the likelihood of a restatement when
1 Restated period is defined as the period between the beginning of the first restated year or quarter and the
the pre-misstatement price run up is included as an explanatory variable. This result is consistent with Jensen’s (2005) theory of overvalued equity which suggests that overpricing leads to value destructive behavior, such as earnings management. Furthermore, none of these papers test whether erroneous accounting prior to security issuance is associated with misvaluation in the restated period.
The main contribution of this paper is that it goes beyond the analysis of the frequency of security issuance in the restated period and tests whether restating firms experience abnormally high performance in the period after GAAP violation but before security issuance, and whether this performance is related to the magnitude of accounting misrepresentation relative to expectations. This paper is also the first to examine which restating firms are more likely to issue equity and debt.
We analyze 446 US firms that restated financial statements due to violations of GAAP during the period from January 1, 1996 to June 30, 2002. A sample of restating firms provides a unique setting for studying the impact of the quality of financial information on security issuance because ex post one observes the date and the nature of mistakes in financial statements and the date of the correction of thosemistakes. We read restatement announcements to determine which financial reports were restated and the impact of restatement on net income. Our research design allows us to directly test whether overstatement of reported earnings is associated with investors over optimism about firm prospects prior to equity and debt issuance. Unlike prior studies that examined security issuance by restating firms (Burns and Kedia (2006), Efendi, Srivastava and Swanson (2006)), we focus on actual security issuance rather than balance sheet proxies.
We find that only a small percent of restating firms issues securities in the restated period: 15% of restating firms issue equity and 6% issue debt in the restated period, compared with 9% of control firms issuing equity and 4% issuing debt.2 The difference between the frequencies of security issuance is statistically significant. Although the percent of restating firms issuing securities is higher than the percent of control firms issuing securities, the number of issuances in the restated period is small to argue that security issuance is the dominant reason for violating GAAP - only 20% of firms issue either equity or debt. Therefore, 80% of restating firms were not motivated by security issuance to violate GAAP. Moreover, not all restating firms that issue equity manage earnings upward. Nineteen percent of equity issuing firms and twenty one percent of debt issuing firms understate net income prior to the issuance. If the firm understates net income prior to security issuance, it will not obtain financing at more favorable terms. Therefore, security issuance could not be a rational motivation for downward earnings management. Overall, the results suggest that there is no strong connection between the act of restatement and security issuance.
If some firms violate GAAP to reduce financing costs, then we should observe positive association between abnormal return at the announcement of earnings and the mistake, adjusted for expected earnings. We test this proposition by examining whether investors are misled by mistakes in reported earnings prior to equity and debt issuance. Following Bardos, Golec and Harding (2011) we decompose reported earnings into correctly stated component and mistake and examine abnormal returns at the initial
2 Control firms are found among all firms that did not restate their earnings during the period January 1,
1995 to June 30, 2002 in the same two digit SIC code as restating firms that are the closest in size (market value) and book-to-market, measured one fiscal year prior to the announcement of restatement, and have sufficient data to calculate returns one year prior to mistake and one year subsequent to restatement.
earnings as a function of these numbers relative to expectations. Expectations are measured as consensus analyst forecasts. We find that investors attach the same valuation coefficient to the erroneous component of earnings as they do to the true earnings. Investors are more misled by mistakes made by equity issuing firms prior to the issuance, but are not misled by mistakes prior to debt issuance. For equity-issuing firms that manage earnings to beat analyst expectations abnormal returns persist beyond announcement window – such firms experience abnormally high returns in the restated period prior to security issuance. Interestingly, for equity issuing firms there is little evidence of abnormal performance before the mistakes are made, which suggests that the abnormal performance prior to equity issuance is caused by earnings management. Overall our results suggest that a small number of firms that violate GAAP and subsequently issue equity mislead investors.
We also examine which types of firms in the cross-section are most likely to use earnings management to issue equity and debt. We find that restating firms that issue equity are larger in market value terms than non-issuing firms, have higher pre-mistake return, make smaller downward revisions of net income and restate more reports. Restating firms that issue debt are considerably larger, more highly levered, and make smaller downward revisions of net income than non-issuing firms and firms issuing equity. Restating firms that issue debt restate more reports than non-issuing firms, but not firms issuing equity.
This paper contributes to the literature in several ways. First, it is the first paper to examine whether firm performance is abnormal subsequent to GAAP violations before equity and debt issuances and whether such performance is associated with the magnitude
of the restatement. Prior literature assumed that if the firm issues securities in the restated period, the issuance follows the period of abnormal performance induced by earnings management (Burns and Kedia (2006), Efendi, Srivastava and Swanson (2006), Dechow, Sloan and Sweeney (1996)). This paper provides a direct test of this claim. Because the adverse impact of restatements on shareholder wealth at restatement announcement has been used to motivate a number of regulations, including some provisions in the Sarbanes Oxley Act of 2002 (Palmrose, Richardson and Scholz (2004)), Agrawal and Chadha (2005)), it is important to understand the full impact of restatements on financial markets. Second, this is the first paper to document the frequency of equity and debt issuance in the restated period and examine characteristics of restating firms issuing securities. The results of this paper complement the growing stream of literature studying the causes and consequences of financial misreporting, and show that contrary to prior beliefs, security issuance at inflated prices by restating firms is not prevalent.
Moreover, this paper provides a test of the earnings management hypothesis posed by Teoh, Welch and Wong (1998b) for firms violating GAAP. The earnings management hypothesis suggests that firms pursue aggressive accounting practices prior to equity issuance. Such practices mislead investors and cause them to overvalue security issuance. However, as the true value of earnings is revealed, investors devalue firms that manage earnings. To test the earnings management hypothesis, Teoh, Welch and Wong (1998b) used abnormal accruals prior to equity issuance as a proxy for earnings management.3 However, Dechow, Sloan and Sweeney (1995), Shivakumar (2000), and
3 A finding that is common to studies that examine earnings management prior to seasoned equity offerings
(SEOs), convertible debt issuance, initial public offerings (IPOs) or stock-financed acquisitions is that firms that engage in such activities on average contain positive abnormal accrual components prior to the event, that the accruals are negatively related to post-event stock returns, and that accruals tend to reverse during
Kothari, Leone and Wasley (2005) among others show that abnormal accruals is a poor measure of earnings management prior to security issuance.4 The advantage of testing the earnings management hypothesis using a sample of restatements is that ex post one observes the details of accounting misreporting. However, accrual management is a more common practice, which does not impose the large costs of financial misrepresentation that are associated with restatements. Therefore, while this study extends the prior literature that tested the earnings management hypothesis using accruals, its results are not directly comparable to that stream of literature.
The paper proceeds as follows. Section 2 discusses the related literature and outlines hypotheses tested in this paper. Section 3 describes the data. Section 4 presents results and Section 5 concludes.
2. Related literature and hypotheses
A firm is required to file a prior period adjustment of financial statements whenever it discovers material discrepancies in previously filed financial statements. Restatements result in significant negative market reaction (Akhigbe, Kudla and Madura (2005) and Palmrose, Richardson and Scholz (2004)) that is spilled over to firms in the same industry (Akhigbe and Madura (2008)). Markets anticipate financial statement
the post-event period (Teoh, Welch, and Wong (1998a, b) and Rangan (1998), Friedlan (1994), DuCharme, Malatesta, and Sefcik (2001)), Erickson and Wang (1998), Christie and Zimmerman (1994), and Urcan and Kieschnick (2006)).
4 Shivakumar (2000) points out four problems with using discretionary accruals as a proxy for earnings
management around large events such as SEOs, IPOs, and mergers. First, such events are frequently associated with unusually large changes to working capital, independent of any earnings management. Second, many studies estimate accruals from balance sheet changes in working capital, not by taking them from cash flow statements. Third, accrual models commonly used to estimate earnings management are mis-specified. Fourth, such events frequently involve substantial expenses that might be unpaid prior to the event and hence are accrued at the balance date, resembling income increasing discretionary accruals.
restatements as early as half way through the restated period (Bardos, Golec, Harding (2011)). Restatements lead to an increase in a firm’s cost of capital (Hribar and Jenkins (2004), Bardos, Cline and Koutmos (2011), and Graham, Li, and Qiu (2008), Bardos (2011)), and increase the likelihood of litigations (Palmrose and Scholz (2004), Bradley, Cline and Lian (2010)).
Richardson, Tuna and Wu (2003) find that 452 firms restating during the 1988-2000 period attracted more external capital than non-restating firms in the period of alleged manipulation. They compare the standardized sum of additional cash raised from common and preferred stock and long-term debt for restating versus non-restating firms matched by industry and size during the period of alleged manipulation. Burns and Kedia (2007) analyze a sample of 215 firms restating over a period from 1995 through 2002. They find some evidence that restating firms raise more funds in misreported years than non-restating S&P 1,500 firms in univariate, but not in multivariate settings. Efendi, Srivastava and Swanson (2006) find that firms making restatements in 2001 and 2002 raise more funds in the first misstated year than control firms matched on size and book-to-market.5 The paper does not examine security issuance beyond the first misstated year.
These studies interpreted the result that restating firms issue more external funds than control samples as evidence in favor of the earnings management hypothesis, i.e., firms manage earnings to issue securities at more favorable prices. There are several problems with such inference. First, there are other potential explanations for the
5 In a related paper, Dechow, Sloan and Sweeney (1996) studied 92 firms that were subject to SEC
enforcement actions for financial reporting violations (AAERs) between 1978 and 1990. They report that the main motivation as cited by the SEC for earnings management was to issue securities at inflated prices. They also find that the AAER sample raises more external funds than control sample. The paper did not investigate whether or not funds were issued at a lower cost than they would have been in the absence of earnings management.
observed result. It has been shown by the same studies that misstatements follow periods of stock price run-up. Therefore, a higher number of issuances by restating firms in a restated period can simply be the result of a manager’s ability to time the market. Indeed many studies find that firms issue equity when their shares are overpriced (Jung, Kim and Stulz (1996), Hovakimian, Opler, and Titman (2001), (Dittmar and Thakor (2007), Asquith and Mullins (1986), Baker and Wurgler (2002), and Burch, Christie, and Nanda (2004)). Another plausible explanation for this result is that firms that issue securities are more likely to restate as they face greater scrutiny by the SEC, auditors and investors than non-issuing firms. Third, these papers did not test whether erroneous reporting that leads to restatements inflates security prices prior to security issuance and therefore allows management to issue securities at more favorable prices.
This paper contributes to the literature by analyzing whether material mistakes in financial statements allow restating firms to reduce financing costs. We study a sample of firms that restated financial statements during 1997-2002. For these firms we can ex post
identify financial reports which contained mistakes as well as the size of the mistakes (see Figure 1). We can also determine if the firms issued securities in the restated period.
Equity or Debt issuance date Mistake Restatement Pre-mistake period -b +a Post-restatement period Restatement Announcement date Beginning of the 1st restated period Restated period Issuance Time
Figure 1: Mistake is the beginning of the first restated period, Issuance is the date of equity or debt issuance, Restatement is the date of the restatement announcement, -b and +a are time periods of interest.
If security issuance at favorable prices is one of the main motivations for misreporting earnings as suggested by prior studies, then one should observe a higher frequency of security issuance by restating firms relative to control firms in the restated period. This leads to our first hypothesis:
H1: Restating firms issue more equity and debt than control firms.
We examine the number of equity and debt issuances in the restated period relative to a sample of control firms. Unlike prior studies that use the sum of funds raised through equity and debt obtained from Compustat, we use security issuance data from Securities Data Corporation, which allows us to determine the precise timing of the issuance.
As noted earlier, even if hypothesis 1 is supported, this would not imply that material mistakes in financial statements reduced financing costs of restating firms. The likelihood of security issuance and the likelihood of restatement can be driven by the same variable, such as overvaluation in the pre-mistake period. Security issuance in the restated period can increase the likelihood of restatement due to additional scrutiny of financial statements by management, auditors, regulators and other market participants.
To test whether misreporting allows restating firms to issue securities at more favorable prices, we examine whether material mistakes of issuing firms result in misvaluation. If investors are misled by material mistakes in reported earnings then they would price the error component of earnings the same way as they price the true earnings. For example, if the error puts the firm in line with expectations, then there should be no abnormal performance at the announcement of earnings. Similarly, if overstated earnings
cause the firm to beat expectations that may generate positive abnormal performance. Most of the action will take place at the announcement of earnings.
A well established result in the literature is that earnings announcement returns are positively related to unexpected earnings (Ball and Brown (1968), Collins and Kothari (1989)). Abnormal return at the earnings announcement at time t is a function of the difference between reported earnings and expected earnings . The difference between reported and expected earnings
t R t I Et-1(It) ) (I E
It− t-1 t has been termed standardized earnings surprise SUE:
t t t t-t t α b(I E (I )) ε α b ε R = + 1 − 1 + = + 1SUEt + , (1)
The coefficient b1 is called the earnings response coefficient (ERC).
Bardos, Golec and Harding (2011) study whether investors are misled by misstated earnings by estimating whether investors attach the same earnings response coefficient to the misstated earnings as they do to the true component of earnings. Specifically, they estimate the following equation:
t t t t t t t-t t α b(I E (I )) b M ε α b b ε R = + 1 − 1 + 2 + = + 1SUE + 2MISTAKE + , (2) where Mt (MISTAKE) is the amount by which earnings are misstated, is market adjusted return for a 3 day window (-1; +1) relative to the earnings announcement on day zero. They find that coefficient is positive and equal to , suggesting that investors are fooled by mistakes in financial statements and treat misstated component of earnings the same way that they treat the correctly stated component.
t R
2
If firms violate GAAP to reduce financing costs, then we should observe positive association between abnormal return at the announcement of earnings and the mistake, adjusted for expected earnings.
H2: There is a positive association between abnormal earnings announcement returns and mistake in reported earnings for firms issuing equity and debt.
To test hypothesis 2, we estimate the following two models:
, (3) t t t t t t t t t ε b b b b b α R + + + + + + = MISTAKE * Equity SUE * Equity Equity MISTAKE SUE 5 4 3 2 1 , (4) t t t t t t t t t ε b b b b b α R + + + + + + = MISTAKE * Debt SUE * Debt Debt MISTAKE SUE 5 4 3 2 1
Equity (Debt) is a dummy that equals one for quarters in the restated period preceding equity (debt) issuance. For example, if a firm restated financial statements for 1999 and 2000 fiscal years and issued equity in November of 1999, then Equity will equal one for the first three quarters of 1999 (provided that the 3rd quarter is announced prior to equity issuance announcement).
If investors are misled by mistakes in financial reports of equity and debt issuing firms, then b2 +b5 >0 and b2 +b5 =b1+b4. If investors are only partly fooled, then . We estimate equations (3) and (4) using OLS regression. For each firm, we include all quarters in the restated period – in this period MISTAKE is non zero. To provide a benchmark for the estimation in the restated period, for each firm we include quarters for two years preceding the restated period and cluster errors by firm. As a result, usual performance of the firm in pre-restatement period is used as its own control. Clustering standard errors by firm also corrects for cross-sectional and time-series dependence (Petersen (2009)).
4 1 b b + 5 2 b b + <
If the issuing firms manage earnings to beat expectations (MISTAKE>SUE) and if investors are fooled by the mistakes (hypothesis 2 holds) the misvaluation might persist over the longer time period. Firms that beat expectations by a greater amount should experience greater misvaluation. Issuing firms, whose earnings management merely puts them in line with expectations, will simply experience normal performance over an extended period.
H3: If SUE<0 and MISTAKE>SUE, issuing firms will experience abnormal performance in the restated period before security issuance.
To test hypothesis 3 we examine abnormal returns in the restated period until security issuance (period (Mistake, Issuance)) relative to several benchmarks: usual performance of the firm itself, control firm and the market.6
Lastly, we examine which types of firms in the cross-section are most likely to use earnings management to issue equity and debt. We also study whether there is a difference in earnings management between debt versus equity issuance. As discussed in the introduction and the result section, only a small percent of restating firms issue equity and debt. Because of the small sample size, we focus only on a few key characteristics to preserve the degrees of freedom in multivariate analysis.
An established result in the literature is that firms issue equity after periods of run-up in stock prices (Baker and Wurgler (2002)). Prior literature has also shown that restating firms make mistakes in financial statements following periods of abnormally high performance (Burns and Kedia (2007), Efendi, Srivastava and Swanson (2006)). Therefore, we should expect firms with better pre-mistake performance to be more likely to issue equity than debt.
H4: Firms with better pre-mistake performance are more likely to issue equity.
Several studies find that firms close to violating lending covenants manage earnings (Sweeney (1994), DeFond and Jiambalvo (1994)), and Dechow et al. (1996)). These studies suggest that avoidance of penalties associated with the violations of debt covenants is a motivation to manage earnings. A firm would manage earnings to issue new debt if earnings management allows the firm to obtain debt at more favorable terms. A firm that meets restrictive covenants can obtain more favorable financing. Prior studies use leverage as a proxy for the pressure firms feel to manage earnings (Richardson et al (2002), Burns and Kedia (2007)).
H5: Firms with higher leverage are more likely to issue debt.
We examine whether firms that issue equity and debt differ from non issuing firms in terms of restatement characteristics. If issuing firms make larger mistakes, this would suggest that they have a longer distance to their earnings threshold. Issuing firms are more likely to have longer restated period because the likelihood of any event is greater during a longer time period. We also control for firm size in multivariate analysis.
3. Data
We collected a sample of US firms that announced restatements of financial statements between January 1997 and June 2002. We searched Lexis-Nexis database using key words “restatement”, “restat”, “revis”, “adjust”, “error” and “responding to guidance from the SEC”. We crossed checked search results with the sample released by the Government Accountability Office (GAO). Unlike the GAO sample, we excluded restatements that were caused by an adoption of new accounting rules, and retained only restatements due to a mistake or an improper interpretation of GAAP rules. After
identifying the sample of companies announcing restatements, we searched for the originally filed and restated financial statements on Lexis-Nexis (Forms 10-K/A(s) and Forms 10-Q/A(s)). The following data was collected from restatement announcements and original and restated financial statements: date of the announcement of restatement, years and quarters restated, original and restated net income.
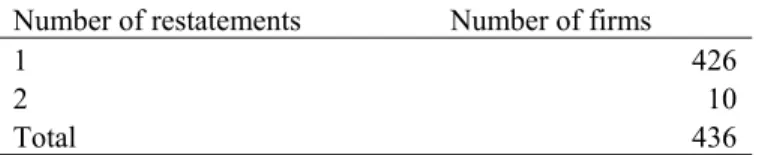
The search resulted in 536 restatements made by 496 firms. We imposed several other filters. Some firms restated more than once during the sample period. In several cases restated periods of multiple restatements by the same firm overlapped. To avoid double counting security issuance, we deleted 29 restatements that had overlapping restated periods. The later of the two restatements with overlapping restated periods was deleted. Second, we deleted 20 restatements for which the impact on net income was zero or could not be identified. Third, we deleted 6 Real Estate Investment Trusts (REITs). Because REITs are required to pay out 90% of their reported net income in dividends, they may have different considerations when deciding whether to issue equity or debt. Fourth, 35 observations were lost because these firms did not have data in Compustat to find a matching firm. The final sample consists of 446 restatements by 436 firms. Ten firms restated financial statements twice during the restated period (Table 1, Panel A). Return data is from CRSP. Financial data was obtained from Compustat. Information on equity and debt issuance is taken from the Securities Data Corporation database (SDC Platinum).
4. Results
4.1. Descriptive Statistics
Table 1, Panel B shows the distribution of restatements by year, which is similar to that of prior studies. There was an increase in restatements in 1999 and 2000. Note that 2002 restatements were collected only through July. As a result, all restatements in the sample precede the enactment of the Sarbanes Oxley Act and are made in a common regulatory environment. Table 1, Panel C shows distribution of restatement characteristics. An average firm restates 1.34 annual reports. Table 1, Panel C also shows the distribution of the magnitude of the mistake, which is measured as the difference between restated net income and originally reported net income, standardized by the absolute value of the originally reported net income (ΔNI/abs(OriginalNI)). This measure is heavily skewed, with the mean falling below the first quartile. The median reduction of previously reported net income is -23% for the full sample. Table 1, Panel C also shows the distribution of the ΔNI/Assets, which is the difference between restated net income and originally reported net income, standardized by book value of total assets measured one year prior to restatement announcement. This measure of mistake shows similar pattern as does ΔNI/abs(OriginalNI). However, ΔNI/Assets is considerably less skewed. Therefore, we rely more on the tests using ΔNI/Assets. Table 1, Panel D shows that the majority of restating firms revise net income downward at restatement announcement (downward restatements). Only 13.7% of our sample revises net income upward at restatement announcement (upward restatements). Panel E shows that downward restatements are of greater magnitude than upward restatements.
Table 2, Panel A shows selected characteristics of restating firms one fiscal year prior to the announcement of restatement. The mean (median) market value of restating firms is $2,259 million ($183 million). The mean (median) book value of restating firms is $2,375 million ($223 million). The mean leverage is 18.45% and the mean book-to-market ratio is 0.63.
Table 2, Panel B shows the characteristics of control firms in the year in which the matching is performed (one year prior to the restatement announcement). Control firms are found among all firms that did not restate their earnings during the period January 1, 1996 to June 30, 2002 in the same two digit SIC code as restating firm, that are the closest in size and book-to-market and have sufficient data to calculate returns one year prior to mistake and one year subsequent to restatement. Market value and book-to-market ratios of restating firms are measured one fiscal year prior to the announcement of restatement.
Table 2, Panel C compares characteristics of restating and control firms using 2-tailed Wilcoxon signed ranks test. The samples do not differ in terms of size and book-to-market, which indicates a successful match. They also do not differ in terms of the book value of assets. Restating firms are more highly levered than control firms. On average, restating firms have a capital structure that has 2% more debt.
[Insert Table 2 about here]
4.2. Equity and debt issuance
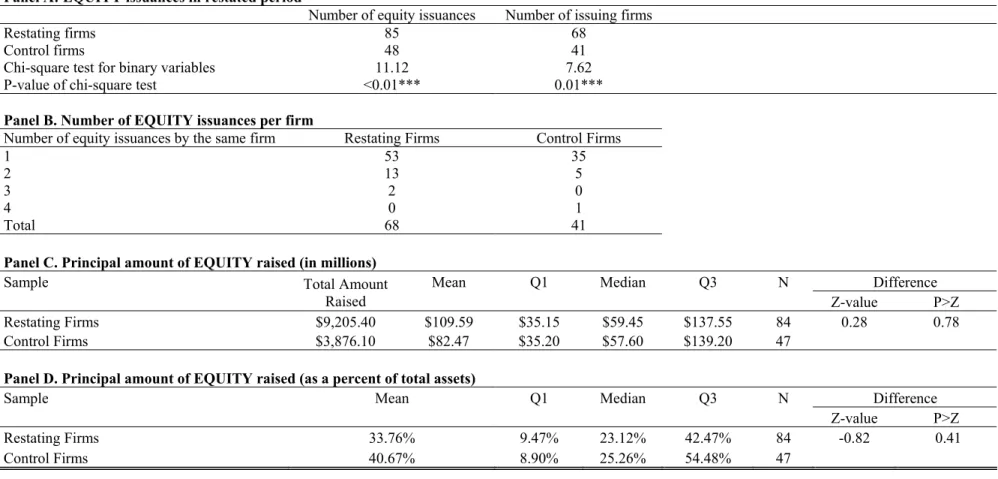
Results presented in Table 3 and Table 4 show that restating firms issue more equity and debt in the restated period than non-restating firms. Table 3, Panel A shows frequency of equity issuance by restating and control firms in the restated period.
Restated period is defined as the period between the beginning of the period of the first mistake (year or quarter) and the restatement announcement. There are 85 equity issuances made by 68 restating firms. The number of equity issuances by restating firms is surprisingly low. Only fifteen percent of restatements have equity issuance in restated period. Control firms issue less equity. Forty one control firms issue equity in 48 matched restated periods. This supports hypothesis 1 and suggests that equity issuance serves as a motivation for some restating firms.
The majority of restating and control firms issue equity only once (78% of restating firms and 85% of the control firms). Thirteen of restating firms and five of control firms issue equity twice, two of restating firms issue equity three times and one of control firms issues equity four times (Table 3, Panel B). Restating firms raise more equity per issuance: $110 million versus $82 million per control firm, however the difference is not statistically significant. Both restating and control firms raise non-trivial amounts of equity as a percent of total assets: 33.74% and 40.67% for restating firms and control firms, respectively.
[Insert Table 3 about here]
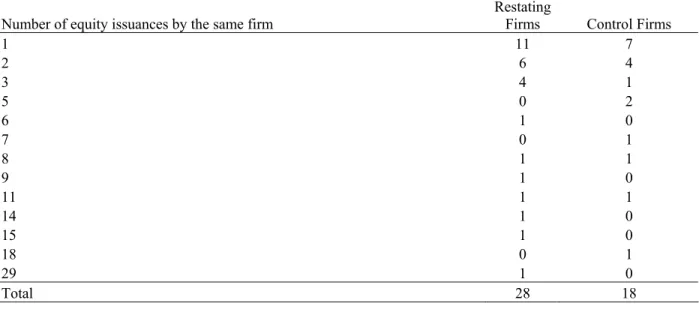
Table 4 shows the same statistics for debt issuance in the restated period.7 We find that while fewer restating firms issue debt than equity in the restated period (6.28%), many firms raise debt more than once in restated period and raise more funds per issuance. Similar pattern is seen for control firms. There are more debt issuances in restated period by restating firms than control firms. However, the difference in the
7 Number of debt issuances figures in Table 4 combine straight and convertible debt issuance. Statistics for
the two types of issuances are combined because of very small number of convertible debt issuances. There are four convertible debt issuances by restating firms and three by control firms. Small number of observations does not allow further statistics analysis of convertible debt issuance. All results are unaffected by exclusion of convertible debt issuances.
number of firms raising debt between restating and control sub-samples is not statistically significant (28 restating firms versus 18 control firms). Therefore, hypothesis 1 is not supported for debt issuance. Moreover, control firms raise more per issuance: the mean issuance size is $167.96 million (1.91% of total assets) for restating firms and $216.56 million (2.88% of total assets) for control firms. This difference is statistically significant.
[Insert Table 4 about here]
Interestingly, not all restating firms that issue equity manage earnings upward. We find that 13 out of 68 restating firms that issued equity in the restated period understated net income; and 6 out of 28 debt issuing firms understated net income. We call firms that understated net income and as a result had to revise net income upward as
upward restatements. If the firm understates net income prior to security issuance, it will not obtain financing at more favorable terms. Therefore, security issuance could not be a rational reason for downward earnings management. We focus our analysis on 55 equity issuing and 22 debt issuing firms that restate net income downward (downward restatements).
4.3. Market reaction to initial announcement of misstated earnings
In this section we test hypothesis 2 by analyzing market reaction to the initial announcement of misstated earnings. We calculate SUE as standardized earnings surprise based on Street earnings reported in I/B/E/S because Bradshaw and Sloan (2002) find that Street earnings are more directly comparable with analysts’ forecasts. As a result, earnings surprise is more precisely measured using Street earnings. We follow Bardos, Golec and Harding (2011) in calculating correctly stated earnings. SUE is the difference
between correctly stated earnings and consensus analyst forecasts. The consensus analyst forecast is calculated as the median of forecasts reported to I/B/E/S in the 90 days prior to the earnings announcement, considering only the most recent forecast for each analyst. SUE and Mistake are standardized by the stock price. Earnings announcement dates are obtained from I/B/E/S. We are able to identify sufficient data for estimating equations (1)-(4) for 1,843 quarters corresponding to 226 firms. Of these firms, only 22 issued equity and 13 issued debt in the restated period. is calculated as market adjusted return using equally weighted CRSP market index as a proxy for the market return.
t R
8
Table 5, Panels A and D show descriptive statistics for , SUE and Mistake for various sub-samples. For the full sample, both the mean and the median is positive and equals .12% and .45%, respectively. SUE is negative, with the mean of -0.0042 and Mistake is positive with the mean of 0.0026. We show separate table for the restated period sample, during which Mistake is not equal zero. Interestingly, for this sub-sample both mean and median is negative and equals -1.02% and -.13%, respectively. The median Mistake almost exactly offsets the negative median SUE, suggesting that firms manage earnings to simply meet (rather than beat) expectations. Panels C and D show descriptive statistics for equity issuing and debt issuing firms for the restated period quarters. Both Mistake and SUE are larger for equity sub-sample. For debt issuing firms mean and median mistake does not put the firms in line with expectation since SUE is negative and in absolute terms larger than Mistake.
t R t R t R
[Insert Table 5 about here]
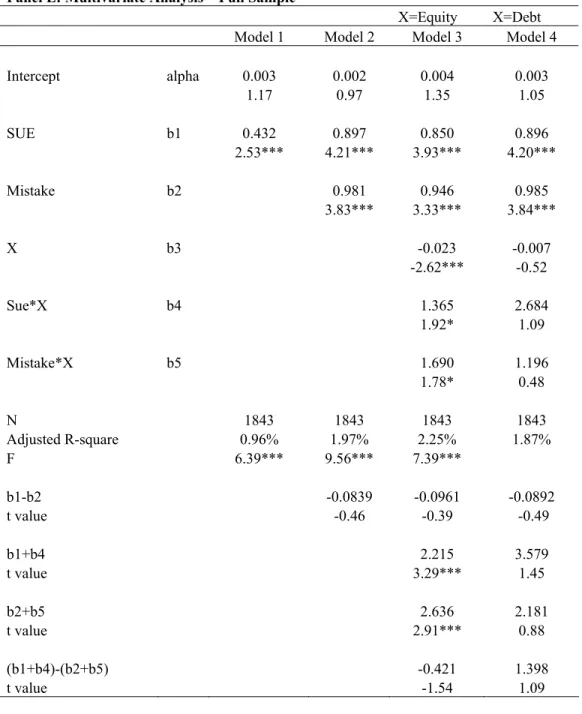
Table 5 Panel E shows regression results for the full sample. Model 1 estimates equation (1) and is consistent with prior literature. It finds that abnormal returns at earnings announcement are a positive function of earnings surprise. Model (2) estimates equation (2) and confirms results in Bardos, Golec and Harding (2011) that investors attach positive valuation to the erroneous component of earnings and value them the same way as correctly stated earnings (as suggested by positive b2 which equals b1).
We test hypothesis 2 by estimating Models 3 and 4 (Table 5, Panel E). Model 3 estimates equation (3), which shifts all coefficients for equity issuing firms. We find that the dummy coefficient Equity is negative and significant, suggesting that overall is lower than for the rest of the sample. This result is consistent with univariate statistics - is lower in Panel C than in Panels A and B. For equity issuing firms, the total coefficient on SUE and Mistake
t R
t R
)
(b1+b4 (b2 +b5)are positive and significant. As for the full sample, these two coefficients are equal each other for equity issuing firms. Significance of the coefficient on Mistake for equity issuing firms indicates that investors are misled by mistakes of such firms. Interestingly, we find that coefficient on the interaction of SUE and Equity dummy is positive and significant. This shows that investors react more strongly to surprises in correctly stated component of earnings of equity issuing firms. This result suggests that equity issuing firms are overvalued. Similarly, we find that the coefficient on the interaction of Mistake and Equity dummy is positive and significant, suggesting that investors are more misled by mistakes made by equity issuing firms then other restating firms.
4
b
5
b
Model 4 shows similar analysis for debt issuing firms. We find that investors are not misled by mistakes made by debt issuing firms ((b2 +b5)is not significant). We also
find that the coefficient on SUE for debt issuing firms is not significant, suggesting that our sample might be too small to test predictions for debt issuing firms. Table 5 Panel F shows regression results for the downward restatements. All results are similar to those for the full sample (Panel E).
Overall, we find support for hypothesis 2 for equity but not for debt issuing firms.
4.4. Abnormal returns in the restated period before equity and debt issuance
To test hypothesis 3 we examine abnormal returns in the restated period until security issuance (period (Mistake, Issuance)). This period begins after the restated earnings have been reported to the market (day +2) and end two days prior to the announcement of the security offer. For firms that are missing earnings announcement date, the start date is calculated as the end of the quarter plus 29 days, which is the average lag between the end of the quarter and the reporting date for our sample.
To ensure robustness of the results, we calculate several measures of abnormal performance. First, we calculate cumulative abnormal returns prior to equity and debt issuance in restated period ( ). To calculate market model CAR, we first estimate market model parameters as follows.
Issuance) (Mistake, CAR it mt i i it R R =α +β +ε (5)
where is the return on firm i on day t, is the return on the market index on day t
(value-weighted CRSP market index), and
it
R Rmt
it
ε is a random error term. The abnormal stock return for security i on day t is defined as
) ( ^i ^i mt it it R R AR Model Market = − α +β (6)
Cumulative abnormal return is the sum of abnormal returns over period τ. We report daily CARs, since some of the periods of interest are firm specific. Daily CARs are calculated as CARs divided by the number of days over which accumulation occurred.
We estimate market model parameters for 250 trading days starting on day -250 relative to the beginning of the restated period. This window is chosen so that the same market model parameter estimates can be used to test whether CARs are abnormal one year before the beginning of restated period ( ). Unfortunately, only 32 of 68 equity issuing firms have enough data to estimate market model parameters for this period. To recover some of the observations and to ensure the robustness of the results, we also estimate market model parameters for 250 days starting on day -5 relative to mistake. Table 6 shows that the results depend on the estimation period for market model parameters. Therefore, we estimated two more measures of abnormal performance: market adjusted abnormal returns and buy-and-hold abnormal returns.
Mistake) year, (1
CAR
Market adjusted abnormal return is calculated as
mt it it R R AR Adjusted Market = − (7)
The advantage of using this return is that it does not require the estimation of the market model parameters and therefore leads to fewer lost observations. The drawback is that market adjusted return does not account for the market risk.
Buy-and-hold return ( ) over period τ for firm i is calculated as the geometric return. represents the actual experience of an investor who passively holds a sample firm for period τ .
τ , i BHR τ , i BHR , (1 ) T i t it BHRτ =
∏
+R,
(8)
where Rit is the ith firm return on the tth day, and T is the number of trading days in period τ. Buy and hold abnormal return (BHARi,τ) is calculated as:
, , (
i i i, )
BHARτ =BHRτ −E BHRτ
)
, (9)
where E BHR( i,τ is the τ period expected return for security i. We use two estimates of expected earnings. The first proxy is the performance of restating firm itself one year before the start of the restated period. The second proxy is the return on a size and book-to-market matched peer firm in the same industry (two digit SIC code) as the restating firm.9 We follow Lyon, Barber and Tsai’s (1999) approach to selecting among
possible control firms. They showed that control firm approach yields well specified results when control firms are matched on size and book to market.10 Size is measured by the market value of equity. Book-to-market ratio is calculated as the ratio of equity book value to equity market value. Both size and book to market are calculated one year prior to restatement. We eliminate all restating firms from the pool of potential control firms. We also require control firms to have CRSP data at least one year prior to mistake and one year subsequent to restatement.
First, we calculate returns in the period (Mistake, Issuance) for all firms issuing equity and debt (Table 6, Panels A and B). Table 7, Panel A shows restated period abnormal returns prior to equity issuance. We find that BHARs both relative to control firm and relative to pre-mistake period are positive and significant and equal 0.45% and 0.31%, respectively. 11 Market adjusted CAR is also positive and significant. However,
9 Control firms for three companies had to be found within one digit SIC code to satisfy data requirements. 10 They also show that when using this approach regular t statistics are well specified.
11 The period between mistake and security issuance and between security issuance and restatement are
market model adjusted abnormal returns are not statistically different from zero for this period. Since BHARs are considered to be better measures of abnormal performance during longer periods, we conclude that equity issuing firms experience abnormally positive
s experience abnormally high returns in the restated period prior to securit
gesting that most of the overvaluation starts after the firm reports
performance after mistake before security issuance.
Next, we test hypothesis 3 by constraining the sample to only those firms for which MISTAKE>SUE before equity issuance. We calculate total SUE and total Mistake for the period (Mistake, Issuance) by adding SUE and Mistake for all quarters announced in this period. Of the 22 firms issuing equity with available data for SUE, 16 (73%) make mistakes that allow them to beat expectations (MISTAKE>SUE). For all of this firms SUE<0, which means that in the absence of earnings management such firms would not have met analyst expectations. Unfortunately, the data is available only for 11 of these firms for calculation of abnormal returns. Despite small sample, we find that for these firms all measures of abnormal returns are positive and statistically significant.12 This supports hypothesis 3 for equity issuing firms – firms that manage earnings to beat analyst expectation
y issuance.
Table 6 Panel C shows abnormal returns one year before restated period for firms issuing equity in the restated period (1 Year, Mistake). Only market adjusted CAR is positive and significant, sug
erroneous earnings.
12 Results are not tabulated for brevity.
Table 6 Panels B and D show that for debt issuing firms all returns are statistically insignificant from zero for the period (Mistake, Issuance) and (1 Year, Mistake).13We do not report market model CARs, for which market model parameters are estimated during period (-254,-5), because estimation period for model parameters coincides with CAR period. Only market model CAR, with market model parameters estimated during the period (-501, -250) relative to mistake, is estimated for this window. This result is not t mistakes made by debt issuing firms do not cause misvalu
ting firms that issue equity in restated period have higher market
surprising in light of the finding tha
ation even during a three day window at the announcement of misstated earnings.
4.5. Characteristics of issuing firms
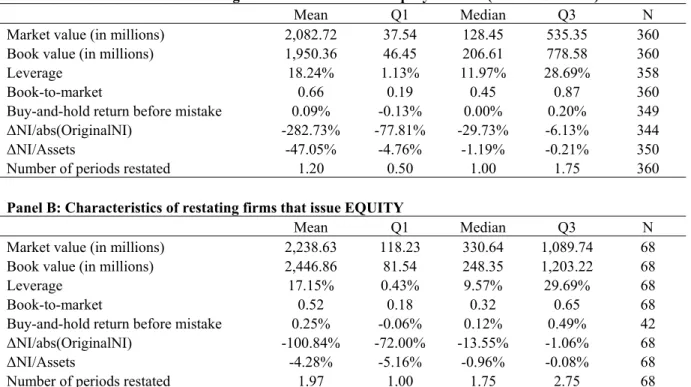
Table 7 examines characteristics of restating firms conditional on security issuance for the full sample of restating firms.14 Panels A and B show characteristics of restating firms that do not issue securities in restated period and those that issue equity, respectively. Panel C compares these sub-samples using two-tailed Wilcoxon signed ranks test. We find that resta
value and return one year before the start of the restated period. They have the same book value, leverage and book-to-market ratio compared to firms that do not issue securities in restated period.
We find that firms that issue equity in restated period inflate net income less through erroneous accounting than non-issuing firms. This suggests that restating firms has shorter distance to the benchmark they are trying to meet. Despite this, as we showed in section 4.3, market reacts more strongly to surprises and mistakes made by restating
irms issuing debt with available data for calculating SUE, SUE is negative. For 9 firms with negative SUE Mistake is greater than SUE.
13 For 10 out of 12 f
firms t
ger, more highly levered, make smaller
igher leverage than restating firms that issue equity in restated period.
ng.
Overall we find support fo ing firms have better pre-mistake
[Insert Table 7 about here]
hat issue equity than by non-issuing firms. Restating firms that issue equity in restated period have longer restated periods than firms that do not issue equity. This result can be due to the increase in the likelihood of any event happening during longer period of time.
Table 7, Panels D shows characteristics of firms that issue debt in restated period and Table 7, Panel E compares this sub-sample to that of restating firms that do not issue securities. Restating firms that issue debt are much lar
mistakes and have longer restated periods than non-issuing sub-sample. As in the case of equity issuing firms, the magnitude of the mistake is smaller for debt-issuing firms than for non-issuing sub-sample. Unlike equity issuing firms, debt issuing firms do not exhibit positive stock returns in pre-mistake period.
Table 7, Panel F compares restating firms that issue debt in restated period to restating firms that issue equity in restated period. We find that firms that issue debt are much larger and have h
Firms that issue equity make larger mistakes in net income than firms that issue debt. Since higher net income is more likely to have a greater positive impact on equity price than on debt price, this result is consistent with managers inflating earnings to obtain better financi
r hypothesis 4: equity issu
performance than non-issuing firms and debt-issuing firms. We also find support for hypothesis 5: debt issuing firms have higher leverage than both equity-issuing and non-issuing firms.
Table 8 tests hypotheses 4 and 5 in a multivariate setting. Specifically, we examine the likelihood of equity and debt issuance as a function of firm and restatement
(Model 2), wise. Please see
magnitude (ΔNI/Assets) and number of periods restated
2 only for downward restatements for which firms manage
characteristics by running a logit model. The dependent variable in Model 1
Equity (Debt), is equal to 1 if the firm issued equity (debt) and zero other legend to Table 7 for precise definitions of other variables.
Model 1: Equity = a + β1 Buy-and-hold return before mistake + β2 Leverage + β3 ΔNI/Assets + β4 Number of periods restated + β5 log(Market value) Model 2: Debt = a + β1 Buy-and-hold return before mistake + β2 Leverage + β3 ΔNI/Assets + β4 Number of periods restated + β5 log(Market value)
Hypothesis 4 predicts that β1>0 in Model 1 and insignificant coefficient β1 in Model 2.
Hypothesis 5 predicts that β2>0 in Model 2 and is insignificant in Model 1. We also control for restatement characteristics: its
(Number of periods restated). We also control for firm size by including logarithm of market capitalization log(Market value). We expect that larger firms are more likely to issue equity and security.
We estimate Models 1 and
d their earnings upward. As discussed earlier, downward earnings management prior to security issuance cannot lead to more favorable financing and therefore must be motivated by other considerations.
We find support for hypothesis 4 and 5. Firms that issue equity have higher return before mistake than non-issuing firms (β1>0 in Model 1). Coefficient β1 is statistically
insignificant in Model 2 suggesting that debt issuing firms do not exhibit high returns prior to the start of the restated period. We also find support for hypothesis 2: coefficient
β2 on leverage is positive and statistically significant in Model 2 and is indifferent from
zero in Model 1. The only other significant coefficient in Model 1 is the coefficient β4 on the Number of periods restated. This coefficient is also significant in Model 4, which is consist
we find that the coefficients on book-to-market and sales g wth are not statistically significant in either model. In alternative specification, ofitability by including return on assets but find the coefficient to be insignif
nvestors and cau
ent with univariate analysis. We also find that restating firms are more likely to issue debt when they make smaller mistakes as suggested by β3>0. Debt is issued by
larger firms.
In results not tabulated we consider other firm and restatement characteristics and add them to models 1 and 2 one at a time. To control for growth opportunities we include book-to-market and sales growth. Firms with higher growth prospects should be more likely to issue securities. However,
ro
we control for pr
icantly different from zero.
5. Conclusion
Increasing number of firms restate financial statements (GAO (2002), Huron (2005)). Large shareholder losses associated with restatements motivated several legislations, including Sarbanes Oxley Act of 2002 (Palmrose, Richardson and Scholz (2004)). It has been suggested that firms manage earnings, both within GAAP and outside of GAAP, to issue securities at favorable prices. Such practices mislead i
se them to overvalue security issuance. However, as investors learn the true value of earnings, they revalue firms that manage earnings downwards. This conjecture was called the earnings management hypothesis by Teoh, Welch and Wong (1998b).
This paper tests earnings management hypothesis using a sample of firms restating financial statements during the period of January 1997- June 2002. We find that while restating firms issue more equity and debt than control firms, the number of issuances is small. Moreover, about 20% of equity and dent issuing firms manage net income
ted period. They do not exhibit any abnormal performance prior to debt issuanc
ssue debt are considerably larger, more highly
uity. Restating firms that issue debt restate more reports than non-issuing firms, but not firms issuing equity.
Overall our results indicate that only a few restating firms that issue equity obtain financing at better terms.
downward prior to security issuance, which is inconsistent with the earnings management hypothesis. This result implies that security issuance is not the dominant reason for violating GAAP for more than 80% of restating firms.
Restating firms that issue equity outperform the market and the control firms subsequent to GAAP violation and prior to equity issuance and perform better one year prior to GAAP violation. Earnings management hypothesis is not supported for firms that issue debt in resta
e in restated period and one year before mistake. In conclusion, overall results suggest limited support for earnings management hypothesis for a sample of firms violating GAAP.
Restating firms that issue equity are larger in market value terms than non-issuing firms, have higher pre-mistake return, make smaller downward revisions of net income and restate more reports. Restating firms that i
levered, and make smaller downward revisions of net income than non-issuing firms and firms issuing eq
References:
Agrawal, A. and S. Chadha, 2005, Corporate governance and accounting scandals,
Journal of Law and Economics 48, 371-406.
Akhigbe, A., and J. Madura, 2008, Industry signals relayed by corporate earnings restatements, The Financial Review 43 (4), 569-589.
Akhigbe, A., R.J. Kudla, and J. Madura, 2005, Why are some corporate earnings restatements more damaging, Applied Financial Economics 15, 327-336.
Asquith, P. and D. Mullins, 1986, Equity issues and offering dilution, Journal of Financial Economics 15, 61-89.
Baker, M. P., and J. Wurgler, 2002, Market timing and capital structure, Journal of Finance 57, 1-32.
Ball, R., and P. Brown, 1968, An Empirical Evaluation of Accounting Income Numbers,
Journal of Accounting Research 6, 159–77.
Bardos, K. S. 2011, Quality of financial information liquidity, Review of Financial Economics 20 (2), 49-62.
Bardos, K. S., Cline, B. N., and G. Koutmos, 2011, Information quality and cost of equity, Fairfield University and Mississippi State working paper.
Bardos, K. S., J. Golec, and Harding, J. P., 2011, Do investors see through mistakes in reported earnings, Journal of Financial and Quantitative Analysis, forthcoming. Burch, T. R., Christie W. G., and V. Nanda, 2004, Do Firms Time Equity Offerings? Evidence from the 1930s and 1940s, Financial Management 33, 1.
Burns, N., and S. Kedia, 2006, The impact of performance-based compensation on misreporting, Journal of Financial Economics 79, 35-67.
Bradley, D., B. Cline, Q. Lian. 2010, Class action lawsuits and executive option exercise behavior, University of South Florida working paper.
Christie, A., and J. Zimmerman, 1994, Efficient versus Opportunistic Choices of Accounting Procedures: Corporate Control Contests, Accounting Review 69, 539-566. Collins, D. W., and S. P. Kothari, 1989, An Analysis of Intertemporal and Cross-Sectional Determinants of Earnings Response Coefficient, Journal of Accounting and Economics 11, 143-81.
DeAngelo, L. E. 1988, Managerial competition, information costs, and corporate governance: The use of accounting performance measures in proxy contests, Journal of Accounting and Economics 10, 3-36.
Dechow, P.M. and I. Dichev, 2002, The Quality of Accruals and Earnings: The Role of Accrual Estimation Errors, The Accounting Review, 77 (Supplement), 35-59.
Dechow, P. M. and C. M. Schrand, 2004, Earnings Quality, Research Foundation Publications, 2004:3, 1-152.
Dechow, P. M. and D. Skinner, 2000, Earnings Management: Reconciling the Views of Accounting Academics, Practitioners, and Regulators, Accounting Horizons 14(2), 235– 250.
Dechow, P. M., Sloan, R. G., and Sweeney, A. P., 1996, Causes and Consequences of Earnings Manipulation: An Analysis of Firms Subject to Enforcement Actions by the SEC, Contemporary Accounting Research 13(2), 235-250.
DeFond, M. and J. Jiambalva, 1994, Debt Covenant Effects and the Manipulation of Accruals, Journal of Accounting and Economics 17, 145-176.
Dittmar, A. and A. Thakor, 2007, Why Do Firms Issue Equity? Journal of Finance 62(1), 1-54.
DuCharme, L. P. Malatesta and S. Sefcik, 2004, Earnings management, stock issues, and shareholder lawsuits, Journal of Financial Economics 71, 27–49.
Efendi, J., Srivastava, A., Swanson, E., 2006, Why do corporate managers misstate financial statements? The role of in-the-money options and other incentives, Journal of Financial Economics 85 (3), 667-708.
Friedlan, J., 1994, Accounting choices by issuers of initial public offerings,
Contemporary Accounting Research 11, 1–31.
Erickson, M. and Wang, S., 1999, Earnings management by acquiring firms in stock for stock mergers, Journal of Accounting and Economics 27 (2), 149-176.
General Accounting Office, 2002, Financial statement restatements: trends, market impacts, regulatory responses, and remaining challenges, GAO-03-138.
Graham, J., Li, S., and Qiu, J., 2008, Corporate misreporting and bank loan contracting,
Journal of Financial Economics 89 (1), 44-61.
Hovakimiam, A., T. Opler, and S. Titman, 2001. The debt-equity choice. Journal of Financial and Quantitative Analysis 36, 1-24.
Huron Consulting Annual Report on Restatements, 2005.
Jensen, M., 2005, Agency Costs of Overvalued Equity, Financial Management 34, 5-19. Jones, J., 1991, Earnings Management during Import Relief Investigations, Journal of Accounting Research 29 (2), 193-223.
Jung, K., Y. C. Kim, and R. M. Stulz, 1996. Timing, investment opportunities,
managerial discretion, and the security issue decision, Journal of Financial Economics
42, 159-185.
Kim, Y. and M. Park, 2005, Pricing of seasoned equity offers and earnings management,
Journal of Financial and Quantitative Analysis 40, 435–463.
Kothari, S., A. Leone and C. Wasley, 2005, Performance-matched discretionary accruals,
Journal of Accounting and Economics 39, 163-197.
Palmrose, Z. V., and S., Scholz, 2004, The Accounting Causes and Legal Consequences of Non-GAAP Reporting: Evidence from Restatements, Contemporary Accounting Research 21 (1), 139–80.
Palmrose, Z-V, Richardson, V.J., Scholz, S., 2004, Determinants of Market Reaction to Restatement Announcement, Journal of Accounting and Economics 37, 59-89.
Perry, S., and T. Williams, 1994, Earnings management preceding management buyout offers, Journal of Accounting and Economics 18, 157-179.
Petersen, M. A. 2009, Estimating Standard Errors in Finance Panel Data Sets: Comparing Approaches, Review of Financial Studies 22 (1), 435-480.
Rangan, S. 1998, Earnings management and the performance of seasoned equity offerings, Journal of Financial Economics 50, 101-122.
Richardson, S., Tuna A., Wu, M., 2002, Predicting Earnings Management: The Case of Earnings Restatements, University of Pennsylvania working paper.
Shivakumar, L., 2000, Do firms mislead investors by overstating earnings before seasoned equity offerings? Journal of Accounting and Economics 29 (3), 339-371. Sweeney, A.P., 1994, Debt Covenant Violations and Manager’s Accounting Responses,
Journal of Accounting and Economics, 17, 281-308.
Teoh, S., Welch I., Wong, T., 1998a, Earnings management and the subsequent market performance of initial public offerings, Journal of Finance 53, 1935-1974.
Teoh, S., Welch, I. and Wong, T., 1998b, Earnings management and the long run
underperformance of seasoned equity offerings, Journal of Financial Economics 50, 53– 100.
Urcan, O. and R.L. Kieschnick, Jr., 2006, Earnings management and convertible debt issuance. University of Texas at Dallas working paper.
Table 1. Descriptive statistics of restating firms
This table shows descriptive statistics for a sample of publicly traded U.S. companies that announced financial statement restatements during the period January 1, 1997 to June 30, 2002. Restatement announcement dates were hand collected from the Lexis-Nexis and Factiva databases using key words “restatement” “restat” “revis” “adjust” “error” and “responding to guidance from the SEC” during the period January 1, 1997 - June 30, 2002. Further details about restatement were found in original and restated financial statements. Resulting sample was cross-checked with the sample released by Government Accountability Office. Unlike the GAO sample. We excluded restatements that were caused by an adoption of new accounting rules, and retained only restatements due to a mistake or an improper interpretation of GAAP rules. ΔNI/abs(OriginalNI) is the difference between restated net income and originally reported net income, standardized by the absolute value of the originally reported net income. ΔNI/Assets is the difference between restated net income and originally reported net income, standardized by book value of total assets measured one year prior to restatement announcement. Downward (upward) restatements are defined as restatements revising net income downward (upward) at restatement announcement.
Panel A: Frequency of restatements
Number of restatements Number of firms
1 426 2 10 Total 436
Panel B: Distribution of restating firms by announcement year
Announcement year restatements Number of
1997 56 1998 58 1999 104 2000 105 2001 63 2002 60 Total 446
Panel C: Restatement characteristics
Sample Mean Q1 Median Q3 N
Number of restated years 1.34 0.50 1.00 2.00 446
ΔNI/abs(OriginalNI) -2.426 -0.732 -0.231 -0.049 430
ΔNI/Assets -0.043 -0.385 -0.011 -0.002 436
Panel D: Downward and Upward restatements
Number of firms %
Downward restatement 385 86.3%
Upward restatements 61 13.7%
Panel E: Distribution of ΔNI/Assets for Downward and Upward restatements
Mean Q1 Median Q3 N
Downward restatement -0.457 -0.055 -0.015 -0.004 375
Table 2. Descriptive statistics of restating and control firms
Panel A shows descriptive statistics for a sample of firms that restated financial statements during the period January 1, 1997 to June 30, 2002. Firm characteristics are calculated one year prior to the year of restatement announcement. Market value is calculated as the product of the closing price at the end of the fiscal year and the number of common shares outstanding. Book value is the book value of total common equity. Leverage is calculated as the value of the long term debt deflated by end of year assets. Book-to-market is the ratio of book value of total common equity to the market value. Panel B shows descriptive statistics for the sample of control firms. Control firms are found among all firms that did not restate their earnings during the period January 1, 1995 to June 30, 2002 in the same two digit SIC code as restating firms that are the closest in size (market value) and book-to-market, measured one fiscal year prior to the announcement of restatement, and have sufficient data to calculate returns one year prior to mistake and one year subsequent to restatement. Panel C presents Z-value and p-value (P>Z) of the Wilcoxon signed ranks test (2-tailed). *, **, *** indicates significance at 1%, 5%, 10%, respectively.
Panel A: Characteristics of restating firms
Mean Q1 Median Q3 N
Market value (in millions) 2,259.09 44.34 182.87 682.51 446 Book value (in millions) 2,375.33 55.78 223.41 1,059.37 446
Leverage 18.45% 1.14% 13.31% 29.49% 444
Book-to-market ratio 0.63 0.19 0.44 0.83 446
Panel B: Characteristics of control firms
Mean Q1 Median Q3 N
Market value (in millions) 2,276.91 44.88 183.14 688.37 446 Book value (in millions) 2,099.64 48.45 187.60 813.37 446
Leverage 16.44% 0.36% 10.71% 26.46% 446
Book-to-market ratio 0.63 0.19 0.44 0.84 446
Panel C: Comparison of characteristics of restating and control firms
Mean Z-value P>Z
Market value (in millions) -17.82 -0.10 92.15%
Book value (in millions) 275.69 1.44 15.01%
Leverage 2.00% 1.68 9.37% *
Table 3. EQUITY issuance in restated period
This table shows number of equity issuances in restated period and amounts raised by 436 firms restating financial statements during the period January 1, 1997 - June 30, 2002 and control firms. Restated period is defined as the period between the beginning of the period of the first mistake (year or quarter) and the restatement announcement. Control firms are found among all firms that did not restate their earnings during the period January 1, 1995 to June 30, 2002 in the same two digit SIC code as restating firms that are the closest in size (market value) and book-to-market, measured one fiscal year prior to the announcement of restatement, and have sufficient data to calculate returns one year prior to mistake and one year subsequent to restatement. Panel A shows Chi-square test for binary variables to compare number of issuances for restating and control samples. Panel C presents Z-value and p-value (P>Z) of the Wilcoxon signed ranks test (2-tailed) for the difference in mean amounts raised. *, **, *** indicates significance at 1%, 5%, 10%, respectively.
Panel A: EQUITY issuances in restated period
Number of equity issuances Number of issuing firms
Restating firms 85 68
Control firms 48 41
Chi-square test for binary variables 11.12 7.62 P-value of chi-square test <0.01*** 0.01***
Panel B. Number of EQUITY issuances per firm
Number of equity issuances by the same firm Restating Firms Control Firms
1 53 35
2 13 5
3 2 0
4 0 1
Total 68 41
Panel C. Principal amount of EQUITY raised (in millions)
Sample Mean Q1 Median Q3 N Difference
Total Amount
Raised Z-value P>Z
Restating Firms $9,205.40 $109.59 $35.15 $59.45 $137.55 84 0.28 0.78 Control Firms $3,876.10 $82.47 $35.20 $57.60 $139.20 47
Panel D. Principal amount of EQUITY raised (as a percent of total assets)
Sample Mean Q1 Median Q3 N Difference
Z-value P>Z
Restating Firms 33.76% 9.47% 23.12% 42.47% 84 -0.82 0.41
Table 4. DEBT issuance in restated period
This table shows number of debt issuances in restated period and amounts raised by 436 firms restating financial statements during the period January 1, 1997 - June 30, 2002 and control firms. Restated period is defined as the period between the beginning of the period of the first mistake (year or quarter) and the restatement announcement. Control firms are found among all firms that did not restate their earnings during the period January 1, 1995 to June 30, 2002 in the same two digit SIC code as restating firms that are the closest in size (market value) and book-to-market, measured one fiscal year prior to the announcement of restatement, and have sufficient data to calculate returns one year prior to mistake and one year subsequent to restatement. Panel A shows Chi-square test for binary variables to compare number of issuances for restating and control samples. Panel C presents Z-value and p-value (P>Z) of the Wilcoxon signed ranks test (2-tailed) for the difference in mean amount raised. *, **, *** indicates significance at 1%, 5%, 10%, respectively.
Panel A: DEBT Issuances in restated period
Number of debt issuances Number of issuing firms Restating firms 128 28 Control firms 72 18
Chi-square test for binary variables 13.4063 2.2921
P-value of chi-square test <0.01*** 0.13
Panel B: Number of DEBT Issuances per firm
Number of equity issuances by the same firm Restating Firms Control Firms
1 11 7 2 6 4 3 4 1 5 0 2 6 1 0 7 0 1 8 1 1 9 1 0 11 1 1 14 1 0 15 1 0 18 0 1 29 1 0 Total 28 18
Table 4, continued. DEBT issuance in restated period
Panel C: Principal amount of DEBT raised (in millions)
Sample Mean Q1 Median Q3 N Difference
Total Amount Raised Z-value P>Z
Restating Firms $21,162.70 $167.96 $2.60 $150.00 $269.00 126 -2.42 0.02** Control Firms $15,592.00 $216.56 $100.00 $200.00 $250.00 72
Panel D: Principal amount of DEBT raised (as a percent of total assets)
Sample Mean Q1 Median Q3 N Difference
Z-value P>Z
Restating Firms 1.91% 0.05% 0.38% 1.70% 126 -2.64 0.01***