Millennial Learners’ Acceptance and Satisfaction of
Blended Learning Environment
Sharidatul Akma Abu Seman1, Maryam Jameelah Hashim1, Rosmimah Mohd Roslin3,
Nor Irvoni Mohd Ishar1,2,3*
1Faculty of Business Management,Universiti Teknologi MARA,
UiTM Puncak Alam Campus, 42300 Puncak Alam, Selangor, Malaysia
2Arshad Ayub Graduate Business School, Universiti Teknologi MARA, Shah Alam Selangor,
Malaysia
3Institute of Business of Excellence, Universiti Teknologi MARA, Shah Alam, Selangor,
Malaysia [email protected] *Corresponding Author Received: 12 November 2019 Accepted: 7 December 2019 Published: 26 December 2019 ABSTRACT
Teaching in an era dominated by millennials represents a challenging task for educators in Institutes of Higher Learning (IHLs). One distinct feature in teaching millennials is the advancement in digital learning which has improved learning styles in higher education. Besides face-to-face interactions with the instructors, the blended learning approach has been introduced in many courses to cater to the needs of millennial learners. This study aims to provide an insight into on students’ acceptance and satisfaction towards the use of Learning Management System (LMS) in a blended learning environment. An online survey was administered to 167 respondents. The majority of the respondents are below 22 years of age and first-year students who are fresh and new to the blended learning concept. This study measured factors like technology experience, computer anxiety,
service quality, system quality, information quality, course quality, and instructor to determine the students’ overall satisfaction. The model was analysed using the partial-least-squares structural modeling approach. The result shows that service quality, instructor quality, and course quality are among the critical factors towards students’ acceptance and satisfaction. Therefore, to ensure LMS’s effectiveness and students’ satisfaction, decision-makers at the higher institution should consider these factors before implementing a blended learning initiative via LMS as the platform.
KEYWORDS: Blended Learning, e-Learning, Higher Education, Learning Management System Millennial Learners
1.
INTRODUCTION
The integration of information and communication technology (ICT) into the education environment has become more common in recent years. Along with e-learning (learning using the technology), the concept of blended learning (BL) is introduced to most disciplines by integrating the face-to-face environment and online communications amid the instructors and students. It is aimed to prepare the students for self-directed learning, the overall satisfaction towards the theory and real practices are still scarce. In this light, studies on the use of Learning Management System (LMS) in blended learning environments have evolved across multiple-disciplines and different level of education level (Diep, Zhu, Struyven, & Blieck, 2017; Ifinedo, Pyke, & Anwar, 2018). These studies include Ifinedo et al., (2018) looked upon the roles of external support and usability as the antecedents of the LMS usage satisfaction. Meanwhile, Prasad, Maag, Redestowicz, & Hoe (2018) used UTAUT models to measure blended learning adoption by international students and revealed that social influences have a substantial impact on behavioral intentions. Moreover, Busaidi & Al-Shihi (2012) studied the instructors’ satisfaction towards LMS and found that the overall users’ satisfaction towards the continuous usage of the system is more crucial to ensure its continuous success.
Consequently, the aims of this paper are as follows:
1) To examine the predictors of students satisfaction (individual, system, and course characteristics) towards the use of LMS system in a blended learning environment
2) To examine the relationship between the overall satisfaction on the continuous intention to use the LMS system.
2.
RESEARCH
FRAMEWORK
AND
HYPOTHESIS
DEVELOPMENT
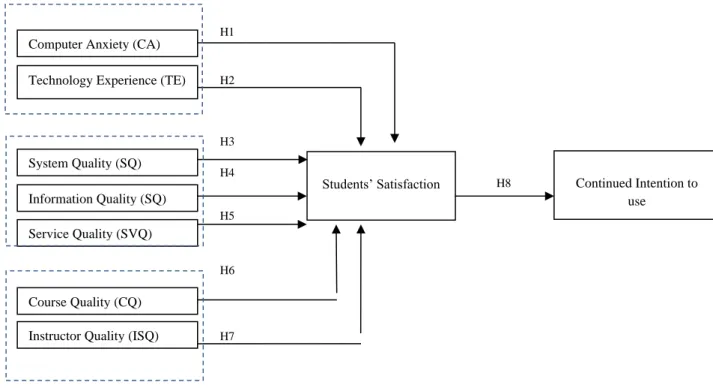
In general, this study characterized the critical factors for student’s satisfaction as individual characteristics, system characteristics, and course characteristics. The system characteristics in this study are measuring using the component from DE Lone and Mclean (D&M) Model. The model has been widely used in measuring the successfulness of the information system in various studies. The original model D&M in the revised model consists of three main antecedents , information quality , system quality, and service quality (DeLone & McLean, 2003). In the meantime, although there are various reports on the success of D&M, there are still insufficient numbers of studies that used the integration model from various integration of perspective.
2.1
Individual Characteristics
The impact of individual characteristics in this study was measured based on computer anxiety and technology experience. Computer anxiety in this study can be defined as “the fear apprehension felt by individuals when they used computers or when they considered the possibility of computer utilization” (Simonson, Maurer, Montag-Torardi, & Whitaker, 1987). In this regard, the younger generation is more open towards the use of technology and it is
expected that computer anxiety is no longer a significant concern. Therefore, users of the LMS are negatively affected by their fear of computers. Besides computer anxiety, technology experience plays are also important in ascertain the acceptance of the technology. In this light, Sharma, Gaur, Saddikuti, & Rastogi, (2017) in their study revealed that technology experience was one of the determinants of continuous use of an e-learning system. In this study, the construct measured was also adopted from (Al-Busaidi & Al-Shihi, 2012).
H1: Students’ computer anxiety is negatively linked their satisfaction towards LMS
H2: Students’ technology use experience is positively linked to with satisfaction towards LMS
2.2 System Characteristics
This study measured three domains namely- information quality, system quality, and service quality to evaluate system characteristics. Information quality is described as “the quality of course content delivered through the LMS” (Ghazal, Aldowah, & Umar, 2018) while system quality is one of the most determinants for user satisfaction in technology usage (Al-Busaidi & Al-Shihi, 2012).. Meanwhile, service quality is defined as the “responsive, convenient operating hours, reliability and communication with service providers (Sharma et al., 2017). In the LMS system platform, good system quality will add value to the overall satisfaction towards the system. In turn, this will lead to the continuous use of the system. Evidence has been found that the LMS system quality plays an important role(Ghazal et al., 2018; Sharma et al., 2017). Thus, the study proposed the following hypothesis:
H3: System quality is positively linked with students’ satisfaction towards LMS H4: Information quality is positively linked with students’ satisfaction towards LMS H5: Service quality is positively linked with students’ satisfaction with LMS
2.3 Course Characteristics
The course characteristics in this study were measured based on the course and instructors characteristics. The course characteristics are defined as the judgment towards the degree to which the system has valuable content (Adeyinka & Mutula, 2010). On the other hand, Instructor characteristics measure how the instructors employ both technical skills and pedagogical skills to facilitate courses offered via e-learning systems (Mtebe & Raphael, 2018). The proposed hypotheses are:
H6: Course quality is positively linked to students’ satisfaction towards LMS H7: Instructor quality is positively linked to students’ satisfaction towards LMS
2.4 Continued Intentions to use
While various studies have focused on the adoption antecedents (Al-Busaidi & Al-Shihi, 2012; Ferdousi & Bari, 2015; Lin & Wang, 2012), this study is focused on investigating the continuous behavior in adopting the LMS system within a blended learning environment. It is believed that In a blended learning environment, the students should meet a certain level of satisfaction towards the online platform before the system can bring critical benefits in enhancing the learning process. Our study presumes that students’ overall satisfaction towards the system will influence their post-adoption behavior. Hence,
H8: Students’ satisfaction is positively linked to the students’ continuous intention to use LMS in a blended learning environment
Fig. 1 Research Framework
3.
RESEARCH METHODOLOGY
3.1 Setting and Sample
This study adopted the quantitative research approach and the sample was selected from students of a local university in Malaysia. As this study is focused on measuring the initial stage of the LMS adoption, only first-year undergraduate students were selected to be part of the study. It is expected that each of the respondents selected has an initial and early experience on using the LMS system in their blended learning session. This selection criteria is considered important as each student’s perception towards system satisfaction might differ according to their experience in using the system.
3.2 Data Collection Procedures
First semester degree students from five different classes were invited to complete the online questionnaire. To avoid any bias, the samples were all students taking the same subject, which is End User Applications. The subject teaches basic Microsoft Applications (Word, Excel, and PowerPoint) as part of the syllabus. All classes have undergone a blended learning session with the instructor, where the first two hours comprise of a face-to-face session which allows the instructor to deliver all the content and teaching guideline. Subsequently, the
System Quality (SQ)
Students’ Satisfaction Continued Intention to
use Computer Anxiety (CA)
Technology Experience (TE)
Information Quality (SQ) Service Quality (SVQ)
Course Quality (CQ) Instructor Quality (ISQ)
H1 H8 H2 H3 H4 H5 H6 H7 S ys te m C ha ra ct er is ti cs Indi vi dua l C ha ra ct er is ti cs C our se C ha ra ct er is ti cs
instructors assigned a task (in various form of activities either exercises, quizzes, discussion or presentation) for the students throughout the week.
3.3 Measurement Items
Students were requested to complete an online questionnaire. The questions were created by the course instructor while the measures of constructs were adapted from the relevant literature. In this light, all constructs related to system acceptance were derived from the studies of (Al-Busaidi & Al-Shihi, 2012; Ghazal et al., 2018; Mtebe & Raphael, 2018; Sharma et al., 2017). The items were measured based on a 5-point Likert Scale (ranging from “Strongly disagree” to “Strongly Agree”) and data was collected using online questionnaires using the English language. A link to the online questionnaire was provided to the students. All participants took around 10-15 minutes to complete the questionnaire. Out of the 167 responses received, 77.2% came from female students, and 22.8% came from male students. Such disparity between gender is normal as most IHLs in Malaysia, are female dominant. The majority (96.4%) of the respondents are in the age group of between 18-22, followed by 3.6% that are aged above 22. In all, 48.5% of respondents have STPM as their highest qualification, whereas 14.4% underwent the matriculation/foundation program while the remaining of 37.1% are diploma holders.
4.
DATA ANALYSIS
During the initial analysis phase, the data has gone through preliminary data cleaning to determine whether there are any errors, outliers and common method bias. . Next, partial least squares structural modeling was employed to analyse the research model further through the SmartPLS 3.0 software (Ringle, Wende, & Becker, 2015). The PLS tool was chosen based on this study’s prediction-oriented nature of determining how selected exogenous variables can be used to predict endogenous variables. The new model was examined through employing a two-step approach which involved, firstly, examining the validity and the reliability of the measurement model and secondly, examining the structural model (relationship among the variables) to finalise the outcome.
4.1 Common Method Bias
For the online questionnaire, all of the students were required to answer all questions to avoid issues pertaining missing values. It is important to note as it is important to check on the common method variance as the data was collected from a single source as recommended by Podsakoff, MacKenzie, Lee, & Podsakoff (2003). In the meantime the Harman’s Single factor test showed that the first factor explains 16.24, and that the total cumulative variances explained is 70.95%. Therefore, it can be concluded that common method bias is not an issue in this study.
4.2 Measurement model
In accordance to the reflective measurement model, the convergent validity and discriminant validity were analysed, as follows,
4.2.1 Convergent Validity
Convergent validity refers to extent indicators of a constructs converge or share a number of common variance (Ramayah, Jacky, Chuah, Ting, & Memon, 2018). As suggested by Hair, Hult, Ringle, & Sarstedt (2017), factor loading, average variance extracted (AVE) and composite reliability (CR) are the factors that determine convergent validity. Table 1 presents the indicator loadings, CR and AVE of the reflective constructs as shown in Table 1 below. Here, no items were deleted as all loadings have exceeded the threshold of 0.708 (Hair et al., 2017). Furthermore, all constructs are at or exceed the minimum cut-off threshold values for CR and AVE which requires the CRs to be greater than 0.7 and all AVEs should be greater than 0.5 (Hair et al., 2017). From here, it can concluded that the constructs in the study have met the reliability and convergent validity requirements.
Table 1. Measurement Model
Construct Items Loadings CR AVE Computer Anxiety CA_1 CA_2 CA_3 0.864 0.879 0.881 0.907 0.765 Technology Experience TE_1
TE_2 TE_3 TE_4 0.820 0.862 0.888 0.800 0.907 0.711 System Quality SQ_1 SQ_2 SQ_3 SQ_4 SQ_5 0.833 0.839 0.801 0.776 0.839 0.910 0.669
Information Quality IQ_1 IQ_2 IQ_3 IQ_4 0.804 0.881 0.835 0.818 0.902 0.697 Service Quality SVQ_1 SVQ_2 SVQ_3 SVQ_4 0.894 0.864 0.918 0.835 0.931 0.772 Course Quality CQ_1 CQ_2 CQ_3 CQ_4 0.885 0.928 0.874 0.868 0.934 0.778
Instructor Quality ISQ_1 ISQ_2 ISQ_3 ISQ_4 0.886 0.873 0.903 0.912 0.941 0.799 Students’ Satisfaction SAT_1
SAT_2
0.918
SAT_3 0.914 Continuous Intention to Use INT_1 INT_2 INT_3 0.937 0.940 0.778 0.918 0.789 4.2.2 Discriminant Validity
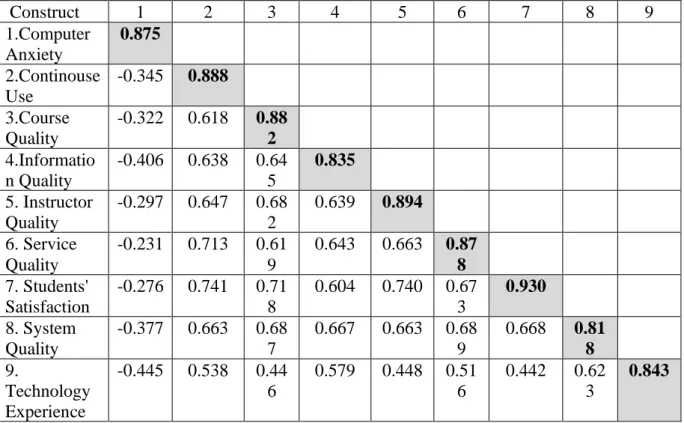
The discriminant validity was assessed based on a study by Hair et al., (2017), The discriminant validity refers to the extents the items are different across different constructs or measures. Fornell and Larker (1981 came out with a guideline which states that all indicators should load strongly on their own, and the average variance shared between the construct, and its measures should be higher than the variance shared within the constructs. As shown in Table 2, the rule is satisfied by the model constructs where the square root of the AVE (diagonal) are higher compared to items; correlations (off-diagonal) with other constructs.
Table 2. Discriminant Validity using Fornell and Larcker Criterion
Construct 1 2 3 4 5 6 7 8 9 1.Computer Anxiety 0.875 2.Continouse Use -0.345 0.888 3.Course Quality -0.322 0.618 0.88 2 4.Informatio n Quality -0.406 0.638 0.64 5 0.835 5. Instructor Quality -0.297 0.647 0.68 2 0.639 0.894 6. Service Quality -0.231 0.713 0.61 9 0.643 0.663 0.87 8 7. Students' Satisfaction -0.276 0.741 0.71 8 0.604 0.740 0.67 3 0.930 8. System Quality -0.377 0.663 0.68 7 0.667 0.663 0.68 9 0.668 0.81 8 9. Technology Experience -0.445 0.538 0.44 6 0.579 0.448 0.51 6 0.442 0.62 3 0.843
Bold numbers in the diagonal represent the SQRT (AVE) of the construct; to achieve the discriminant validity of the constructs, the SQRT (AVE) of each construct should exceed the correlations shared between the construct and other constructs in the model.
The HTMT was used to analyse the discriminant validity as suggested by Henseler et al. (2015). It is stipulated that the discriminant validity is questionable when the HTMT value is higher than HTMT.85 value of 0.85 (Kline, 2015). Another approach that can be used is to
measure the null hypothesis (H0: HTMT ≥1) against the alternative hypothesis (H1: HTMT
<1); if the confidence interval has the value of 1, there is a lack of discriminant validity (Henseler et al., 2015). As shown in Table 3, all values are below the threshold level, HTMT.85(Kline, 2015) as well as HTMT inference, this shows that the confidence interval
did not show a value of 1 on any construct, which shows that all model constructs have a satisfactory discriminant validity.
4.3 Structural Model
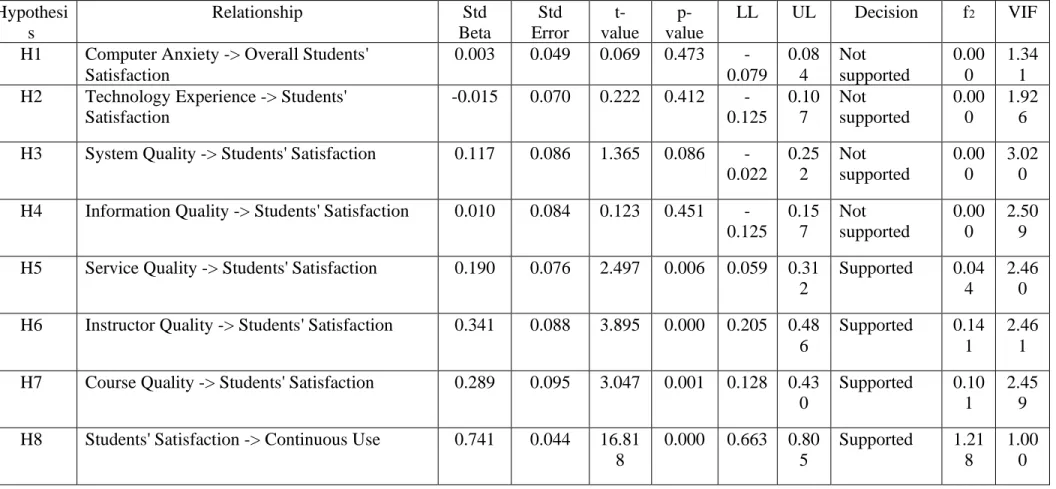
The collinearity issue was tested during the prelimiary structural model assessment. Collinearity occurs when two variables that are hypothesized to be causally related measures the same construct (Ramayah et al., 2018), hence, if the value of VIF is 5 or higher (Hair et al., 2011), or 3.3 or higher (Diamantopoulos & Siguaw, 2006), indicating a potential collinearity problem. Based on Table 4, none of the constructs were more than 5 or 3.3 which indicates that lateral multicollinearity is not a concern in this study.
The re-sampling of the bootstrapping was performed on the structural model to verify the proposed hypotheses, as well as to determine the extent of the causal relationship. To assess the structural model, the R2, standard beta, t-values , via a bootstrapping procedure
with a resample of 500, the predictive relevance (Q2) and the effect sizes (f2) were examined
as suggested by Hair et al., (2017). The results obtained from the structural model are shown in Table 4.
In terms of individual characteristics (computer anxiety and technology experience), both constructs showed insignificant results on the effect of students’ endogenous variable on satisfaction. Therefore, H1 (𝛽 =0.003, not significant) and H2 (𝛽 =-0.015, not significant) were rejected. In the meantime, for system characteristics, system quality, H3 (𝛽 =0.117, not significant) and Information Quality, H4 (𝛽 =0.010, not significant) had insignificant results on the endogenous variable of students satisfaction. Only one construct which is Service Quality H5 (𝛽 =0.190, p<0.01) , have significantly predicted the students’ overall satisfaction towards the LMS. In terms of course characteristics, both instructor and course quality have shown significant results towards the endogenous variable. Therefore, both H6 (𝛽 =0.341, p<0.01) and H7 (𝛽 =0.289, p<0.01) are accepted. Lastly, for H8 (𝛽 =0.741, p<0.01), the overall students satisfaction also significantly predicts the continuous usage of the LMS.
Next, the R2 value was examined to explain the variance among the endogenous
variables. Here, the changes of R2 in a specified exogenous construct will determine how the
endogenous constructs will be substantively impacted by the exogenous constructs. The overall student’s satisfaction by individual, system and course characteristics are explained by 66.4%. In this light, Cohen (1988) suggested that the R2 value exceeding 0.61 indicates
the presence of a substantial model. Meanwhile, the overall students’ satisfaction explains 54.9% of the intention to continue using the system. The R2 values achieved an acceptable
level of explanatory power as recommended by (Cohen, 1988) which indicates a substantial model.
The effect sizes (f2) were also assessed. Sullivan & Feinn (2012) posited that the
p-value is not sufficient to show the effect size. Therefore, both the substantive significance (effect size) and statistical significance (p-value) are crucial in reporting the result. Cohen (1988) guideline was used to measure effect size and the value of 0.02, 0.15 and 0.35 represent small, medium and large effects respectively (Cohen, 1988). Table 4 presents that three relationships are related with large effect size, one is related to small effect size, while the remaining relationship has no effect sizes.
Next, this study examined the power of the model predictive relevance using the blindfolding procedure. Blindfolding is a sample reuse technique that eliminates data point in the endogenous constructs and estimates the parameters with the remaining data points. In this light, the model has a predictive relevance if the Q2 value is larger than 0, (Hair et al.,
2014). All the two values for Students’ satisfaction (Q2=0.529) and Intention to continue
using the system (Q2= 0.403) scored more than 0, indicating that the model has sufficient
5.
Findings and ConclusionThe researcher has found some interesting, revealing findings in this empirical study. In regard to the continuous usage of the LMS, students’ overall satisfaction is important to ensure the system will be continuously used by the students throughout the blended learning process. A significant finding from this study is that computer anxiety is still a major concern for newly enrolled students’ adoption and use of computer technology. This is because the students come from various education backgrounds and this influences the diversity of computer usage. Therefore, it is advisable that the students are fully equipped with the basic computer skills from the school level to ensure the anxiety is reduced during higher education. Meanwhile, some students are confident while operating the LMS systems. These students might have some basic training provided during the course introduction which influenced their confidence in operating the LMS system. The information quality is no longer a major concern as student satisfaction towards using the LMS systems. The reason behind this finding is that students might feel that all content and online activities are available throughout the semester and could be assessed at any time, therefore assessing the current and updated information are essential when using the LMS system.
On the other hand, the respondents expressed that service quality, instructor quality, and course quality are important predictors of their overall satisfaction. Therefore, from the management side of view, it is important to ensure that there are ways for the students to communicate before the system failure (by preparing a hotline number, contact email and feedback form). The support service must also be accessible and available in 24 hours a day. Next, as the courses are conducted virtually, instructors’ quality and the course quality play an important role to ensure its effectiveness. Thus, the instructors must be confident and imaginative to encourage the students to participate in blended learning activities. Consequently, rather than just communicating through forum or uploading exercises to be completed, blended learning sessions should be filled with fun and interactive activities to create enjoyable learning experiences. The course also should comprise from various digital formats such as video and animation rather than just relying on powerpoint slides or textual information. Integrations from various online available teaching tools are also advisable to create a more creative way of learning. Meanwhile, higher education administrators should ensure the system is and laden with various functions and tools to ensure the instructors’ could maximize their and the students’ creativity.
In all, this study contributes to the current literature by explaining the antecedents influencing students’ overall satisfaction towards the adoption of LMS system in the blended learning environment. While the usage of LMS has been widely discussed in literature, it is crucial to identify the factors that contribute to the students’ satisfaction. Undoubtedly, by provisioning an efficient system, the satisfaction rate will increase. Students will experience positive and friendly blended learning environment and as a result, continue to use the platform. In the meantime, although the empirical findings have contributed to the existing literature, the results of the study cannot be generalized. To different population. Hence, future studies should be conducted in different learning environments. Moreover, future studies should also measure how the blended learning system helps to increase the students’ performance in a blended learning environment. Studies could also make a comparison between the intention continuously use LMS between first year students and final year students to understand if there are any similarity and continuity in the post-adoption behaviors.
Table 3. Heterotrait-Monotrait (HTMT) Construc t 1 2 3 4 5 6 7 8 9 1.Comput er Anxiety 2.Contino use Use 0.391 C1.85 (0.239,0.51) 3.Course Quality 0.366 C1.85(0.214, 0.50) 0.689 C1.85 (0.575,0.777) 4.Informa tion Quality 0.475 C1.85(0.318, 0.60) 0.725 C1.85 (0.622,0.811) 0.731 C1.85(0.631, 0.80) 5. Instructo r Quality 0.335 C1.85(0.184, 0.45) 0.711 C1.85(0.62,0. 806) 0.749 C1.85(0.634, 0.82) 0.718 C1.85(0.594, 0.79) 6. Service Quality 0.267 C1.85 (0.126,0.41) 0.802 C1.85(0.716, 0.866) 0.687 C1.85(0.585, 0.76) 0.732 C1.85(0.647, 0.81) 0.729 C1.85(0.645, 0.79) 7. Students' Satisfacti on 0.311 C1.85(0.148, 0.42) 0.815 C1.85(0.724, 0.892 0.786 C1.85(0.693, 0.85) 0.677 C1.85(0.569, 0.76) 0.805 C1.85(0.732, 0.86) 0.736 C1.85(0.65,0 .805) 8. System Quality 0.432 C1.85(0.294, 0.56) 0.749 C1.85(0.632, 0.846) 0.770 C1.85(0.678, 0.84) 0.760 C1.85(0.676, 0.83) 0.737 C1.85(0.638, 0.81) 0.772 C1.85(0.683, 0.85) 0.739 C1.85(0.636, 0.809) 9. Technolo gy 0.532 C1.85(0.394, 0.62) 0.617 C1.85(0.498, 0.71) 0.500 C1.85(0.374, 0.61) 0.673 C1.85(0.556, 0.76) 0.500 C1.85(0.355, 0.61) 0.580 C1.85(0.46,0 .692) 0.488 C1.85(0.348, 0.587) 0.714 C1.85(0.618, 0.788
Experien ce
Table 4. Structural Model Assessment Hypothesi s Relationship Std Beta Std Error t-value p-value LL UL Decision f2 VIF
H1 Computer Anxiety -> Overall Students' Satisfaction 0.003 0.049 0.069 0.473 -0.079 0.08 4 Not supported 0.00 0 1.34 1 H2 Technology Experience -> Students'
Satisfaction -0.015 0.070 0.222 0.412 -0.125 0.10 7 Not supported 0.00 0 1.92 6 H3 System Quality -> Students' Satisfaction 0.117 0.086 1.365 0.086
-0.022 0.25 2 Not supported 0.00 0 3.02 0 H4 Information Quality -> Students' Satisfaction 0.010 0.084 0.123 0.451
-0.125 0.15 7 Not supported 0.00 0 2.50 9 H5 Service Quality -> Students' Satisfaction 0.190 0.076 2.497 0.006 0.059 0.31
2
Supported 0.04 4
2.46 0 H6 Instructor Quality -> Students' Satisfaction 0.341 0.088 3.895 0.000 0.205 0.48
6
Supported 0.14 1
2.46 1 H7 Course Quality -> Students' Satisfaction 0.289 0.095 3.047 0.001 0.128 0.43
0
Supported 0.10 1
2.45 9 H8 Students' Satisfaction -> Continuous Use 0.741 0.044 16.81
8 0.000 0.663 0.80 5 Supported 1.21 8 1.00 0
REFERENCES
Adeyinka, T., & Mutula, S. (2010). A proposed model for evaluating the success of WebCT course content management system. Computers in Human Behavior, 26(6), 1795– 1805. http://doi.org/10.1016/j.chb.2010.07.007
Al-Busaidi, K. A., & Al-Shihi, H. (2012). Key factors to instructors’ satisfaction of learning management systems in blended learning. Journal of Computing in Higher Education,
24(1), 18–39. http://doi.org/10.1007/s12528-011-9051-x
Cohen, J. (1988). Statistical power analysis for the behavioral sciences. Statistical Power Analysis for the Behavioral Sciences. http://doi.org/10.1234/12345678
DeLone, W. H., & McLean, E. R. (2003). The DeLone and McLean model of information systems success: A ten-year update. In Journal of Management Information Systems. http://doi.org/10.1080/07421222.2003.11045748
Diamantopoulos, A., & Siguaw, J. A. (2006). Formative versus reflective indicators in organizational measure development: A comparison and empirical illustration. British Journal of Management. http://doi.org/10.1111/j.1467-8551.2006.00500.x
Diep, A. N., Zhu, C., Struyven, K., & Blieck, Y. (2017). Who or what contributes to student satisfaction in different blended learning modalities? British Journal of Educational Technology, 48(1). http://doi.org/10.1111/bjet.12431
Ferdousi, B., & Bari, J. (2015). Infusing Mobile Technology into Undergraduate Courses for Effective Learning. Procedia - Social and Behavioral Sciences, 176, 307–311. http://doi.org/10.1016/j.sbspro.2015.01.476
Ghazal, S., Aldowah, H., & Umar, I. (2018). Critical Factors to Learning Management System Acceptance and Satisfaction in a Blended Learning Environment. In Research Trends in Information and Communication Technology, Lecture Notes on Data Engineering and Communication Technologies (pp. 688–698). Springer, Cham. http://doi.org/10.1007/978-3-319-59427-9_71
Hair, J. F., Hult, G. T. M., Ringle, C. M., & Sarstedt, M. (2017). A Primer on Partial Least Squares Structural Equation Modeling (PLS-SEM). Thousand Oaks: Sage. http://doi.org/10.1016/j.lrp.2013.01.002
Hair, J. F. J., Hult, G. T. M., Ringle, C., & Sarstedt, M. (2014). A Primer on Partial Least Squares Structural Equation Modeling (PLS-SEM). Long Range Planning (Vol. 46). http://doi.org/10.1016/j.lrp.2013.01.002
Hair, J. F., Ringle, C. M., & Sarstedt, M. (2011). PLS-SEM: Indeed a Silver Bullet. The Journal of Marketing Theory and Practice, 19(2), 139–152. http://doi.org/10.2753/MTP1069-6679190202
Henseler, J., Ringle, C. M., & Sarstedt, M. (2015). A new criterion for assessing discriminant validity in variance-based structural equation modeling. Journal of the Academy of Marketing Science, 43(1), 115–135. http://doi.org/10.1007/s11747-014-0403-8
Ifinedo, P., Pyke, J., & Anwar, A. (2018). Business undergraduates’ perceived use outcomes of Moodle in a blended learning environment: The roles of usability factors and external support. Telematics and Informatics, 35(1), 93–102. http://doi.org/10.1016/j.tele.2017.10.001
Kline, R. B. (2015). Principles and practice of structural equation modeling. Principles and practice of structural equation modeling. http://doi.org/10.1038/156278a0
Kock, N., & Lynn, G. S. (2012). Lateral Collinearity and Misleading Results in Variance-Based SEM : An Illustration and Recommendations. Journal of the Association for Information Systems, 13(7), 546–580.
Lin, W. S., & Wang, C. H. (2012). Antecedences to continued intentions of adopting e-learning system in blended e-learning instruction: A contingency framework based on models of information system success and task-technology fit. Computers and Education, 58, 88–89. http://doi.org/10.1016/j.compedu.2011.07.008
Mtebe, J. S., & Raphael, C. (2018). Key factors in learners’ satisfaction with the e-learning system at the University of Dar es Salaam, Tanzania. Australasian Journal of Educational Technology, 34(4), 107–122. http://doi.org/10.14742/ajet.2993
Podsakoff, P. M., MacKenzie, S. B., Lee, J. Y., & Podsakoff, N. P. (2003). Common Method Biases in Behavioral Research: A Critical Review of the Literature and Recommended Remedies. Journal of Applied Psychology, 88(5), 879–903. http://doi.org/10.1037/0021-9010.88.5.879
Prasad, P. W. C., Maag, A., Redestowicz, M., & Hoe, L. S. (2018). Unfamiliar technology: Reaction of international students to blended learning. Computers and Education. http://doi.org/10.1016/j.compedu.2018.03.016
Ramayah, T., Jacky, C., Chuah, F., Ting, H., & Memon, M. A. (2018). Partial Least Squares Structural Equation Modeling (PLS-SEM) using SmartPLS 3.0. Handbook of Market Research (2th Editio). Pearson Malaysia Sdn Bhd. http://doi.org/10.1007/978-3-319-05542-8_15-1
Ringle, C., Wende, S., & Becker, J. (2015). SmartPLS 3. Retrieved From. http://doi.org/http://www.smartpls.com
Sharma, S. K., Gaur, A., Saddikuti, V., & Rastogi, A. (2017). Structural equation model (SEM)-neural network (NN) model for predicting quality determinants of e-learning management systems. Behaviour & Information Technology, 36(10), 1053–1066. http://doi.org/10.1080/0144929X.2017.1340973
Simonson, M. R., Maurer, M., Montag-Torardi, M., & Whitaker, M. (1987). Development of a Standardized Test of Computer Literacy and a Computer Anxiety Index. Journal of Educational Computing Research, 3(2), 231–247. http://doi.org/10.2190/7CHY-5CM0-4D00-6JCG
Sullivan, G. M., & Feinn, R. (2012). Using Effect Size—or Why the P Value Is Not Enough.
Journal of Graduate Medical Education, 4(3), 279–282. http://doi.org/10.4300/JGME-D-12-00156.1