The Effect of Corruption on Economic Development in Nigeria:
1996-2016
G. Udi
Department of Business Administration, Delta State Polytecnic, Otefe-Oghara, Nigeria B. O. Ohwofasa (PhD)
Department of Social Sciences, Delta State Polytechnic, Otefe-Oghara J. Erakpoweri
Department of Social Sciences, Delta State Polytechnic, Otefe-Oghara, Nigeria L.B. Ekaje (Mrs)
Department of Business Administration, Delta State Polytecnic, Otefe-Oghara, Nigeria Abstract
The paper focuses on the relationship between corruption and poverty as well as impact of corruption on economic growth in Nigeria for the period, 1996-2016. Corruption is a canker worm that has reduced development in all facets of the economy as it has eaten deep to the extent that major economic indicators are negatively affected. The study relied on both descriptive and econometric methods to analyze the data. Specifically, the study uses ordinary least square method to explore the contemporaneous dynamics. The study finds that poverty is positively and significantly responsive to corruption. It was also observed that corruption perception index and corruption rank exerted negative impact on economic growth. The study argued that the trends of corruption perception index and the country’s annual ranking as among the most corrupt countries in the world has tended to undermine economic growth. The study noted that anti-graft agencies (EFCC and ICPC) must been adequately funded and equipped in order to mitigate against corruption without government interference.
Keywords: Corruption Perception Index, Corruption Rank, Economic Growth and ARDL model. 1. Introduction
Corruption in the public sector is often viewed as exacerbating conditions of poverty in countries already struggling with the strains of economic growth and democratic transition. Alternatively, countries experiencing chronic poverty are seen as natural breeding grounds for systemic corruption due to social and income inequalities and perverse economic incentives. Corruption is a disease which eats into the cultural, political and economic growth of any country and has destroyed the functioning of various organs of the government especially in Africa. In Nigeria, corruption remains a long-term major political and economic growth challenge (Sachs, 2007). Abiodem (2007) in World Bank studies put corruption at over $1 trillion per year accounting for up to 15% of the gross domestic product in Nigeria. According to ICPC (2006), it is the primary reason behind the country difficulties in developing fast.
Nigeria is blessed with abundant natural and human resources to the extent that some of these natural resources have never been extracted or tapped by the government as for example gold. Yet, high level of corruption has tended to undermine the benefits from these resources (Nageri, Gunu and Abdul, 2013). Nigeria featured for the first time in the Corruption Perception Index (CPI) of Transparency International (TI) in 1996. Thereafter, the country has continuously languish in the bottom of the ranking among countries evaluated thereby placing Nigeria as one of the top three most corrupt countries in the world. This has led to high level of poverty and underdevelopment. This can be seen from all indexes of development over the last few decades. For instance, the world‘s per capita income as of 2010 was about $8,000. Comparing this to Nigeria’s per capita income of $280 makes the country one of the poorest in the world. This relegated Nigeria to the ranks of Togo ($270), Rwanda ($220) and Mali ($210). Other indicators of development, such as life expectancy, for which Nigeria was ranked 155th out of the world‘s 177 countries, and infant mortality for which Nigeria was ranked 148th among 173 countries, were consistent with Nigeria‘s low rank in income per capita (CIA, 2009). Nigeria gross national product (GNP) of $510 billion as at 2013 is the highest in Africa but also has high income inequality with attendant low standard of living for the populace. For instance, income inequality in Nigeria in 2014 stood at 28.4% with a living standard of 40.8% compared to Ethiopia with inequality of 9.5% and a standard of living of 47.4% as well as 28.2% income inequality for DR Congo with a living standard of 53.4% (World Bank, 2015).
Essentially, Nigeria has been classified as a poor nation; a situation which can be described as a bewildering paradox given the vast resource base of the country. The National Bureau of Statistics (NBS) reported that the
percentage of people living in poverty increased from 27.2% in 1980 to 46.3% in 1985, dropped to 42.7% in 1992 and then increased to 65% in 1996. By 2010, the poverty level rose to 69%, indicating that about 112.47 million Nigerians are living below the poverty line (NBS, 2010). Nigeria is therefore aptly described as a paradox of poverty in the midst of plenty. According to Earth Trends (2003), about 70.2% of the Nigerian population lives on less than $1 a day, while 90.8% lives on less than $2 a day. The total income earned by the richest 20% of the population (most of whom got rich through corrupt practices) is 55.7%, while the total income earned by the poorest 20% is 4.4%. According to the World Bank, people living below poverty line in Nigeria in 2012 was put at 46.0% while extremely poor people was estimated at 50.9% in 2013 compared to 44.9% in Namibia and 2.9% in Brazil. This development is very worrisome considering the fact that Nigeria is the seventh largest oil producing country in the world but yet harbors the largest population of poor people in sub-Saharan Africa (SSA). Looking at the area with the highest measure of welfare per capita, the leading area in Nigeria, which is Bayelsa with a poverty incidence of 26.2% between 1995 and 2006, is still below the leading areas in Ghana (Greater Accra -2.4%), Cameroon (Douala, Capital of Littoral -10.9%) and Baoteng in South Africa -19.0% (World Bank, 2008). In terms of human development index, Nigeria was ranked 51% compared to 58% for Ghana and 67% for South Africa (World Bank, 2014). Using selected world development indicators, the life expectancy at birth in 2010 for male and female in Nigeria was 46 and 47 years respectively or averagely 50.95%. In 2014, life expectancy stood at 52.8% for Nigeria compared to 61.4% for Ghana, 58.7% for DR Congo, 55.5% for Cameron and 59.7% for Togo.
Between 2000 and 2007, about 27.2% of children below five years of age were malnourished. This is alarming compared to 3.7% between the same periods in Brazil, another emerging economy (Aiyedogbon and Ohwofasa, 2012). Similarly, most of the public hospitals in Nigeria have been reduced to mere consulting clinics due to debilitating effect of corruption as fund meant for the sector were either siphoned or the projects corruptly executed. This has resulted in high mortality rate especially for women and children. For example in 2014, the mortality rate for children below five years of age per 1000 live birth was given as 74.3% for Nigeria. This situation is very ridiculous compared to the figures of 55.5% for Togo, 52.3% for Ghana, 60.8% for Cameron and 32.8% for South Africa. Corruption in Nigeria has denied the citizens the provision of critical infrastructures such as roads, affordable housing and hospitals etc. The implication is that a good number of able bodied youths are frustrated on the streets which have resulted in prostitutions, armed robbery, kidnapping as well as militancy. Notably, suicide rate in Nigeria is on the increase. According to the World Bank report, in 2012 the homicide rate per 100,000 people in Nigeria was 20.0% compared to 7.6% for Cameron, 6.1% for Ghana, 7.5% for Mali and 1.9% for Sierra Leone.
Another critical area where corruption is taking its tore on Nigerians is the power sector where billions of naira is being budgeted annually without a corresponding increase in power supply. Nigeria has the biggest gap in the world between electricity demand and supply, providing its population of over 160 million with less than 4000 megawatts of electricity. In contrast, South Africa with a population of less than 50 million people generates more than 40,000 megawatts while Brazil, an emerging market like Nigeria, generates over 100,000 megawatts for its 201 million citizens (FG, 2013). What is even more worrisome is that most Nigerians used their hard earned income to provide their personal power supply with the use of generators, yet they are made to pay outrageous electricity bills that do not exist. The installed capacity in Nigeria is about 8,000 megawatts but only 4,000 megawatts is operable of which about 1,500 megawatts is available to generate electricity. At 125 kwh per capita, electricity consumption in Nigeria is one of the lowest in the world (Ogagavwodia, Matthew and Ohwofasa, 2014).
Thus with dismal performance of all or major indicators of growth, the dream of the government to achieve sustainable economic growth will continue to be a mirage. It is for this reason that the study is undertaken. The objectives of the study are two folds: namely to examine the impact of corruption on poverty as well as impact of corruption on economic growth in Nigeria. The rest of the paper is structured as follows. Section two contains brief review of related literature. In section three, the methodology of the study is presented and whilst section four deals with data and discussion, section five concludes the paper with policy remarks.
2. The Literature
Corruption takes many forms and according to Transparency International, it is an abuse of entrusted power for private gain. According to Victor (2003), it is an unethical behavior that runs counter to the accepted social norms and moral values which seriously hurts public morality and leaves the society worse for it. The World Bank defines corruption as the abuse of public office for private gains through rent seeking activities when an official accepts, solicits or extorts bribes. Public office can also be abused for personal benefit even if no bribery occurs such as the theft of state assets or the diversion of state resources (Basu, Bhattacharya and Mishra, 1992). Thus, corruption is giving, offering or receiving gratification or bribe or some other form of illegal benefit. In Nigeria these include, but not limited to, trading Chieftaincy titles for financial or material benefits, examination scores for money, sexual gratification or other benefits. Refusal to do ones job unless and until the person
receives an inducement for himself or on behalf of any other person (Igbaekemen, Abbah and Geidam, 2014). Poverty is a complex phenomenon as it is defined in relation to income as well as multidimensional context. Relatively, it is often measured in terms of per capita gross domestic product (GDP). Extreme poverty is often defined as an income of less than $1 per person per day in terms of purchasing power parity (PPP). On the other hand, poverty defined in terms of multidimensional approach include (i) low income (ii) low levels of education and health (iii) vulnerability to health or income loss, natural disaster, crime and violence, and education curtailment and (iv) voicelessness and powerlessness (World Bank, 2001). While measuring poverty in terms of income level may seem relatively straightforward, the multidimensional approach is more complex and involves factors that are difficult to quantify. To manage this complexity, researchers have developed indices, such as the UNDP Human Poverty Index which views poverty in terms of longevity, knowledge and economic provisioning. Thus, World Bank (2001) summarizes the various dimensions as a lack of opportunity, lack of empowerment and a lack of security. The window of opportunity remains closed to the poor masses, and this makes them practically inactive in the society. Their lack of empowerment limits their choices in almost everything and their lack of security makes them vulnerable to diseases, violence and so on. In Nigeria, widespread and severe poverty is a reality such as lack of food, clothes, education and other basic amenities. Severely poor people lack the most basic necessities of life to the extent that one wonders how they manage to survive. Poor people in Nigeria face several health issues as they lack basic health amenities and competent medical practitioners (Chimobi, 2010).
From the empirical corridor, Gyimah-Brempong (2002) employs a dynamic panel data estimator in his analysis of of corruption, economic growth and income inequality in Africa countries. He found that corruption reduces economic growth directly and indirectly through decline in investment in physical capital. The study also found that increased corruption is positively correlated with income inequality and the combined effect implies that corruption adversely affects the poor more than the rich in African countries. In a similar study, Ugur and Dasgupta (2011) reported that the direct impact of corruption on growth is -0.7%. They also found that whilst the indirect effect through the public finance and human capital channels is -0.52%, the over-all effect of corruption on per capita gross domestic product growth is -0.59%. Thus, corruption has a harmful and real effect on growth in low income economies. Nwankwo (2014) scrutinizes the impact of corruption on the growth of Nigerian economy using granger causality and regression techniques. The study finds that corruption exerts negative impact on economic growth in Nigeria. Egunjobi (2013) examines the impact of corruption on economic growth in Nigeria from 1980-2009. The study utilizes OLS technique and granger causality test and finds that corruption per worker exerts negative influence on output per worker directly and indirectly on foreign private investment, expenditure on education and capital expenditure per worker. The study also found unidirectional causality running from output per worker to corruption per worker.
Similarly, Sunkanmi and Isola (2014) investigate the relationship between corruption and economic growth in Nigeria for the period, 1990-2010. Using co-integration and causality tests as well as Ordinary Least Square (OLS) method, they found a unidirectional causality running from corruption to economic growth. Also, they found that there is no significant relationship between corruption and economic growth in Nigeria. Nageri et al., (2013) examine the impact of corruption on economic development in Nigeria. The study uses corruption perception index as a proxy for corruption and OLS regression technique. They authors found that the impact of corruption on economic development in Nigeria is negative. Also, Studies by Obayelu (2007), Aliyu andAkanni (2008) and Igwike, Hussain and Noman, (2012) also found negative relationship between levels of corruption and economic growth in Nigeria thereby making it difficult for the country to develop fast. In a study by Action Aid International (2015), it was found that Nigeria scores high in the CPI and scores low in HDI implying that because the incidence of corruption is high, investment in citizens’ welfare is low leading to high level of poverty. The study also found that poverty levels in some states where State Governors were found to be guilty of misusing and converting public funds into private use is higher than in states where governors were judicious in the use of public funds. This suggests that if stolen resources were deployed to address the various poverty challenges in these states, the poverty rates should have declined below their present levels. Employing historical analysis supported by empirical evidence, Nwankwo (2013) found that official corruption has negatively affected the operations of poverty reduction efforts in Nigeria.
3. The Model
The study employed the OLS method to examine the relationship between corruption and poverty as well as impact of corruption on economic growth. The data used as proxy for corruption were sourced from TI (2015) while data of real GDP and incidence of poverty were culled from various issues of annual report and statement of account of Central Bank of Nigeria. All data covered the period of 1996-2016. Consequently, two models were specified as follows:
Model 1
In log stochastic term, equation (1) becomes
InPVTt = α0 + α1InCPIt + α2InCRt + µt………..…….(2) Model 2
GDP = f(CPI, CR)………...(3) Similarly, equation (3) becomes:
InGDPt = β0 + β1InCPIt + β2InCRt + εt………....(2)
Where: GDP = real gross domestic product at time t, proxy for economic growth, CPIt = corruption perception index at time t, CRt = corruption ranking at time t, PVT = incidence of poverty, α0 and β0 are constant while αi and βi are the parameters to be estimated and are expected to have negative relationship with economic growth. 4. Structure of economic grow, corruption and poverty in Nigeria
Table 1 shows the extent at which a country is corrupt where the maximum score between 1996- 2011 is 10% and from 2012-2015 is 100% with a minimum score of zero. The ranked shows the corrupt position of a country out of the total number of countries surveyed in the index. Accordingly, the CPI ranks countries based on how corrupt their public sector is perceived to be.
Table 1: Economic growth, corruption and poverty index in Nigeria
Year Growth rate Score(%) Ranked countries surveyed max score Incidence of poverty
1996 4.4 0.69 52 52 10 65.6 1997 2.8 1.76 52 52 10 65.6 1998 2.9 1.90 81 85 10 65.6 1999 0.4 1.60 98 99 10 65.6 2000 5.4 1.20 90 90 10 70.0 2001 8.5 1.0 90 91 10 70.0 2002 21.3 1.60 101 102 10 70.0 2003 10.2 1.40 132 133 10 54.4 2004 10.5 1.60 144 145 10 54.4 2005 6.5 1.90 152 158 10 54.4 2006 6.0 2.2 142 163 10 54.4 2007 6.4 2.2 147 168 10 54.0 2008 6.0 2.8 121 180 10 54.0 2009 7.0 2.5 130 180 10 54.0 2010 8.0 2.4 134 178 10 69.0 2011 7.4 2.4 143 182 10 71.5 2012 6.5 28 136 175 100 72.0 2013 6.4 25 136 175 100 74.4 2014 4.5 27 136 175 100 74.8 2015 4.5 27 136 175 100 75.3 2016 4.3 27 136 175 100 75.4
Sources: Transparency International (various years) and CBN annual report and statement of account (various issues)
A country’s score indicates the perceived level of public sector corruption on a scale of 0-10 or 0-100 as the case may be and where 0 means that a country is perceived as highly corrupt and 10 or 100 means that a country is perceived as very clean. Thus as Table 1 suggests, Nigeria has consistently featured at the bottom of the Table making the country among the most corrupt countries in the world. For instance, the score of 0.69 and 1.76 in 1996/97 placed Nigeria in 52nd and the last position among the countries surveyed in the index.
From 2012-2014, Nigeria was ranked 136 out of 175 countries, with a score of 28, 25 and 27 respectively. In the 2015 ranking, Nigeria was also ranked 136th least corrupt nation out of 175 countries. According TI, corruption rank in Nigeria averaged 118.30 between 1996 and 2015, reaching an all time high of 152 in 2005 and a record low of 52 in 1997. Accordingly, the report noted that the latest ranking, though better than its ranking of 143 out of 182 countries, with a score of 2.4% recorded in 2011, Nigeria is still categorized among some of the world’s most corrupt countries in the world (TI, 2015). Table one also shown that incidence of poverty in Nigeria is very high at it stood at over 70% in 2015.
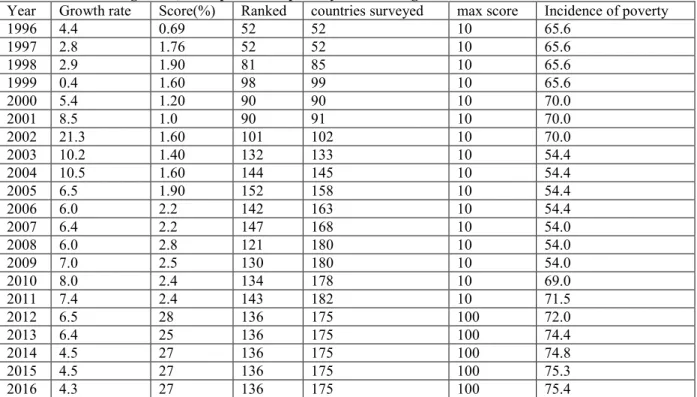
Fig 1: Trend of corruption index in Nigeria
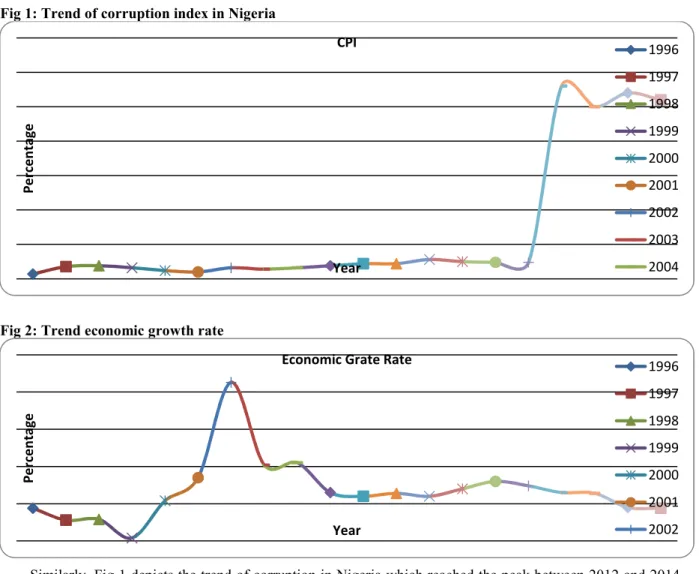
Fig 2: Trend economic growth rate
Similarly, Fig 1 depicts the trend of corruption in Nigeria which reached the peak between 2012 and 2014 as the level of corruption in this period was minds bungling. For instance, unconfirmed report had it that an ex-minister was said to have stolen over $6 billion. In Fig 2, the growth rate of the economy is revealed where the highest period was in 2002 and has been declining since then thus reflecting a state of comatose economy. Also, Fig 3 shows a very high level of poverty for the period under review.
Fig 3: Incidence of poverty in Nigeria
4.1 Presentation of empirical findings Table 2: unit root result
Variable Level 1st Diff 2nd Diff Order
GDP -1.95 -2.78 4.25 I(2) CPI -3.39 -3.97 -3.94 I(I) CR -4.12 -3.62 -4.12 I(2) PVT -1.32 -2.66 -3.94 I(2) C.V = 5% -3.69 -3.71 -3.73 Pe rc en tag e Year CPI 1996 1997 1998 1999 2000 2001 2002 2003 2004 Pe rc en tag e Year
Economic Grate Rate 1996
1997 1998 1999 2000 2001 2002 In ci de nc e of P ov er ty Year Level of poverty 1996 1997 1998 1999 2000 2001
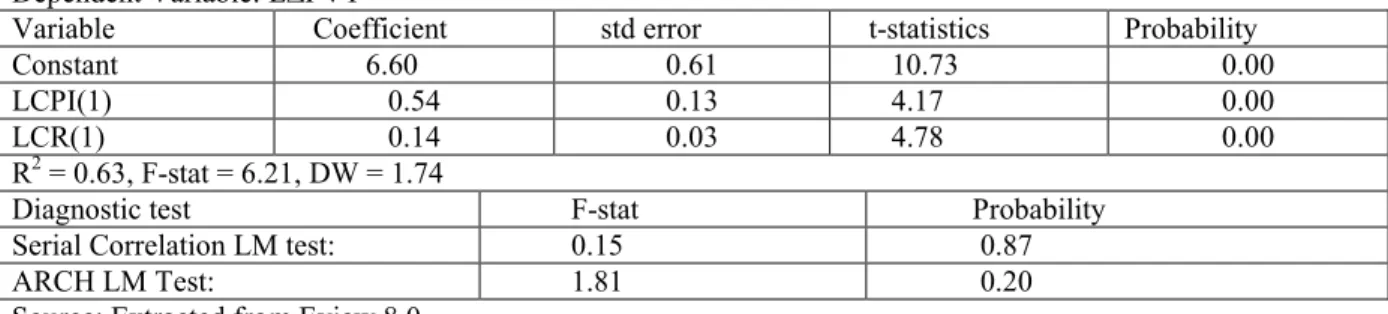
Table 2 depicts that CPI is stationary at first differencing while GDP, CR and PVT are stationary at integration of order 2. The test is conducted at 5% significance level. Table 3 presents the impact of corruption on poverty in Nigeria while Table 4 depicts impact of corruption on economic growth. The models are estimated by using the autoregressive process of order p to correct for presence of serial correlation. Consequently, the DW statistics show absence of serial correlation which is supported by battery of diagnostic tests. The R2 in Table 3 shows that the level of corruption explains about 63% variation in poverty in Nigeria while in Table 4; the independent variables explain 40% of economic growth.
Table 3: Cochrane Orcutt iterative estimation of model 1 Dependent Variable: L∆PVT
Variable Coefficient std error t-statistics Probability
Constant 6.60 0.61 10.73 0.00
LCPI(1) 0.54 0.13 4.17 0.00
LCR(1) 0.14 0.03 4.78 0.00
R2 = 0.63, F-stat = 6.21, DW = 1.74
Diagnostic test F-stat Probability Serial Correlation LM test: 0.15 0.87
ARCH LM Test: 1.81 0.20
Source: Extracted from Eview 8.0
Table 4: Cochrane Orcutt iterative estimation of model 2 Dependent Variable: L∆GDP
Variable Coefficient std error t-statistics Probability
Constant 5.46 5.31 -1.03 0.32
LCPI(1) -0.67 1.08 -0.62 0.55
LCR(1) -0.20 0.08 -2.33 0.04
R2 = 0.40, F-stat = 2.62, DW = 2.08
Diagnostic test F-stat Probability Serial Correlation LM test: 0.69 0.53
ARCH LM Test: 0.26 0.63
Source: Extracted from Eview 8.0
The F-statistics show that both models are statistically significant. Specifically, poverty is positively and significantly responsive to changes in corruption level, i.e, CPI (0.54%) and CR (0.14%) in model. On the other hand, economic growth in model 2 is negatively and significantly responsive to changes in CPI (0.67%) and CR (0.20%). Obayelu (2007), Aliyu and Akanni (2008), Igwike et al, (2012) as well as Nageri et al, (2013) have earlier reached similar founding.
The finding of the study is consistent with the present reality in the Nigerian economy. Corruption in Nigeria in the last 19 years has reached an alarming level that has defiled all known solutions. The quest to get rich quickly is very high and more so average Nigerian man is highly materialistic. For instance, in the administration of Goodluck Jonathan, a minister in the aviation ministry was said to have bought two BMW bullet proof cars at the cost of N255 million whereas the market price was N36 million each. In another unconfirmed report, it was alleged that about $122 million or N18.3 billion was withdrawn in questionable circumstances from the Bilateral Air Service Agreement (BASA) account of the aviation ministry and yet the ministry is saddled with a debt burden of over N100 billion.
In July 1999 it was reported by Financial Times of London how trillions of naira was stolen from the Nigerian treasury. The report indicted some key government officials among whom included Gen Sani Abacha alleged to have stolen over N1 trillion naira, Tom Ikimi about N0.3 trillion naira and T.Y. Danjuma over N0.3 trillion. This high level of funds misappropriation cut across all ministries from petroleum to power to education to agriculture to finance etc. Notably, funds meant for critical infrastructures like education, health, transportation and power were siphoned. The establishment of Economic and Financial Crime Commission (EFCC) and Independent Corrupt Practices and other related offences Commission (ICPC) did not help matter as these commissions were later used to witch hurt perceived political enemies rather than chase corrupt people. Consequently, economic growth was negatively affected even as poverty level worsened. A number of indices of development were also not speared. According to the World Bank, infant mortality rate per 1000 live birth stood at 88.4% in 2010 while life expectancy and literacy rate were 51 years and 60.8% in 2009 respectively. These are not too good statistics for an emerging economy such as Nigeria with abundant mineral wealth.
5. Conclusion and Recommendation
corruption has eaten deep to the extent that major economic indicators are negatively affected. Nigeria was ranked 136 out of 176 countries with a score of just 27 out of 100 on the 2015 CPI. It has been argued that corruption hits hardest at the poor in Nigeria who makes up more than 40% of about 180 million people. Global Financial Integrity reported that more than US$157 billion in the past decade has left Nigeria illicitly. Corruption is everywhere: even the health and medical services, considered the least corrupt government institution, are today very corrupt by 41% of Nigerians (TI, 2014).
Poorly equipped schools, counterfeit medicine and elections decided by money are just some of the consequences of public sector corruption. Bribes and backroom deals do not just steal resources from the most vulnerable - they undermine justice and economic development and destroy public trust in government and leaders. The major conclusion thus is that corruption is a problem for Nigeria and as such the country must kill corruption or the later will kill the country. The poor score in Table 1 is likely a sign of widespread bribery, lack of punishment for corruption and public institutions that do not respond to citizens’ needs.
It is therefore recommended that the anti-graft agencies (EFCC and ICPC) must been adequately funded and equipped to fight the war against corruption without government interference. Also, leading financial centers in the European Union and United States need to join hands with fast-growing economies to stop the corrupt from getting away with it. Finally, the G20 needs to prove its global leadership role and prevent money laundering and stop secret companies from masking corruption in Nigeria.
References
Abiodum, E. O. (2007). The effect of corruption and economic reforms on economic growth and development in Nigeria. Journal of Social Sciences and Finance, 2(1): 15-25.
Action Aid International (2015). Corruption and poverty in Nigeria: A report. Action Aid Nigeria.
Aiyedogbon, J.O. & Ohwofasa, B.O. (2012). Poverty and youth unemployment in Nigeria. International Journal of Business and Social Science, 3(20): 269- 279.
Aliyu, SU.R. & Akanni, O.E. (2008). Corruption and economic growth in Nigeria: 1986 -2007. MPRA paper, 12504. Posted 6 Jan, 2009 and retrieved from: http://mpra.ub.uni.muenchen.de/12505/
Basu, K., Bhattacharya, S. & Mishra, A. (1992). Notes on bribery and the control of corruption. Journal of Public Economics, 48: 349-359.
Chimobi, U. (2010). Poverty in Nigeria: Some dimensions and contributing factors. Global Majority E-Journal, 1(1): 46-56.
CIA (2009); The World FactBook. Washington, DC.
Egunjobi, T.A. (2013). An econometric analysis of the impact of corruption on economic growth in Nigeria. E3 Journal of Business Management and Economics 4(3): 54-65.
Federal Govrnment (2013). Nigeria power crises: Reversing decades of government monopoly and stagnation. Retrieved from: http://www.nigeriapowerreform.org
Gyimah-Brempong, K. (2002). Corruption, economic growth and income inequality in Africa. Economics of Governance, 3: 125-136.
Igbaekemen, G.O., Abbah, M.T. & Geidam, M.M. (2014). The effect of corruption on socio- economic development of Nigeria. Canadian Social Science, 10 (6): 149-157.
Igwike, R.S.,Hussain, M.E. & Noman, A. (2012).The impact of corruption on economic development: a panel data analysis. ResearchGATE retrieved 15 December, 2014 from: http://ww.researchgate.net/publication/228121173
Independent Corrupt Practices and other related offences Commission (2006). Nigeria and corruption. ICPC, Abuja.
Nageri, K.I., Gunu, U. & Abdul, F.A. (2013). Corruption and economic development: Evidence from Nigeria.
Kuwait Chapter of Arabian Journal of Business and Management Review, 3(2): 46-56.
Nwankwo, O. (2014). Impact of corruption on economic growth in Nigeria. Mediterranean Journal of Social Sciences, 5(6): 41-46.
Nwankwo, R.N. (2013). Official corruption and poverty reduction in Nigeria: A critical assessment, 2003-2010.
International Journal of Arts and Sciences,6(2): 305–329.
Obayelu, A.E. (2007, May). Effects of corruption and economic reforms on economic growth and development: Lessons from Nigeria. Being a paper presented at the African Economic Conference.
Ogagavwodia, J., Matthew, E. & Ohwofasa, B.O. (2014). Power supply and national development, 1980-2012: The Nigeria experience. International Journal of Humanities and Social Science, 4(8):144-154.
Sachs. G. (2007). Corruption remains Nigeria’s long term challenge. The Daily Independent Newspapers, Tuesday, 24 April.
Sunkanmi, O.A. & Isola, A.L. (2014). Corruption and economic growth in Nigeria. Journal of Economics and Sustainable Development, 5(6): 45-56. Retrieved from: http://www.iiste.org
Ugur, M. & Dasgupta, N. (2011). Evidence on the economic growth impacts of corruption in low-income countries and beyond:AsSystematic review. London: EPPI-Centre, Social Science Research Unit, Institute of Education, University of London.
Victor, B. E. I. (2003). Understanding Nigerian government and politics. Lagos: Newsacks publishing. World Bank.(2008); World Development Report 2009