DEBT, DONORS AND THE DECISION TO
GIVE
1
Thad Calabrese
School of Public Affairs, Baruch College, CUNY,
thad.calabrese@baruch.cuny.edu
and Cleopatra Grizzle
Robert F. Wagner Graduate School of Public Service
New York University
cc2664@nyu.edu
DRAFT: Please do not cite without permission. .
1An earlier version of this paper was presented at the Western Social Science Association, Public Finance and Budgeting Section, Reno, NV, April 13-16, 2010
Executive Summary
There has been a significant amount of work done on the
private funding of nonprofits. Yet, despite the enormous size of the
nonprofit sector as a whole, the importance of private donations to
the sector, and the significance of the sector to public finances,
there has been very little empirical research done on the capital
structure of nonprofit organizations, and none has examined the
potential effects of borrowing on individual contributions. Debt
might affect donations because programmatic expansion might
“crowd-in” additional donors, the use of debt might “crowd-out”
current donors since expansion is undertaken at the behest of the
organization (and not due to donor demand for increased output),
donors might have a preference for funding current output rather
than past output, or because of concerns that the nonprofit will be
unable to maintain future programmatic output. These potential
effects of debt on giving by individuals have not been the focus of
research to date.
The primary data for this paper come from the “The
National Center on Charitable Statistics (NCCS)-GuideStar National
Nonprofit Research Database” that covers fiscal years 1998 through
2003. The digitized data cover all public charities required to file
the Form 990. The final sample contains 460,577 observations for
105,273 nonprofit entities. The results for the full sample support a
“crowding-out” effect. The analysis is repeated on a subsample of
nonprofits more dependent upon donations, following Tinkelman
and Mankaney (2007). The restricted sample contains 121,507
observations for 36,595 nonprofit organizations. The results for the
subsample are more ambiguous: secured debt has little or no
effect, while unsecured debt has a positive effect. The empirical
analysis is then expanded to test whether nonprofits with higher
than average debt levels have different results than nonprofits with
below average debt levels. The results suggest that donors do
remove future donations when a nonprofit is more highly leveraged
compared to similar organizations.
Nonprofits may fear that the use of debt signals
mismanagement or bad governance, worrying that donors will
punish the organization by removing future donations. The results
presented here suggest a more complicated relationship between
nonprofit leverage and donations from individuals than this simple
calculus. On the one hand, increases in secured debt ratios (from
mortgages and bonds) seems to reduce future contributions,
possibly because donors are wary of government or lender
intervention in the nonprofit’s management, or possibly because of
the lack of flexibility inherent in repaying such rigid debt. On the
other hand, unsecured debt, while more expensive, seems to
crowd-in donations, even at increasingly higher levels when
compared to similar organizations.
There are at least two important conclusions from this
analysis. First, during times of fiscal stress, nonprofits are often
tempted to use restricted funds in ways inconsistent with donor
intent simply to ensure organizational survival. Rather than violate
the trust of certain donors, the results here suggest that nonprofits
would be better off utilizing unsecured (possibly short-term)
borrowing to smooth out cash flow needs. This option, however,
assumes that nonprofits have access to some type of borrowing
which is not true for many organizations. A second conclusion one
might draw, therefore, is that policy considerations should be made
to expand access to debt for nonprofits. The results here suggest
that certain types of unsecured debt might in fact draw in
borrowings for additional resources. By encouraging this type of
policy option, nonprofits would not only gain access to increased
revenue sources, but might be able to maintain programmatic
output during times of fiscal stress.
INTRODUCTION
The U.S. nonprofit sector includes an incredible number of institutions engaged in a diverse range of activities. At the end of 2007, there were approximately 1.4 million nonprofit organizations registered with the Internal Revenue Service (IRS).2 According to the annual report on charitable giving released by Giving USA 2008, nonprofit organizations in the United States received over $306 billion in charitable contributions from individuals, foundations, and corporations in 2007, an increase of 3.9 percent from 2006 after adjusting for inflation.
Individuals, who serve as the principal donors to the nonprofit sector, gave more than $252 billion in 2007 - over 80 percent of all donations to the sector - representing approximately 18% of total sector revenues. In addition, according to the Current Population Survey of September 2008, about 61.8 million people, or 26.4 percent of the population, volunteered with a nonprofit at least once in the past year. The importance of individual giving (in terms of time and money) to the sector is evident.
There have been a significant number of analyses on the private funding of nonprofits. This importance of private donations to nonprofits makes it extremely important to understand what motivates donors to give, what information is used by donors to make these decisions, and how nonprofit managers can position their organizations to maximize funding opportunities. Further, federal tax receipts alone were reduced an estimated $47 billion in
2
Nonprofit Almanac 2007, prepared by the National Center for Charitable Statistics at the Urban Institute (Urban Institute Press).
2008 due to the deductibility of charitable giving from federal tax liability; this represented the sixth single largest tax expenditure in the federal budget.3 Therefore, the determinants of private giving are a significant public policy concern as well, given the large public investment in the sector.
Despite the enormous size of the nonprofit sector as a whole, the importance of private donations to the sector, and the significance of the sector to public finances, there has been very little empirical research done on the capital structure of nonprofit organizations, and none has focused on the potential effects of borrowing on individual contributions. Debt might affect donations because programmatic expansion might “crowd-in” additional donors, the use of debt might “crowd-out” current donors since expansion is undertaken at the behest of the organization (and not due to donor demand for increased output), donors might have a preference for funding current output rather than past output, or because of concerns that the nonprofit will be unable to maintain future programmatic output. These potential effects of debt on giving by individuals have not been the focus of research to date.
The empirical analysis first determines whether secured or unsecured borrowing4 by nonprofits influences future contributions. The results for the full sample support a “crowding-out” effect. When the analysis is repeated on a subsample of nonprofits more dependent upon donations, the results are
3
Data derived from FY2010 Budget of the U.S. Government.
4
Throughout this paper, “secured” borrowing refers to debt that generally is backed by as asset – such instruments are bonds, mortgages, and notes. “Unsecured” borrowing, in contrast, generally is not backed
more ambiguous: secured debt has little or no effect, while unsecured debt has a positive effect.
When the empirical analysis controls for higher than average leverage, secured debt seems to crowd-out donations, but unsecured debt has a significantly positive crowd-in effect on contributions. These results for unsecured debt are found on our subsample of donative nonprofits as well. Rather than debt or borrowing being viewed by donors as a signal of bad management, the results suggest a more complicated relationship. Specifically, the results suggest that donors react positively to unsecured debt – which is generally more expensive and may be more likely to be used for noncapital purposes – while reacting negatively or are indifferent to secured debt; yet secured debt is generally less expensive and involves more external oversight from lenders.
This paper informs the literature in two ways. First, the findings indicate that how a nonprofit finances its assets and operations is relevant for individual donors. Just as investors in for-profit firms assess these capital structure decisions (because of the inherent effect on firm value), donors also find such leverage decisions important in determining how to allocate their contributions within the nonprofit sector. Second, the findings show that donors value different types of borrowing differently. Almost paradoxically, donors seem to reward nonprofits that assume greater levels of unsecured debt even though it is more expensive and possibly less likely used for capital purposes.
The remainder of the paper is organized as follows: The next section reviews the existing literature and begins with a brief discussion of what motivates donors to give. The next major sections present the theory and hypotheses, methodology, data and sample selection process. The results, discussions, and conclusions round out the paper.
LITERATURE REVIEW
Much of the existing research on the private funding of nonprofits by individuals addresses one of the following three questions: (1) Who gives? (2) Why do people give? and (3) How do people decide where to allocate their donations? . In the first strand of the literature, researchers look for links between philanthropy and characteristics of households and individuals. Factors found to explain charitable giving are diverse, including the desire for social standing (Ostrower 1995), educational attainment (Kingma 1989, Gruber 2004, Houston 2006), educational field (Brown 2005, Hillygus 2005), home ownership (Todd and Lawson 1999, Banks and Tanner 1999), income (Clotfelter 1980, Van Slyke and Brooks 2005), age (Bielefeld and Beney 2000), marriage status (Andreoni and Scholz 1998, Brooks 2005), and the number of children in a household (Auten and Rudney 1990). The empirical analyses in this tradition focus on the demographics of donors.
Researchers analyzing the second question study the determinants of philanthropy. This strand of the literature identifies a number of mechanisms as primary determinants of why giving occurs with no obvious financial benefit for the donor. Research suggests that donors give in response to being asked
(Cheung and Chan 2000, Lee and Farrell 2003, Bekkers 2005), to obtain the tax benefits of donations (Duquette 1999, Romney-Alexander 2002), and in response to matching grants from employers (Okunade and Berl 1997). As in the first tradition, empirical analyses focus on individual characteristics.
This literature has also examined whether donors react to nonprofits’ other revenues in determining whether or not to give. For example, in the education and arts subsectors, Brooks (2000a) and Brooks (2000b) find relationship between government support and private donations, while a number of other studies have found evidence of crowding out of donations by government support (Kingma, 1989, Day and Devlin, 1996, Hughes and Luksetich, 1997). Unlike the donor motivation studies, empirical analyses in this line of research have focused on the characteristics of individual nonprofit organizations rather than of donors.
The third strand of the literature, and perhaps the most relevant for the purpose of this paper, has examined the effects of information derived from nonprofit financial disclosures on private donations. This literature seeks to determine what information donors find relevant in deciding which organizations shall receive contributions. For example, Weisbrod and Dominguez (1986) find that efficiency, advertising, and quality are important determinants of individual giving to a nonprofit. Tinkelman (1998) finds that financial quality and ratings from a watchdog agency also affect donors’ choice in giving, providing further empirical support that nonprofits that report more efficient results are rewarded with increased donations. These findings are
supported by Tinkelman (1999), Greenlee and Brown (1999), Marudas (2004), Tinkelman (2004), and Tinkelman and Mankaney (2007). Frumkin and Kim (2001), however, find no such effect in their own study.5 Recent research by Gordon et al. (2009) and Sloan (2009) has further examined the effect of watchdog ratings’ on donations, and Kitching (2009) finds that donors are willing to give more to charities aligned with a quality auditor. This literature analyzes which characteristics of nonprofits predict contributions from individuals.
Separate from the literature on individual giving to charities outlined above, researchers have investigated nonprofit debt usage. Authors have explored which nonprofits use bonds or mortgages (Denison 2009), the determinants of borrowing (Jegers and Verschueren 2006), whether endowment accumulation influences capital structure (Bowman 2002), whether revenue portfolios influence the use of debt (Yan et al. 2009), and the arbitrage opportunities available to nonprofits that use tax-exempt borrowing to finance capital (Wedig et al. 1996, Gentry 2002). Rather than the relevancy of accounting information, this literature focuses on strategic and operational financial management aspects of nonprofits; similarly, these analyses focus on nonprofit organizational characteristics as well.
This study attempts to link the private funding of charities and the nonprofit debt literatures to determine whether the use of debt – both secured and unsecured – influence contributions from donors to nonprofit organizations.
Specifically, we argue that how nonprofits finance themselves may be relevant for donors’ decisions about how their contributions are allocated within the sector. As the importance and scale of giving to nonprofits continues to grow each year, it becomes increasingly important to understand what motivates donors’ decisions. Leverage can lead to greater financial risk and exposure to market volatility; leverage also creates opportunities for quicker and larger expansion of existing or new programs. Whether financial information disclosures on nonprofit borrowing and long-term debt influence donors’ decisions to give is an area that has not been studied in the literature. This paper begins to fill this void and provides empirical evidence that may help inform the decisions made by policy makers and nonprofit managers.
THEORETICAL FRAMEWORK AND HYPOTHESES
While some nonprofits may consider it financially prudent to borrow little or not at all, financial theory indicates using debt for capital expenditures (on property, plant, and equipment) or business expansion may be appropriate – thereby amortizing the costs over the life of the investment and matching the benefits with the costs. In addition to long-term capital or business expansion, Yetman (2007) also indicates that nonprofits use debt to smooth short-term working capital needs and to refinance existing debt.
Drawing on earlier research – such as Okten and Weisbrod (2000) who find donors react negatively to nonprofits increasing fund-raising expenses - we posit that if donors pay attention to nonprofit financial information, then an increase in debt financing might have either a positive or negative effect on
donations. We develop a framework for conceptualizing the potential effects borrowing might have on individual contributions. The framework categorizes these potential effects into three broad categories: expansion, donor preferences, and bankruptcy concerns.
Expansion
To finance capital acquisitions or capitalize new business opportunities, nonprofits can choose to expend retained earnings (net assets), use current operating resources (PAYGO), or borrow. As Bowman (2002) points out, many nonprofits lack the ability to take on formal long-term financing instruments (such as mortgages, bonds, or notes), relying instead on short-term instruments (lines of credit, payables, etc.). The use of debt by nonprofits allows organizational expansion in the current period without the need to either fundraise from donors or provide goods and services to clients. The use of debt may allow for expansion, thereby crowding-in additional donors (or by increasing contribution levels from existing donors) as programs and output expand (reaching more clients or new clients altogether). Alternatively, using debt rather than contributions for expansion may result in a nonprofit reallocating fund-raising costs to debt service costs; with advertising decreased, the contributions literature would suggest that donations too would decrease. Hence, the predicted effect on contributions from expansion using debt is ambiguous.
Donor Preferences
Nonprofit debt levels might also crowd-out donations from donors who have a preference for their gifts to be spent on current (rather than past) program provision (Yetman 2007). Further, debt might allow a nonprofit to acquire capital and expand, with minimal or no input from donors. On the other hand, a PAYGO strategy (such as a capital campaign) would require donors to approve of the proposed expansion by funding it through contributions. Hence, the use of debt in expansion may shift the decision from donors to the nonprofit, and donors may prefer to fund organizations that seek their input.
Similarly, debt allows a nonprofit to pursue particular programmatic expansion; this determination is made by the nonprofit (whether the board or managers). Donors might wish for different programmatic expansion, and the use of debt shifts that decision calculus from individual donors to the nonprofit. Donor preference (whether for current programs, the choosing of specific programs, or the expansion of specific programs) indicate that debt might crowd-out donations.
Bankruptcy/Financial Vulnerability
Donors prefer to fund nonprofits that are “going concerns” (Parsons 2003). Donors might become concerned that increasing leverage is a sign of financial vulnerability and reductions in future programmatic output. Donors might deem nonprofits with debt measures exceeding comparable peer organizations riskier investments. Debt, then, might signal to donors that a
particular nonprofit is (or is potentially) insolvent, thereby crowding-out donations from individuals.
Donors might also differentiate between debt that is secured by an asset (such as tax-exempt bonds and mortgages) and debt that is unsecured (such as accounts payable, accrued liabilities for employees, as examples). In the former, lenders or municipal governments monitor organizational borrowing, possibly indicating that the nonprofit’s financial vulnerability has been positively assessed; on the other hand, in the case of unsecured debt, a nonprofit might simply be unable to pay current vendors and employees, indicating potential financial problems (especially liquidity concerns). Donors might respond to such issues by removing future donations (indicating an inverse relationship between unsecured debt and contributions) or by increasing donations to ease such liquidity issues (indicating a positive relationship between the two).
Hypotheses
The foregoing discussion leads to the following testable hypotheses, stated in null form:
H1: Prior usage of debt by nonprofits does not influence current-year contributions.
H2: Different types of debt used in prior periods do not differentially influence current-year contributions.
H3: Debt levels in excess of industry averages do not influence current-year contributions.
DATA, METHODOLOGY AND SAMPLE SELECTION PROCESS
Model Specifications
We test a variation of the log-linear contributions model used and variously modified by Weisbrod and Dominguez (1986), Posnett and Sandler (1989), Tinkelman (1998), Greenlee and Brown (1999), Tinkelman (1999), Frumkin and Kim (2001), Marudas (2004), Tinkelman (2004), Tinkelman and Mankaney (2007), and Jacobs and Marudas (2009), among others, adding a variable for nonprofit secured liabilities (that is, those liabilities that are securitized, such as bonds, mortgages, and notes) and other nonprofit liabilities (such as payables, accrued liabilities, etc.).6 The basic model first tested can be specified as:
lnCONTt = 0 + 1lnSECURt-1 + 2lnUNSECURt-1 + 3lnPRICEt-1 + 4lnFREXPt-1 +
5lnAGEt-1 + 6lnASSETSt-1 + 7lnGOVTt-1 + 8lnPROGREVt-1 +
9lnOTHREVSt-1 + YEARt + SUBSECTORt + I
(1) where
lnCONTt = the natural logarithm of the dollar amount of direct contributions
received by the nonprofit from individuals during the year. lnSECURt-1 = the natural logarithm of total tax-exempt bond liabilities and
mortgage liabilities at the end of the prior year/total assets at the end of the year.
6
The model has taken different forms by different researchers. Some have replaced the PRICE variable with other efficiency ratios – such as administrative and fund-raising ratios – depending on the particular research question of interest.
lnUNSECURt-1 = the natural logarithm of all other liabilities at the end of the
prior year/ total assets at the end of the year.
lnPRICEt-1 = the natural logarithm of the ratio of total expenses/program
expenses in the prior year.
lnFREXPt-1 = the natural logarithm of the nonprofit’s total fundraising
expenses in the prior year.
lnAGEt-1 = the natural logarithm of the number of years the nonprofit has
been registered with the Internal Revenue Service in the prior year.
lnASSETSt-1 = the natural logarithm of total assets at the end of the prior
year.
lnGOVTt-1 = the natural logarithm of government grants in the prior year.
lnPROGREVt-1 = the natural logarithm of program revenue in the prior year.
lnOTHREVSt-1 = the natural logarithm of all other revenues in the prior year.
YEARt = a dummy variable for each year 1999 – 2002, with 2003 the
excluded time period.
SUBSECTORi = a dummy variable for each 25 National Taxonomy of Exempt
Entities industry, with “Unknown” the excluded subsector.
The dependent variable measures the public’s demand for a nonprofit’s output (Okten and Weisbrod 2000). The variable lnPRICEt-1 measures how much
a donor would have to donate to generate a dollar of output (Jacobs and Marudas 2009). Fund-raising expenses have been shown to influence future donations, similar to advertising in the private sector (Gordon et al. 2009). lnAGEt-1 is a proxy for a nonprofit’s stage of growth (start-up, growth, etc.),
since donors may view younger organizations differently than more established older ones (Tinkelman 1999). The asset variable is a size control, since smaller organizations may have lower quality financial reporting (Tinkelman 1999). The revenue variables are included since existing research has shown their influence on crowding-in and out of future donations. All independent and control variables are lagged, as in Frumkin and Kim (2001) and Tinkelman and Mankaney (2007).
Equation 1 allows us to determine whether there is a significant elasticity of borrowing with respect to contributions, and whether different types of borrowing (secured versus unsecured) affect contributions differently. The specification is enhanced to test the hypothesis regarding donor concerns regarding borrowing in excess of peer organization averages to test our hypothesis regarding financial vulnerability.
Data
The primary data come from the “The National Center on Charitable Statistics (NCCS)-GuideStar National Nonprofit Research Database” (hereafter called the “digitized data”) that covers fiscal years 1998 through 2003. The digitized data cover all public charities required to file the Form 990. All financial data are adjusted for inflation using the Consumer Price Index (CPI). Certain observations were eliminated from the original sample of nearly 1.4 million observations. Following Tinkelman and Mankaney (2007), observations with erroneous ruling dates, missing data, and obviously incorrect data7 were eliminated. Further, only observations that report their 990 data on the accrual basis of accounting were retained, since cash basis reporters would not report liabilities. Organizations that did not report any contributions or any total liabilities in any of the sample years were also eliminated. The digitized data is verified by the NCCS; any flag indicating that errors were in excess of 25 percent of the examined line item were also eliminated. The final sample
7
This includes observations reporting negative asset or liability accounts, fund-raising or administrative expenses equal to zero, and ratios in excess of 100 percent. 2 observations were eliminated since the nonprofit reported total assets of nearly $800 billion.
contains 460,577 observations for 105,273 nonprofit entities, approximately 33 percent of the original sample.
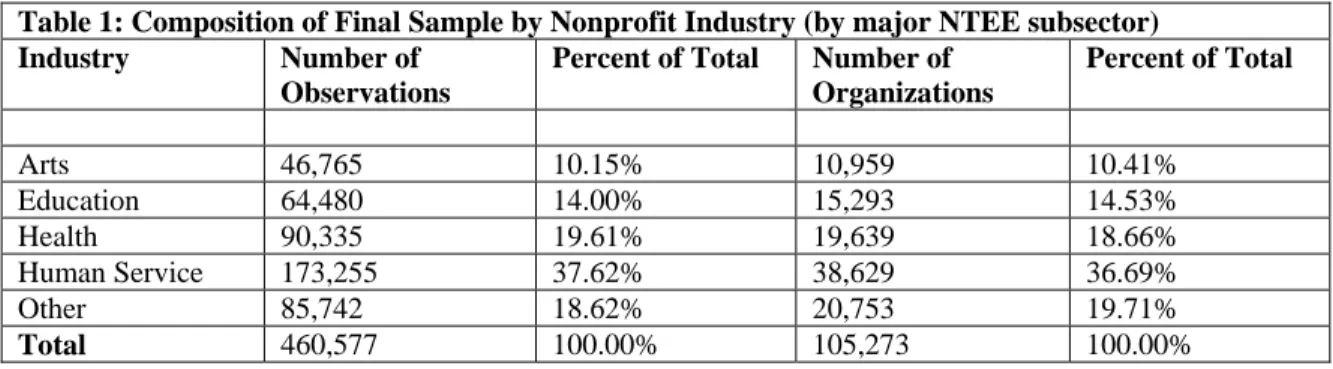
[Table 1, about here]
Table 1 describes the composition of the final sample. The five nonprofit industry subsectors – Arts, Education, Health,8 Human Service,9 and Other10 – is based on the classification system used on the Form 990. The Human Service subsector is by far the most represented industry in the final sample, while Arts is the least.
We also estimate equation 1 on a “restricted sample,” as in Tinkelman and Mankaney (2007). The restricted sample is limited to those observations reporting administrative and fund-raising expenses of more than $1,000, that are at least four years old, that have received more than $100,000 in donations in the prior year, and that have received donations equal to 10 percent or more of last year’s total revenue. The restricted sample contains 121,507 observations for 36,595 nonprofit organizations, or approximately eight percent of the original sample and 26 percent of the retained sample. The restricted sample is described in Table 2. The donative restricted sample is slightly more weighted towards Arts and Other nonprofits, while Health and Human Services are less represented when compared to the full sample.
8
Health includes mental health/crisis intervention, diseases/disorders/medical discipline, and medical research.
9
Human Service includes crime/legal-related, employment/job-related, food/agriculture/nutrition, housing/shelter, public safety, recreation/sports/leisure/athletics, and youth development.
10
Other includes environmental quality/protection/beautification, animal-related, international/foreign affairs/national security, civil rights/social action/advocacy, community-improvement/capacity building, philanthropy/voluntarism/grantmaking foundations, science and technology research institutes/services, social science research research institutes/services, public/society benefit, religion related/spiritual
[Table 2, about here] [Table 3, about here]
Table 3 contains descriptive statistics for the full sample. The high level of dispersion in the sample values is evident, as demonstrated by the high standard deviations in most variables. Importantly, the sample used in the present analysis has a median Total Assets (the size measure for the regression analyses) of $776,000, and a mean of $12.8 million. The average size is much smaller than reported values in the Statistics of Income (SOI) file used in several other nonprofit studies; in fact, the SOI includes primarily only large nonprofits. For example, Marudas (2004) reports mean total assets of $77 million and higher in his analysis based on the SOI data. The average size of the organizations in the final sample from the digitized data is still large, but is more representative of the sector as a whole than the SOI data in general. Interestingly, the nonprofit sector does not seem highly leveraged, given the descriptive statistics.
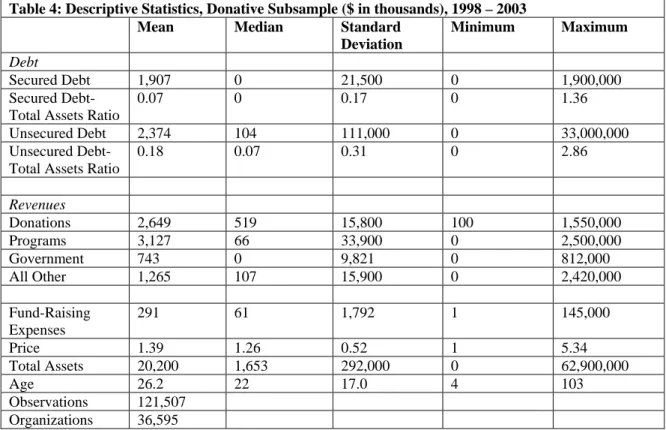
[Table 4, about here]
Table 4 displays the descriptive statistics for the restricted subsample. Organizations in the restricted sample are, on average, larger (when measured by total assets) than the full sample, as well as older. The donative subsample also appears to be much less leveraged than the whole sample. Secured debt ratios are only seven percent in the donative sample, versus 12 percent in the total sample; similarly, unsecured debt is reported at 18 percent, versus 24 percent for the entire sample.
[Table 5 about here]
Table 5 describes the means and standard deviations of the variables by major subsector. Donations are most concentrated within the Education subsector, while debt (both secured and unsecured) is highly concentrated within Education and Health – not surprising given their high capital demands. Further, the Education and Health subsectors report larger average sizes than the other subsectors. The average secured debt-to-asset ratio is only 7 percent in the Other subsector, while Human Services reports a 14 percent average ratio. The Arts subsector, which reports a low 8 percent secured debt-to-asset ratio has a 28 percent unsecured debt-to-asset ratio.
[Table 6, about here]
When restricting the descriptive statistics to the donative subsamples of each industry (Table 6), the average Education nonprofit is much larger and holds more debt (both secured and unsecured) than the other subsectors. Interestingly, this subsector holds the highest average ratio of secured debt while reporting the lowest average ratio of unsecured debt. This might indicate that donative education nonprofits are better able to access traditional financial debt instruments than other nonprofits, perhaps due to larger average organizational size, higher average age (giving it more reputation among lenders), or perceived stability of earned income. The donative Arts subsample again reports the highest ratio of unsecured debt-to-assets and one of the lowest secured-debt ratios.
The significant differences between the means and medians indicate that the sample is positively skewed and not normally distributed. To address this issue, we transform all variables into natural logarithms so that the effects of outliers are minimized. Due to the panel structure of the data, clustered robust standard errors are calculated to allow for correlation within each nonprofit organization while being independent between nonprofits, and also addresses autocorrelation in the observations.
A fixed effects regression is desirable for estimating equation 1, since important but unmeasured variables might be controlled (such as the professionalization of the nonprofit’s management – especially the financial manager, the Board’s tolerance for debt, and the organization’s relationships with lenders). Research indicates that some nonprofits do not accurately report fund-raising expenses (Trussel 2003, Krishnan et al. 2006, Keating et al. 2008). Prior research by Marudas (2004) finds the SOI database (which is not used in our analysis) to be affected by such measurement error; this finding makes fixed effects estimators using the SOI database problematic since these estimators are much more sensitive to data errors (Tinkelman 1999, Marudas 2004, and Tinkelman and Mankaney 2007).11 In fact, Marudas (2004) determines that the extent of such measurement error rendered it impossible to obtain consistent coefficients with a fixed effects estimator. The variables lnPRICE and lnFREXP are defined using fund-raising expenses, making them possibly mismeasured, and such measurement error has the potential to bias the
11
An excellent and clear explanation of the sensitivity of fixed effects models to measurement error is found in Note 1 of Tinkelman and Mankaney (2007).
coefficients of the independent variables. The results for our variables of interest (lnSECUR and lnUNSECUR), then, might have biased coefficients. Hsiao (2002) derives a method for estimating the measurement error of an independent variable; however, the existence of multiple mismeasured explanatory variables makes deriving consistent results unlikely (Wooldridge 2002).12 As in the extant literature, therefore, we estimate equation 1 using levels rather than fixed effects. In all estimations, variance-inflation-factors (VIFs) were calculated to determine whether multicollinearity was influencing the coefficients. In all estimations, VIF scores were 5 or below on the independent variables included in the estimation, indicating that multicollinearity is not biasing the results.
RESULTS AND ANALYSIS
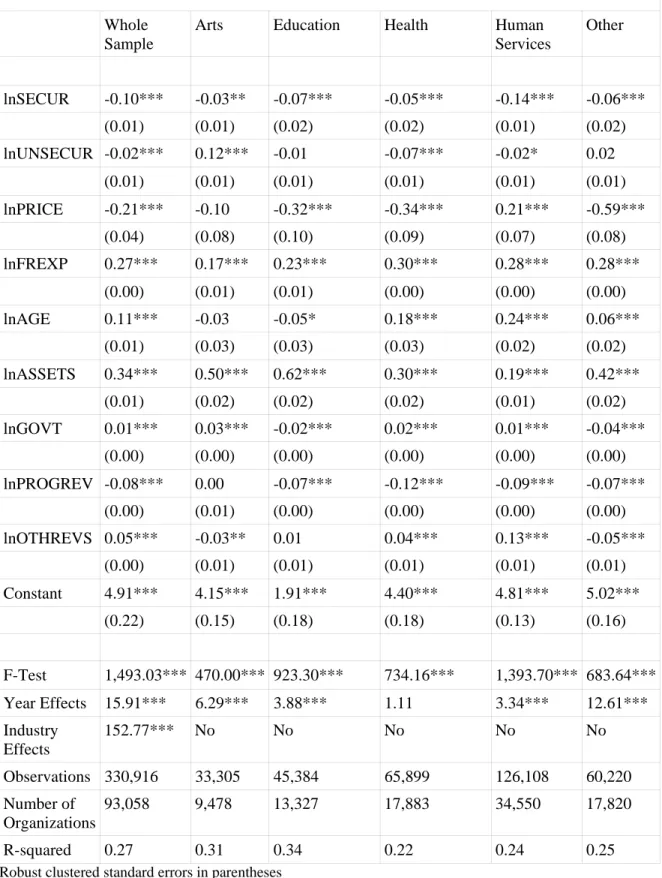
The results of our initial estimation are presented in Table 7. The results for the whole sample indicate a “crowding-out” effect, that increased borrowing – both secured and unsecured – reduce subsequent donations from individuals. This finding provides empirical support for hypothesis 1, that debt influences contributions to nonprofits. The results for lnSECUR are consistently
12
Hsiao (2002) points out that panel data can overcome measurement error by utilizing prior period lags if enough years of data exist. These predetermined lags serve as instrumental variables and also provide consistent beta estimates. However, this instrumental variables approach is only valid if the measurement error is i.i.d., and the existing literature has shown that nonprofit reporting quality is correlated with size (Tinkelman 1999). Further, in this case, the lags themselves are likely measured with error, since a
nonprofit likely to report fund-raising expenses errorneously – whether purposely or not – is likely to do so repeatedly. Despite these concerns, equation 1 was also estimated using a 2-stage least squares regression, using the second lags of logPRICE and logFund_Raising as instrumental variables. Results were
qualitatively similar to those presented here. Since the technique is not necessarily valid given the nature of the potential measurement error, the results are not presented here.
negative and significant across the various nonprofit subsectors; lnUNSECUR, however, is only negative and significant at the 5 percent level for the Health subsector. In fact, the Arts subsector reports a significant “crowding-in” effect from unsecured debt. The differences in coefficients provide empirical support for our second hypothesis, that different types of debt affect contributions differently. Perhaps surprisingly, the initial results indicate that debt that is secured by assets (such as mortgages and bonds) do crowd-out future donations, while unsecured debt – which is oftentimes more expensive and not necessarily used to finance capital acquisition – in many subsectors has either no effect or a positive effect on donations. This may indicate that donors respond to nonprofit liquidity issues by increasing contributions.
[Table 7, about here]
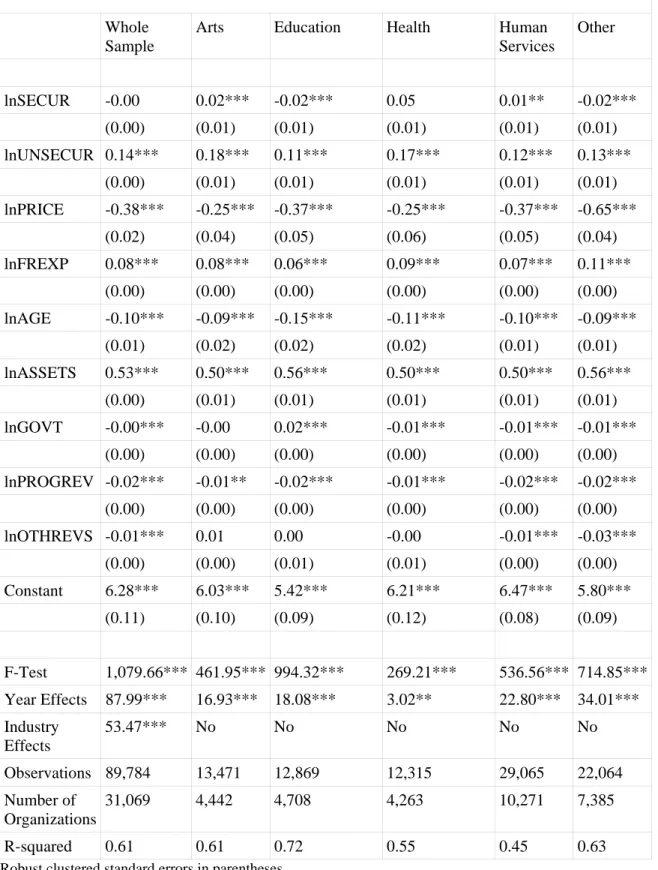
Table 8 presents the results of the more restricted sample that is more donative in nature.
[Table 8, about here]
Results from these nonprofit organizations that are more dependent upon contributions show very different results from those in Table 7. Secured debt has almost no effect on donations, while unsecured borrowing seems to have a crowding-in effect. While the coefficients on lnSECUR vary in significance and direction across subsectors, lnUNSECUR is consistent and positive across all five subsectors. Again, these results confirm that debt does influence contributions (hypothesis 1), and that different types of debt have
different effects (hypothesis 2); this also supports the explanation that donors seem to respond to liquidity issues by increasing donations to nonprofits.
The results suggest that increasing borrowing – especially short-term, unsecured borrowing – will have a positive influence on contributions from individuals. The logical conclusion to this finding is that nonprofits ought to keep increasing their indebtedness because donors will increase their donations. This initial model assumes that debt only has a main effect on contributions; it ignores the possibility that donors may remove donations as debt levels increase, due to concern about the entity’s financial vulnerability (hypothesis 3).
[Table 9, about here]
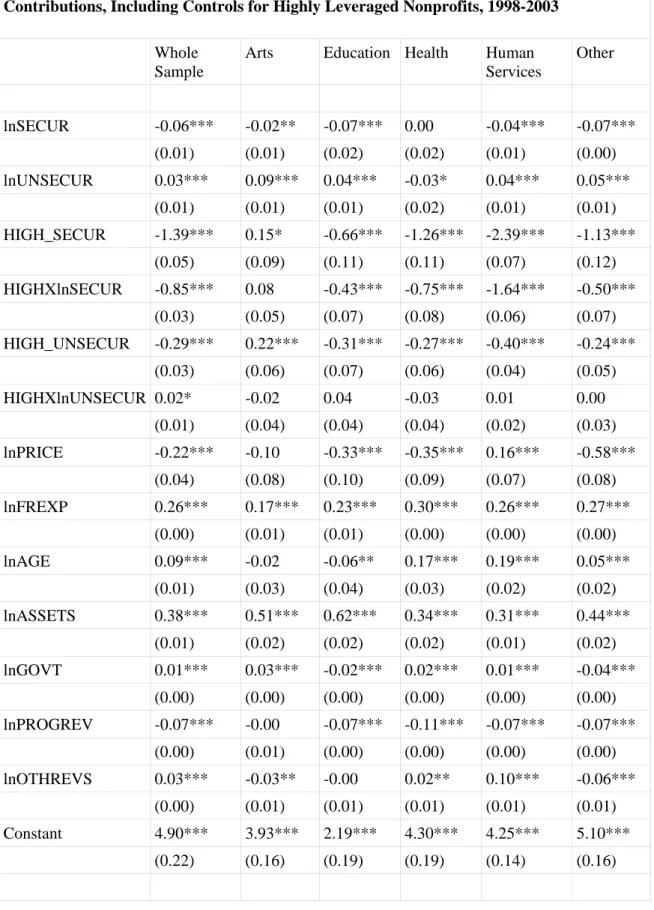
These concerns are tested by adding indicator variables (HIGH_SEC and HIGH_UNSEC), in which 1 indicates the nonprofit reports a leverage ratio (Total Secured Liabilities/Total Assets, or Total Unsecured Liabilities/Total Assets) in excess of its subsector’s mean ratio, and 0 indicates that the nonprofit is at or below the mean. Further, interaction terms between our debt variables and the indicator variables are included as well. The results from this specification are displayed in Table 9. The results indicate that increasing secured debt levels do have a significant effect on future donations. The coefficient on HIGH_SECUR indicates that having a secured debt-to-assets ratio in excess of other similar organizations reduces future contributions by nearly 1.40 percent. The effect is further intensified since the interaction term (HIGHXSECUR) is
significant and negative. Except for the Arts subsector, the results are consistently negative and significant across subsectors.
Having unsecured debt ratios in excess of industry averages also reduces future contributions, but the effect is smaller compared to the secured debt variable. Further, the lack of significance on the interaction term (HIGHXUNSEC) is indicative that there is only a main effect (that is, it does not intensify with increased debt ratios). These results suggest that donors are perhaps unconcerned with unsecured liabilities incurred by a nonprofit (perhaps used for routine cash flow needs), but they remove future donations as these liabilities increase to levels in excess of similar organizations. Coupled with the strong effects on the HIGH_SECUR variable, these results lend support to the notion that donors do remove future donations from organizations with debt levels in excess of industry averages, perhaps due to concerns that the nonprofit will be unable to provide future services at the same level due to financial constraints from debt.
[Table 10, about here]
Table 10 tests the same model used in Table 9, but restricts the sample to donative nonprofits. The main effect on lnSECUR is no longer significant, again indicating that bonds and mortgages do not themselves cause donors to remove their contributions. However, the indicator variable (HIGH_SECUR) is negative and significant, as is the interaction term. The coefficients are much lower than in the full sample, however. Individual donors, then, only seem to reduce their future contributions when organizations take on more debt than
similar organizations. On the other hand, having higher than average unsecured debt actually results in more contributions (although the interaction term is again not significant), again suggesting donors respond to nonprofit liquidity needs through increased contributions.
DISCUSSION
The results presented here suggest a complicated relationship between donors and nonprofits when debt is used as part of the organization’s financing plans, and the relationship is even more complicated when differentiating between donative and commercial nonprofits. The results for all the estimations indicate that mortgages and bonds have either no effect or a negative effect on future contributions. Although such debt is not available to many nonprofits, the results are somewhat surprising. Nonprofits with bonds and mortgages have essentially been vetted by external stakeholders who have decided that the projects are financially or socially valuable. In this respect, donors only concerned with the financial vulnerability of a nonprofit should be reassured that the organization is strong and making good financial decisions. But the results suggest that donors are either indifferent or react negatively to the use of such financial instruments.
One explanation might be that donors may be concerned that adding a lender or government (in the case of tax-exempt bonds) into the financial management of the nonprofit will result in organization mission drift. Research suggests that how nonprofits finance themselves influence mission and
organizational priorities (Froelich 1999, Moore 2000, Chaves et al. 2004), and the results here may be indicative of these prior findings. In other words, donors may be concerned that introducing a new stakeholder such as a lender or government – or expanding the importance of this stakeholder with increased leverage – will alter the nature of the nonprofit to which they give. In response, donors remove future donations. As these debt instruments increase as a financing tool for the organization and outpace comparable organizations, the results indicate an increasingly negative effect on donations – which is consistent with this understanding of structured debt instruments.
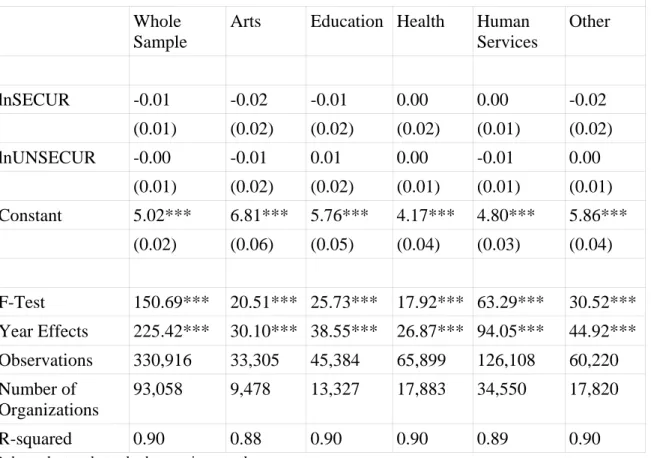
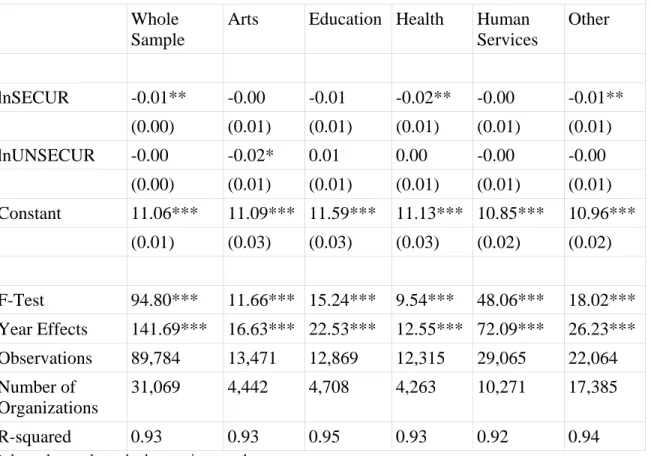
An alternate and simple explanation is that nonprofits reduce fund-raising efforts following borrowing, since the need for donations is reduced. To test this explanation, we estimated a two-way fixed effects regression with the log of fund-raising expenses as the dependent variable and the lagged debt ratios as explanatory variables.13 The results are presented in Table 11 for the full sample and Table 12 for the restricted donative subsample. The results generally do not support this explanation, that nonprofits reduce fund-raising following the use of secured or unsecured debt. Only donative Health and Other nonprofits have a negative and significant coefficient on secured debt. For the most part, therefore, nonprofits do not seem to reduce their fund-raising efforts following increases in borrowing.
[Table 11, about here]
13
Recall, the dependent variable (lnFREXP) may have measurement error. When the mismeasured variable is the dependent variable rather than an independent variable, the error weakens the model but does not introduce bias into the coefficients of the other variables (assuming the measurement error is not correlated with the independent variables) (Baum 2006). Therefore, in this case, a fixed effect estimator does not produce biased results. The use of fixed effects also addresses omitted variable bias.
[Table 12, about here]
Another potential understanding of these secured debt instruments relates to financial vulnerability. Bond and mortgage covenants are rigid, in that repayment schedules are relatively unalterable. Donors may view the use of this debt as problematic for nonprofits because it ties up future cash flows and revenues to service the debt rather than provide current and future programmatic output. In this understanding, donors seem to prefer the soft liabilities of unsecured debt because nonprofits can maintain some flexibility on repayment (for example, increasing payables rather than paying them off during times of fiscal stress). While unsecured debt tends to be more expensive, it also tends to be more available. Perhaps donors view the increased cost of such debt as a better, more flexible cost than the costs of issuing debt or taking on a mortgage, which is oftentimes fixed for decades. This may help explain why unsecured leverage has a positive influence on contributions. Rather than a nonprofit organization using a current donation to pay off costs for prior output, it can choose to delay paying back the soft liabilities of unsecured debt, thereby maintaining (or increasing) current programmatic output. In this respect, donors might prefer unsecured debt because it allows nonprofits to more fully maximize current output – or at least maintains the option for the nonprofit. On the other hand, secured debt removes this option and current donations may be directed to liabilities incurred for past output (at least in part).
Finally, the increase in donations related to unsecured liabilities might also be indicative of moral hazard in the nonprofit sector. Some nonprofits have been known in the past to make poor financial decisions, bringing themselves to the brink of insolvency, only to be bailed out by large donors.14 The results here might suggest that nonprofits that do increase unsecured liabilities might successfully use their weakened financial position as a fundraising tool, or that donors seek to maintain current output by increasing future donations in response to increases in unsecured borrowing.
CONCLUSION
The existing literature has separately examined the factors that influence donors to give to nonprofit organizations, and also the manner in which nonprofits choose to finance asset acquisitions (that is, why nonprofit capital structure is what it is). This paper seeks to analyze whether decisions by nonprofits about how assets are acquired (by debt or equity) are relevant to donors. In the for-profit sector, investors have an obvious interest in a firm’s capital structure since leverage enhances expected volatility, but also expected returns. In the nonprofit sector, leverage permits nonprofits to acquire capital and expand output, smooth working capital through business cycles, and also engage in programs determined as valuable by the nonprofit rather than by donors.
Nonprofits may fear that the use of debt signals mismanagement or bad governance, worrying that donors will punish the organization by removing
14
This has been described in the popular press by, for example, Wyatt and Finkel (2008), Dewan (2008), and Strom (2008), as examples. In each case, nonprofits were bailed out by important donors following either poor financial decision making or fraud covered up by management.
future donations. The results presented here suggest a more complicated relationship between nonprofit leverage and donations from individuals than this simple calculus. On the one hand, increases in secured debt ratios (from mortgages and bonds) seems to reduce future contributions, possibly because donors are wary of government or lender intervention in the nonprofit’s management, or possibly because of the lack of flexibility inherent in repaying such rigid debt. On the other hand, unsecured debt, while more expensive, seems to crowd-in donations, even at increasingly higher levels when compared to similar organizations.
There are at least two important conclusions from this analysis. First, during times of fiscal stress, nonprofits are often tempted to use restricted funds in ways inconsistent with donor intent simply to ensure organizational survival (see, for example Brody 2006 and Brody 2007). Rather than violate the trust of certain donors, the results here suggest that nonprofits would be better off utilizing unsecured (possibly short-term) borrowing to smooth out cash flow needs. In fact, violating the terms of a restricted donation might end up costing the organization more in legal fees, staff effort complying with government oversight requests, and the loss of other donors’ confidence in the organization. This option, however, assumes that nonprofits have access to some type of borrowing which is not true for many organizations. A second conclusion one might draw, therefore, is that policy considerations should be made to expand access to debt for nonprofits. The results here suggest that certain types of unsecured debt might in fact draw in additional resources,
allowing nonprofits to leverage these borrowings for additional resources. By encouraging this type of policy option, nonprofits would not only gain access to increased revenue sources, but might be able to maintain programmatic output during times of fiscal stress.
REFERENCES
Andreoni, J., & Scholz, J. K. (1998). An economic analysis of charitable giving with interdependent preferences. Economic Inquiry, 36, 410-428.
Auten, G. E., & Rudney, G. (1990). The variability of individual charitable giving in the US. Voluntas, 1, 80-97.
Banks, J., & Tanner, S. (1999). Patterns in household giving: Evidence from UK data. International Journal of Voluntary and Nonprofit Organizations,
10, 167-178.
Bekkers, R. (2005). It’s not all in the ask. Effects and effectiveness of
recruitment strategies used by nonprofits in the Netherlands. Paper
presented at the 34rd Annual ARNOVA Conference.
Belfield, C. R., & Beney, A. P. (2000). What determines alumni generosity? Evidence for the UK. Education Economics, 8, 65-80.
Boatright, R. G., Green, D. P., & Malbin, M. J. (2006). Does publicizing a tax credit for political contributions increase its use? Results from a randomized field experiment. American Politics Research, 34, 563-582. Boehm, M. (2008, Nov. 6). Opera Pacific Cancels Season. Los Angeles Times. Bowman, W. 2002. The Uniqueness of Nonprofit Finance and the Decision to
Borrow. Nonprofit Management and Leadership 12 (3), 293-311.
Brody, E. 2006. The Legal Framework for Nonprofit Organizations. In W.H. Powell and R. Steinberg (Eds.), The Nonprofit Sector: A Research
Handbook. New Haven: Yale University Press.
Brody, E. 2007. From the Dead Hand to the Living Dead: The Conundrum of Charitable-Donor Standing. Georgia Law Review, 41, 1183-1276.
Brooks, A. C. (2000a). Is There a Dark Side to Government Support for Nonprofits? Public Administration Review, 60(3), 211-218.
Brooks, A.C. (2000b). Public Subsidies and Charitable Giving: Crowding Out, Crowding In, or Both? Journal of Policy Analysis and Management, 19(3), 451-464.
Brooks, A. C. (2005). Does social capital make you generous? Social Science
Quarterly, 86, 1-15.
Brown, E. (2005). College, social capital, and charitable giving. In A. Brooks (Ed.), Gifts of time and money in Americas communities: Rowman & Littlefield.
Buchheit, S., & Parsons, L. M. (2006). An experimental investigation of accounting information’s influence on the individual giving process.
Journal of Accounting and Public Policy, 25(6), 666-686.
Bulkeley, W. M. (1997, March 27). New Era’s Bennett pleads no contest. Wall
Street Journal, pp. 3-4,
Chaves, M, J. Galaskiewicz, and L. Stephens (2004). Does Government Funding Suppress Nonprofits’ Political Activity? American Sociological Review, 69, 292-316.
Cheung, C. K., & Chan, C. M. (2000). Social-cognitive factors of donating money to charity, with special attention to an international relief organisation. Evaluation and Program Planning 23, 241-253.
Clotfelter, C. T. (1980). Tax incentives and charitable giving: Evidence from a panel of taxpayers. Empirical Economics, 13(3), 319-340.
Denison, D. V. (2009). Which Nonprofit Organizations Borrow? Public Budgeting
& Finance, 29(3), 110-123.
Dewan, S. (2008, April 8). Charity Hospital, on Brink, Gets a $200 Million Gift.
The New York Times.
Duquette, C. M. (1999). Is charitable giving by nonitemizers responsive to tax incentives? New evidence. National Tax Journal, 52, 195-206.
Froelich, K. A. (1999). Diversification of Revenue Strategies: Evolving Resource Dependence in Nonprofit Organizations. Nonprofit and Voluntary Sector
Quarterly, 28(3), 246-268.
Frumkin, P. and M. T. Kim (2001). Strategic Positioning and the Financing of Nonprofit Organizations: Is Efficiency Rewarded in the Contributions Marketplace? Public Administration Review, 61(3), 266-275.
Gentry, W. M. (2002). Debt, Investment, and Endowment Accumulation: The Case of Not-for-Profit Hospitals. Journal of Health Economics, 21, 845-872.
Gordon, T. P., Knock, C. L., & Neely, D. G. (2009). The role of rating agencies in the market for charitable contributions: An empirical test Journal of
Accounting and Public Policy, 28(6), 469-484.
Graham, E. (1993, May 13). Thin rewards: Sprawling bureaucracy eats up most profits of Girl Scout cookies – Troops get a small portion from children’s efforts, spurring angry backlash – But officials do goods deeds. Wall
Street Journal,
Greenlee, J. S. and K. L. Brown (1999). The Impact of Accounting Information on Contributions to Charitable Organizations. Research in Accounting
Regulation, 13, 111-126.
Gruber, J. (2004). Pay or pray? The impact of charitable subsidies on religious attendance. Journal of Political Economics, 88, 2635-2655.
Hillygus, D. S. (2005). The missing link: Exploring the relationship between higher education and political engagement. Political Behavior, 27, 25-47.
Houston, D. J. (2006). "Walking the walk" of public service motivation: Public employees and charitable gifts of time, blood, and money. Journal of
Public Administration Research and Theory, 16, 67-86.
Hsiao, C. (2002). Analysis of Panel Data, 2nd Edition. Cambridge University
Press.
Jacobs, F. A. and N. P. Marudas (2009). The Combined Effect of Donation Price and Administrative Inefficiency on Donations to US Nonprofit Organizations. Financial Accountability & Management, 25 (1), 33-53. Jegers, M. and I. Verschueren (2006). On the Capital Structure of Non-Profit
Organisations: An Empirical Study for Californian Organisations. Financial
Accountability & Management, 22(4), 309-329.
Keating, E. K., L. M. Parsons, and A. A. Roberts (2008). Misreporting Fundraising: How Do Nonprofit Organizations Account for Telemarketing Campaigns? The Accounting Review, 83(2),
Khumawala, S. B., & Gordon, T. P. (1997). Bridging the credibility of GAAP: Individual donors and the new accounting standards for nonprofit organizations. Accounting Horizons, 11(3), 45-68.
Kingma, B. R. (1989). An accurate measurement of the crowd-out effect, income effect and price effect for charitable contributions. Journal of
Political Economy, 97, 1197-1207.
Kitching, K. (2009). Audit value and charitable organizations. Journal of
Accounting and Public Policy, 28(6), 510-524.
Krishnan, R., M. H. Yetman, and R. J. Yetman (2006). Expense Misreporting in Nonprofit Organizations: An Agency Based Analysis. The Accounting
Review, 81, 399-420.
Lankford, R. H., & Wyckoff, J. H. (1991). Modeling charitable giving using a Box-Cox standard tobit model. The Review of Economics and Statistics,
73, 460-470.
Lee, B. A., & Farrell, C. R. (2003). Buddy, can you spare a dime? Homelesness, panhandling, and the public. Urban Affairs Review, 38(3), 299-324. Lee, R. D., Johnson, R. W., & Joyce, P. G. (2004). Public Budgeting Systems.
Sudbury, MA: Jones and Bartlett Publishers.
Marudas, N. P. (2004). Effects of Nonprofit Organization Wealth and Efficiency on Private Donations to Large Nonprofit Organizations. Research in
Government and Nonprofit Accounting, 11, 71-91.
Moore, M. H. (2000). Managing for Value: Organizational Strategy in For-Profit, Nonprofit, and Government Organizations. Nonprofit and Voluntary
Sector Quarterly, 29(suppl 1), 183-208.
Okten, C., & Weisbrod, B. (2000). Determinants of donations in private nonprofit markets. Journal of Public Economics, 75, 255-272.
Okunade, A. A., & Berl, R. L. (1997). Determinants of charitable giving of business school alumni. Research in Higher Education 38, 201-214.
Ostrower, F. (1995). Why the wealthy give: The culture of elite philanthropy. Princeton, New Jersey: Princeton University Press.
Parsons, L., 2003. Is Accounting Information from Nonprofit Organizations Useful to Donors? Review of Charitable Giving and Value-Relevance.
Journal of Accounting Literature 22, 104-129.
Posnett, J. and T. Sandler (1989). Demand for Charity Donations in Private Non-Profit Markets: The Case of the U.K. Journal of Public Economics, 40(2), 187-200.
Romney-Alexander, D. (2002). Payroll giving in the UK: Donor incentives and influences on giving behaviour. International Journal of Nonprofit and
Voluntary Sector Marketing, 7, 84-92.
Sloan, M. F. (2009). The effects of nonprofit accountability ratings on donor behavior. Nonprofit and Voluntary Sector Quarterly, 38(2), 220-236. Strom, S. (2008, August 17). Head of Foundation Bailed Out Nonprofit Group
After Its Funds Were Embezzled. The New York Times.
Tinkelman, D. (1998). Differences in Sensitivity of Financial Statement Users to Joint Cost Allocations: The Case of Nonprofit Organizations. Journal of
Tinkelman, D. (1999). Factors Affecting the Relation Between Donations to Not-for-Profit Organizations and an Efficiency Ratio. Research in Government
and Nonprofit Accounting 10, 135-161.
Tinkelman, D. (2004). Using Nonprofit Organizations-Level Financial Data to Infer Managers’ Fund-Raising Strategies. Journal of Public Economics, 88(9-10), 2181-2192.
Tinkelman, D. and K. Mankaney (2007). When Is Administrative Efficiency Associated with Charitable Donations? Nonprofit and Voluntary Sector
Quarterly, 36(1), 41-64.
Todd, S. J., & Lawson, R. W. (1999). Towards a better understanding of the financial donor: An examination of donor behavior in terms of value structure and demographics. International Journal of Nonprofit and
Voluntary Sector Marketing, 4, 235-244.
Trussel, J. (2003). Assessing Potential Accounting Manipulation: the Financial Characteristics of Charitable Organizations with Higher than Expected Program-Spending Ratios. Nonprofit and Voluntary Sector Quarterly, 32(4), 616-634.
Van Slyke, D. M., & Brooks, A. C. (2005). Why do people give? New evidence and strategies for nonprofit managers. American Review of Public
Administration, 35, 199-222.
Wedig, G. J., M. Hassan, and M. A. Morrisey (1996). Tax-Exempt Debt and the Capital Structure of Nonprofit Organizations: An Application to Hospitals.” Journal of Finance, 51(4), 1247-1283.
Weisbrod. B. A. and N. D. Dominguez (1986). Demand for Collective Goods in Private Nonprofit Markets: Can Fundraising Expenditures Help Overcome Free-Rider Behavior? Journal of Public Economics, 30 (1), 83-96.
Whoriskey, P., & Salmon, J. L. (2002, September 7). United Way seeks trust of donors. Washington Post,
Wooldridge, J. M. (2002). Econometric Analysis of Cross Section and Panel
Data. Boston: MIT Press.
Yan, W., D. V. Denison, and J. S. Butler (2009). Revenue Structure and Nonprofit Borrowing. Public Finance Review, 37(1), 47-67.
Yavas, U., Riecken, G., & Parameswaran, R. (1981). Personality, organization-specific attitude, and socio-economic correlates of charity giving behavior. Journal of the Academy of Marketing Science, 9, 52-65.
Yetman, R. J. (2007). Borrowing and Debt. In D. Young (Ed.), Financing
Table 1: Composition of Final Sample by Nonprofit Industry (by major NTEE subsector)
Industry Number of
Observations
Percent of Total Number of Organizations Percent of Total Arts 46,765 10.15% 10,959 10.41% Education 64,480 14.00% 15,293 14.53% Health 90,335 19.61% 19,639 18.66% Human Service 173,255 37.62% 38,629 36.69% Other 85,742 18.62% 20,753 19.71% Total 460,577 100.00% 105,273 100.00%
Table 2: Composition of Restricted Donative Sample by Nonprofit Industry (by major NTEE subsector)
Industry Number of
Observations
Percent of Total Number of Organizations Percent of Total Arts 17,657 14.53% 4,961 13.56% Education 18,260 15.03% 5,704 15.59% Health 17,219 14.17% 5,404 14.77% Human Service 38,882 32.00% 12,114 33.10% Other 29,489 24.27% 8,412 22.99% Total 121,507 100.00% 36,595 100.00%
Table 3: Descriptive Statistics, Full Sample ($ in thousands), 1998 – 2003 Mean Median Standard
Deviation
Minimum Maximum
Debt
Secured Debt 2,205 0 24,100 0 3,000,000 Secured
Debt-Total Assets Ratio
0.12 0 0.24 0 1.36
Unsecured Debt 1,999 63 61,500 0 33,000,000 Unsecured
Debt-Total Assets Ratio
0.24 0.10 0.40 0 2.86 Revenues Donations 943 92 8,723 0 1,550,000 Programs 5,203 89 68,500 0 19,900,000 Government 658 0 6,592 0 812,000 All Other 746 48 10,800 0 2,720,000 Fund-Raising Expenses 93 0 959 0 145,000 Price 1.34 1.19 0.56 0 5.34 Total Assets 12,800 776 175,000 0 62,900,000 Age 21 18 16.6 0 103 Observations 460,577 Organizations 105,273
Table 4: Descriptive Statistics, Donative Subsample ($ in thousands), 1998 – 2003 Mean Median Standard
Deviation
Minimum Maximum
Debt
Secured Debt 1,907 0 21,500 0 1,900,000 Secured
Debt-Total Assets Ratio
0.07 0 0.17 0 1.36
Unsecured Debt 2,374 104 111,000 0 33,000,000 Unsecured
Debt-Total Assets Ratio
0.18 0.07 0.31 0 2.86 Revenues Donations 2,649 519 15,800 100 1,550,000 Programs 3,127 66 33,900 0 2,500,000 Government 743 0 9,821 0 812,000 All Other 1,265 107 15,900 0 2,420,000 Fund-Raising Expenses 291 61 1,792 1 145,000 Price 1.39 1.26 0.52 1 5.34 Total Assets 20,200 1,653 292,000 0 62,900,000 Age 26.2 22 17.0 4 103 Observations 121,507 Organizations 36,595
Donative subsample contains nonprofit organizations with more than $1,000 of annual administrative expenses and fundraising expenses each, is more than four years old, has more than $100,000 of annual contributions from individuals, and depends on individual contributions for at least 10 percent of total revenues (as in Tinkelman and Mankaney 2007).
Table 5: Means and Standard Deviations, by Subsector ($ in thousands), 1998 – 2003
Arts Education Health Human
Services Other Debt Secured Debt 458 (5,534) 3,427 (32,200) 6,453 (45,500) 872 (5,980) 458 (7,403) Secured
Debt-Total Assets Ratio 0.08 (0.21) 0.11 (0.21) 0.13 (0.23) 0.14 (0.27) 0.07 (0.19) Unsecured Debt 463 (3,313) 3,578 (152,000) 5,296 (51,600) 672 (5,575) 857 (7,106) Unsecured
Debt-Total Assets Ratio 0.28 (0.53) 0.23 (0.39) 0.26 (0.39) 0.22 (0.37) 0.24 (0.42) Revenues Donations 901 (5,499) 1,832 (12,900) 749 (8,375) 445 (5,338) 1,507 (11,500) Programs 590 (2,835) 5,578 (42,100) 19,100 (149,000) 1,351 (12,400) 596 (6,706) Government 235 (2,729) 1,148 (14,600) 732 (4,930) 657 (3,453) 444 (4,466) All Other 431 (3,884) 1,753 (25,900) 1,250 (7,590) 307 (2,427) 516 (6,217) Fund-Raising Expenses 109 (549) 182 (1,067) 91 (1,378) 46 (691) 114 (975) Price 1.51 (0.71) 1.34 (0.54) 1.31 (0.53) 1.27 (0.47) 1.39 (0.66) Total Assets 5,857 (39,800) 30,600 (415,000) 27,100 (181,000) 3,710 (24,200) 6,557 (51,200) Age 22 (16) 23 (18) 24 (17) 21 (16) 18 (16) Observations 46,765 64,480 90,335 173,255 85,742 Organizations 10,959 15,293 19,639 38,629 20,753
Table 6: Means and Standard Deviations for Donative Subsample, by Subsector ($ in thousands), 1998 – 2003
Arts Education Health Human
Services Other Debt Secured Debt 1,006 (8,722) 7,235 (46,200) 2,466 (27,100) 638 (5,963) 496 (6,279) Secured Debt-Total Assets
Ratio 0.08 (0.19) 0.10 (0.17) 0.06 (0.15) 0.09 (0.17) 0.05 (0.15) Unsecured Debt 885 (4,578) 8,899 (28,400) 2,810 (24,700) 574 (6,959) 1,342 (7,793) Unsecured Debt-Total Assets
Ratio 0.23 (0.43) 0.14 (0.23) 0.17 (0.29) 0.14 (0.25) 0.21 (0.35) Revenues Donations 2,047 (8,732) 4,793 (22,000) 2,318 (16,300) 1,394 (11,000) 3,531 (19,000) Programs 1,076 (4,131) 10,800 (59,400) 19,100 (149,000) 1,273 (23,300) 495 (5,902) Government 402 (2,267) 2,061 (23,200) 732 (4,930) 542 (2,765) 473 (5,990) All Other 838 (5,969) 4,037 (38,400) 1,250 (7,590) 566 (4,508) 778 (6,163) Fund-Raising Expenses 266 (865) 499 (1,762) 368 (3,050) 164 (1,445) 302 (1,621) Price 1.53 (0.61) 1.37 (0.44) 1.44 (0.63) 1.32 (0.43) 1.39 (0.66) Total Assets 12,700 (62,900) 74,200 (724,000) 27,100 (163,000) 5,516 (42,800) 11,600 (72,500) Age 26 (16) 32 (19) 25 (16) 26 (17) 24 (16) Observations 17,657 18,260 17,219 38,882 29,489 Organizations 4,961 5,704 5,404 12,114 8,412 Donative subsample contains nonprofit organizations with more than $1,000 of annual administrative
expenses and fundraising expenses each, is more than four years old, has more than $100,000 of annual contributions from individuals, and depends on individual contributions for at least 10 percent of total revenues (as in Tinkelman and Mankaney 2007).
Table 7: Regression Results for Models Predicting the Influence of Leverage on Contributions, 1998-2003, Full Sample
Whole Sample
Arts Education Health Human Services Other lnSECUR -0.10*** -0.03** -0.07*** -0.05*** -0.14*** -0.06*** (0.01) (0.01) (0.02) (0.02) (0.01) (0.02) lnUNSECUR -0.02*** 0.12*** -0.01 -0.07*** -0.02* 0.02 (0.01) (0.01) (0.01) (0.01) (0.01) (0.01) lnPRICE -0.21*** -0.10 -0.32*** -0.34*** 0.21*** -0.59*** (0.04) (0.08) (0.10) (0.09) (0.07) (0.08) lnFREXP 0.27*** 0.17*** 0.23*** 0.30*** 0.28*** 0.28*** (0.00) (0.01) (0.01) (0.00) (0.00) (0.00) lnAGE 0.11*** -0.03 -0.05* 0.18*** 0.24*** 0.06*** (0.01) (0.03) (0.03) (0.03) (0.02) (0.02) lnASSETS 0.34*** 0.50*** 0.62*** 0.30*** 0.19*** 0.42*** (0.01) (0.02) (0.02) (0.02) (0.01) (0.02) lnGOVT 0.01*** 0.03*** -0.02*** 0.02*** 0.01*** -0.04*** (0.00) (0.00) (0.00) (0.00) (0.00) (0.00) lnPROGREV -0.08*** 0.00 -0.07*** -0.12*** -0.09*** -0.07*** (0.00) (0.01) (0.00) (0.00) (0.00) (0.00) lnOTHREVS 0.05*** -0.03** 0.01 0.04*** 0.13*** -0.05*** (0.00) (0.01) (0.01) (0.01) (0.01) (0.01) Constant 4.91*** 4.15*** 1.91*** 4.40*** 4.81*** 5.02*** (0.22) (0.15) (0.18) (0.18) (0.13) (0.16) F-Test 1,493.03*** 470.00*** 923.30*** 734.16*** 1,393.70*** 683.64*** Year Effects 15.91*** 6.29*** 3.88*** 1.11 3.34*** 12.61*** Industry Effects 152.77*** No No No No No Observations 330,916 33,305 45,384 65,899 126,108 60,220 Number of Organizations 93,058 9,478 13,327 17,883 34,550 17,820 R-squared 0.27 0.31 0.34 0.22 0.24 0.25
Table 8: Regression Results for Models Predicting the Influence of Leverage on Contributions, 1998-2003, Donative Subsample
Whole Sample
Arts Education Health Human Services Other lnSECUR -0.00 0.02*** -0.02*** 0.05 0.01** -0.02*** (0.00) (0.01) (0.01) (0.01) (0.01) (0.01) lnUNSECUR 0.14*** 0.18*** 0.11*** 0.17*** 0.12*** 0.13*** (0.00) (0.01) (0.01) (0.01) (0.01) (0.01) lnPRICE -0.38*** -0.25*** -0.37*** -0.25*** -0.37*** -0.65*** (0.02) (0.04) (0.05) (0.06) (0.05) (0.04) lnFREXP 0.08*** 0.08*** 0.06*** 0.09*** 0.07*** 0.11*** (0.00) (0.00) (0.00) (0.00) (0.00) (0.00) lnAGE -0.10*** -0.09*** -0.15*** -0.11*** -0.10*** -0.09*** (0.01) (0.02) (0.02) (0.02) (0.01) (0.01) lnASSETS 0.53*** 0.50*** 0.56*** 0.50*** 0.50*** 0.56*** (0.00) (0.01) (0.01) (0.01) (0.01) (0.01) lnGOVT -0.00*** -0.00 0.02*** -0.01*** -0.01*** -0.01*** (0.00) (0.00) (0.00) (0.00) (0.00) (0.00) lnPROGREV -0.02*** -0.01** -0.02*** -0.01*** -0.02*** -0.02*** (0.00) (0.00) (0.00) (0.00) (0.00) (0.00) lnOTHREVS -0.01*** 0.01 0.00 -0.00 -0.01*** -0.03*** (0.00) (0.00) (0.01) (0.01) (0.00) (0.00) Constant 6.28*** 6.03*** 5.42*** 6.21*** 6.47*** 5.80*** (0.11) (0.10) (0.09) (0.12) (0.08) (0.09) F-Test 1,079.66*** 461.95*** 994.32*** 269.21*** 536.56*** 714.85*** Year Effects 87.99*** 16.93*** 18.08*** 3.02** 22.80*** 34.01*** Industry Effects 53.47*** No No No No No Observations 89,784 13,471 12,869 12,315 29,065 22,064 Number of Organizations 31,069 4,442 4,708 4,263 10,271 7,385 R-squared 0.61 0.61 0.72 0.55 0.45 0.63
Robust clustered standard errors in parentheses * significant at 10%; ** significant at 5%; *** significant at 1%
Table 9: Regression Results for Models Predicting the Influence of Leverage on Contributions, Including Controls for Highly Leveraged Nonprofits, 1998-2003
Whole Sample
Arts Education Health Human Services Other lnSECUR -0.06*** -0.02** -0.07*** 0.00 -0.04*** -0.07*** (0.01) (0.01) (0.02) (0.02) (0.01) (0.00) lnUNSECUR 0.03*** 0.09*** 0.04*** -0.03* 0.04*** 0.05*** (0.01) (0.01) (0.01) (0.02) (0.01) (0.01) HIGH_SECUR -1.39*** 0.15* -0.66*** -1.26*** -2.39*** -1.13*** (0.05) (0.09) (0.11) (0.11) (0.07) (0.12) HIGHXlnSECUR -0.85*** 0.08 -0.43*** -0.75*** -1.64*** -0.50*** (0.03) (0.05) (0.07) (0.08) (0.06) (0.07) HIGH_UNSECUR -0.29*** 0.22*** -0.31*** -0.27*** -0.40*** -0.24*** (0.03) (0.06) (0.07) (0.06) (0.04) (0.05) HIGHXlnUNSECUR 0.02* -0.02 0.04 -0.03 0.01 0.00 (0.01) (0.04) (0.04) (0.04) (0.02) (0.03) lnPRICE -0.22*** -0.10 -0.33*** -0.35*** 0.16*** -0.58*** (0.04) (0.08) (0.10) (0.09) (0.07) (0.08) lnFREXP 0.26*** 0.17*** 0.23*** 0.30*** 0.26*** 0.27*** (0.00) (0.01) (0.01) (0.00) (0.00) (0.00) lnAGE 0.09*** -0.02 -0.06** 0.17*** 0.19*** 0.05*** (0.01) (0.03) (0.04) (0.03) (0.02) (0.02) lnASSETS 0.38*** 0.51*** 0.62*** 0.34*** 0.31*** 0.44*** (0.01) (0.02) (0.02) (0.02) (0.01) (0.02) lnGOVT 0.01*** 0.03*** -0.02*** 0.02*** 0.01*** -0.04*** (0.00) (0.00) (0.00) (0.00) (0.00) (0.00) lnPROGREV -0.07*** -0.00 -0.07*** -0.11*** -0.07*** -0.07*** (0.00) (0.01) (0.00) (0.00) (0.00) (0.00) lnOTHREVS 0.03*** -0.03** -0.00 0.02** 0.10*** -0.06*** (0.00) (0.01) (0.01) (0.01) (0.01) (0.01) Constant 4.90*** 3.93*** 2.19*** 4.30*** 4.25*** 5.10*** (0.22) (0.16) (0.19) (0.19) (0.14) (0.16)
F-Test 1,409.64*** 362.10*** 735.82*** 584.30*** 1,183.52*** 533.43*** Year Effects 14.26*** 6.11*** 3.10** 1.16 3.23** 12.02*** Industry Effects 129.73*** No No No No No Observations 330,916 33,305 45,384 65,899 126,108 60,220 Number of Organizations 93,058 9,478 13,327 17,883 34,550 17,820 R-squared 0.28 0.31 0.34 0.22 0.27 0.26
Robust clustered standard errors in parentheses * significant at 10%; ** significant at 5%; *** significant at 1%
HIGH_SECUR is a dummy variable equal to 1 if the organization reports Total Bonds + Total
Mortgages/Total Assets in excess of its subsector’s mean ratio; HIGH_UNSECUR is a dummy variable equal to 1 if the organization reports All Other Liabilities/Total Assets in excess of its subsector’s mean ratio. HIGHXlnSECUR and HIGHXlnUNSECUR are interactions terms between HIGH_SECUR and HIGH_UNSECUR and the independent variables lnSECUR and lnUNSECUR, respectively.