A Case for a Coordinated Basket for Asian Countries
∗∗∗∗Takatoshi Ito∗∗
1. Introduction
The exchange rate policy is an important pillar for managing macro-economy. It affects both trade and investment. The stability of the exchange rate will promote trade and investment, but it sometimes invites too much capital inflows. The flexibility of the exchange rate is important to make necessary adjustments in response to domestic and external shocks. However, the market sometimes misbehaves and the exchange rates often overshoot or experiences misalignment. The fixed exchange rate with capital mobility may limit the degree of freedom of the monetary policy.
The de facto dollar peg was one of the reasons for the Asian currency crisis. When Asian countries pegged to the US dollar, while their exports and imports were diversified, the third currency fluctuations—say, yen depreciation or euro depreciation—have profound effects on their export competitiveness. In general export competitiveness is affected by the fluctuation in the real effective exchange rate. Another problem associated with the fixed exchange rate in an emerging market economy with liberalized capital flows is that borrowers (local corporations and banks) and lenders (foreign banks) of short-term loans do not realize that there should be devaluation risk premium. The under-rated risk makes both lenders and borrowers to behave with moral hazard. Borrowers think that dollar denominated loans is cheaper with lower interest rate than the local currency loans, while lenders think that borrowers, often with high growth performance, are safe and free from default risk. It is only after devaluation that borrowers realize that devaluation makes their debts unsustainable, and that lenders realize that borrowers default in the midst of currency crisis. This is basically what happened in Asia from mid-1990s to the crisis in 1997-98. (See Ito (1999a, 1999b, 2000) for details.)
After the Asian currency crisis erupted in Thailand in July 1997, all Asian countries, except China and Hong Kong, floated their currencies. Their currencies
in mid-January 1998, and started to appreciate. (Indonesian Rupiah was the exception, staying quite weak for the rest of 1998. An eventual recovery was much less than other currencies.) Asian currencies movement from July 1997 to the summer of 1998 was much less correlated with the US dollar than before. The correlation with the Japanese yen increased. However, by the summer of 1998, many Asian countries started to attempt stability of the exchange rate vis-à-vis the US dollar. As an extreme case, Malaysia returned to a dollar fix in September 1998. The correlation of the Asian currencies and the US dollar increased in 1999 and 2000. Similar tendencies have been observed for other emerging market economies. Calvo and Reinhart (2000) coined the phrase, “fear of floating” among the emerging economies, even after the crises in Asia, Russia, Brazil, and Turkey. Did emerging market economies missed the lessons from a currency crisis originating from the fixed exchange rate? Or is there any inherent reason why the emerging market economies prefer stability of its exchange rate vis-à-vis the US dollar?
Many (Benassy-Quere (1999), Ito, Ogawa, and Sasaki (1998), Williamson (2000), to name a few) think that a basket currency regime is a desirable exchange rate regime for emerging market economies with diverse trading partners. They propose that the Asian countries should allow their exchange rate to fluctuate against the US dollar, and to reflect the value of weighted average of trading partners’ exchange rates.
Ogawa and Ito (2002) have argued that there is a coordination problem for a group of emerging market economies, when they try to stabilize the real effective exchange rate. For example, when Thailand calculates the real effective exchange rate, the neighbor’s exchange rate, say Malaysia’s currency value, should be in the formula. Also, when Malaysia calculates the real effective exchange rate, the Thai exchange rate should be in the calculation. If Malaysia decides to adopt the dollar peg (for the political reason), then the de facto dollar weight in the Thai bath real effective exchange rate suddenly increases, and Thailand more likely adopts the dollar peg (or at least increases the weight for the dollar). Under this circumstance, Malaysia and Thailand should solve the joint problem of choosing the weight on major currencies, excluding each other’s exchange rate. The joint decision will produce better results than the uncoordinated Nash solution, in that Thailand regards the Malaysia’s exchange rate as given, and Malaysia regards the Thai exchange rate as given.
following types of exchange rate movements will be examined below. (1) Actual exchange rate movement; (2) Uncoordinated, individual-basket exchange rate movement; and (3) Coordinated, individual-basket exchange rate movement.
2.
Exchange Rate Movements in Asia before and after the Asian
Currency Crisis
Figures 2.1a and 2.1b show the (nominal) Asian currencies movement from 1990:1 to 2000:12, where 2.1a includes Indonesia and 2.1b does not. One can observe that the exchange rates were relatively stable between 1990:1 and 1997:6. Except for a devaluation of Chinese Yuan in 1994, an Asian currency vis-à-vis the US dollar tends to be stable until the Asian currency crisis.
After the currency crisis, the Asian currencies have fluctuated in a wide range. Except the Indonesian Rupiah, whose value dropped to 1/6 of the pre-crisis value, the Asian currencies have been fluctuating within 100 and 200 (where 100 is set at the value in 19901:1).
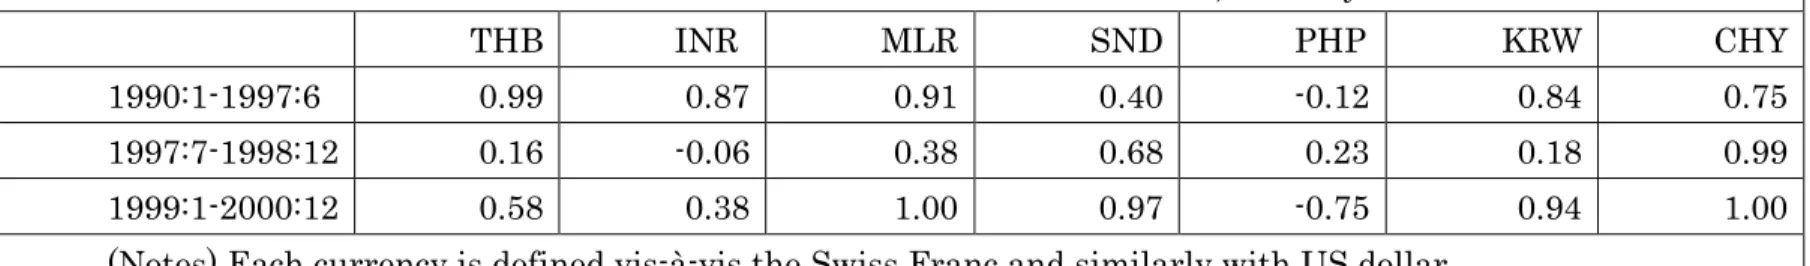
The table 2.1 shows the correlation of the Asian currencies and the US dollar (both being the exchange rates vis-à-vis the Swiss Franc). This shows that the correlation of the Asian currencies with the US dollar was in general quite high before July 1997. China had one-time devaluation in 1994, so that the correlation coefficient is low, but except that event, the correlation would have been much higher (close to .95). The correlation of the Singaporean dollar with the US dollar is low, because the Singaporean monetary authority has been adopting the basket exchange regime. The correlation with the U.S. dollar declined significantly for all (but the Singaporean dollar) countries in 1997:7-1998:12. This is the post-crisis period, where the Asian currencies were floating freely. However, in 1999 and 2000, the correlation with the US dollar has increased. Correlation of the Thai and Indonesian currencies with the U.S. dollar in 1999-2000 was lower than the pre-crisis but higher than the post-crisis period. The correlation with the US dollar become higher than .90 for Singaporean dollar and Korean won in 1999-2000. This is surprising given that the Singaporean basket regime is often credited to its resilience to regional currency crises.
Exchange Rates against US dollar 1990M1=100 1990M1-2000M12 0 100 200 300 400 500 600 700 800 900 199 0M1 199 1M1 199 2M1 199 3M1 199 4M1 199 5M1 199 6M1 199 7M1 199 8M1 199 9M1 2000 M1 CHINA INDONESIA KOREA MALAYSIA PHILIPPINES SINGAPORE THAILAND
Exchange Rates against US dollar 1990M1=100 1990M1-2000M12 0 50 100 150 200 250 300 1990M 1 1991 M1 1992M 1 1993M 1 1994M 1 1995M 1 1996M 1 1997M 1 1998M 1 1999M 1 2000 M1 CHINA KOREA MALAYSIA PHILIPPINES SINGAPORE THAILAND
Table 2-1. Correlation coefficients of Asian currencies with the US dollar, monthly data
THB INR MLR SND PHP KRW CHY
1990:1-1997:6 0.99 0.87 0.91 0.40 -0.12 0.84 0.75
1997:7-1998:12 0.16 -0.06 0.38 0.68 0.23 0.18 0.99
1999:1-2000:12 0.58 0.38 1.00 0.97 -0.75 0.94 1.00
The question is why Asian countries appear to pursue stability vis-à-vis the US dollar when there is an obvious advantage to adopt a basket currency regime and a fixed exchange rate has been a dangerous regime inviting a series of currency crises in the second half of the 1990s. We suspect that one of the reasons for stability vis-à-vis the US dollar is the coordination failure among the Asian countries. If your neighbor (say, Malaysia) is adopting the US dollar peg regime, it is optimum for you (say, Thailand) to adopt the US dollar peg regime. Similarly, if Thailand adopts the dollar peg regime, Malaysia finds it optimal to move to the US dollar peg regime. Although a joint decision would make them to choose less weight on the US dollar, sequential decisions on the dollar peg may lead the countries away from coordinated equilibrium. This is the coordination failure shown in the Ogawa and Ito model.
3.
Theory: Uncoordinated Basket and Coordinated Basket
In this section, the Ogawa and Ito model is reviewed, and then its extension to a multi-country model will be presented.
Ogawa and Ito (2002) showed in a two-country example how the dollar peg weight of Country A becomes a function of the dollar peg weight of Country B, when each country is minimizing volatility of trade balances.
Ogawa and Ito showed that the dollar weight of country A, wA, is shown to be a (reaction) function of the dollar weight of country B, wB, and the dollar weight of country B as a (reaction) function of the dollar weight of country A.
$ $ $ $
(AA Y +AA )wA+(AB Y+AB )wB =AA +AB
$ $ $ $
(BB Y +BB )wB+(BA Y +BA )wA =BB +BA
Thus, each country has to determine its optimal weight in a currency basket while they are affected by behavior of the other country.
There is a unique equilibrium pair of optimal weights for countries A and B
because both of the policy reaction functions are linear functions.From the above equations, we derive a pair of optimal weights on the dollar in a currency basket to stabilize their trade balances for both of the countries A and B at the same time:
$ $ $ $ $ $ * $ $ $ $
(
)(
) (
)(
)
(
)(
) (
)(
)
A B B Y B B Y B B A A A Y A B Y B B Y B A Y AA
A
B
B
A
A
B
B
w
A
A
B
B
A
A
B
B
+
+
−
+
+
=
+
+
−
+
+
$ $ $ $ $ $ * $ $ $ $(
)(
) (
)(
)
(
)(
) (
)(
)
A Y A B A A B A Y A B A Y A B Y B B Y B A Y AA
A
B
B
A
A
B
B
w
A
A
B
B
A
A
B
B
+
+
−
+
+
=
+
+
−
+
+
The reaction functions are shown in the Figures 3.1 and 3.2. Depending on the slopes of the reaction functions, the optimal weights (w*A, w*B) can be a stable or unstable equilibrium. If the real world is the unstable equilibrium, even when a crisis and floating (like in 1997-98) temporarily lowers the dollar weight, sooner or later, the dollar weights will increase again (like in 1999-2001).
As is shown in Figure 3.2, the sequential decision will bring the dollar weights to the joint dollar peg solution (1,1), that is inferior to the interior equilibrium. Therefore, in the case of unstable equilibrium, just floating does not break away from the dollar peg. The exchange rate regimes in Asia moves back to a de facto dollar peg.
We introduce a framework of basket currency as follows.
(1) Assume that the optimal weight on the other currencies is the trade weight. (In general, it should be trade weight and price elasticity of exports. See Ito, Ogawa, and Sasaki (1998)); (2) Assume that European countries consist of EURO 12 countries (Define Euro backdating) and calculate backwards the EURO value into the past; and (3) Disregard countries other than US, Japan, EURO 12, and the seven Asian countries mentioned below. Set exports to these countries as total exports and calculate the export share (add up to 1): aij is the share of country j in exports from country i.
USD = US dollar/CHF JPY = Japanese Yen/CHF EUR = Euro/CHF
Let us define exchange rate vis-à-vis the Swiss franc (CHF=Swiss Franc) for seven countries.
THB = Thai Baht/CHF
INR = Indonesian Rupiah/CHF MLR = Malaysian Ringgit/CHF SND = Singaporean Dollar/CHF PHP = Philippines Peso/CHF KRW = Korean Won/CHF CNY = Chinese Yuan/CHF
Each exchange rate is nominal, if the nominal rate is used; while each exchange rate becomes real, if each exchange rate is adjusted for the changes in the CPI.
x = (THB, INR, MLR, SND, PHP, KRW, CNY)′ is a column vector of exchange rate.
A = {aij}, 7x7 matrix with 0 in diagonals. This matrix is an export share matrix. The Uncoordinated Basket is defined as the exchange rate that considers the changes in the (USD, JPY, EUR), and Asian currencies as given.
y = (USD, JPY, EUR)′ is a column vector of major currencies of outside the Regional grouping.
B = 7x3 matrix of trade shares with the US, Japan, and Europe;
Denote the actual exchange rates as xa and ya , and the uncoordinated exchange rate by xu . The uncoordinated exchange rate is defined by the following formula.
xu = Axa + Bya
When USD, JPY, and EUR fluctuate, the exchange rate of Country i moves through the direct impact of Bya. This effect ignores how the Asian currencies
would be affected by the changes in the major currencies. The changes in the Asian currencies, other than the own currency i, also affect the currency of Country i—this is through Axa.
Set the beginning of the sample period as 100.
I = 7x7 identity matrix, that is, having 1 at the diagonal, and 0 off-diagonal. Then the coordinated basket is defined by the following equation.
xc = Axc + By Hence, (I-A)xc = By and xc = (I-A)-1 By Define C = (I-A)-1 B.
The C matrix (7x3) is the coordinated basket matrix. Each row of C matrix is the coordinated basket solution to each of the major currencies. For example,
(c11, c12, c13) is the weight that the Thai Baht should put on (USD, JPY, EUR). (c12, c22, c23) is the weight that the Indonesian Rupiah should on (USD, JPY, EUR)
and so on. These weights include both direct and indirect effects of changes in the major currencies.
4.
Estimates of the Coordinated and Uncoordinated Basket
In order to calculate basket currencies, it is necessary to choose the weights of the currencies to which the currency is floated against. Here, the trade weight (exports to country j from country k in ratio to total exports of country k) is used. The trade weights are calculated based on the Direction of Trade (DOT) published by the International Monetary Fund. The annual data of DOT is interpolated to be monthly data. The basket values are calculated by applying the monthly weights to monthly exchange rates that are taken from the International Financial Statistics (IFS) published by the International Monetary Fund.
the depreciation of the yen, as for all East Asian countries, Japan is an important trading partners. The actual real exchange rate vis-à-vis the U.S. dollar slightly appreciated after 1995, when the uncoordinated value of the exchange rate depreciated. The deviation between the uncoordinated basket value and the actual rate was most remarkable in China, Singapore, Thailand, and Malaysia. For Thailand, the actual rate was about 30% depreciated compared to the uncoordinated basket value. For other countries, namely, Korea, Indonesia, and the Philippines, there was little serious currency misalignment before the currency crisis of 1997. This confirms the notion that some of the Asian currencies were overvalued and that hurt exports before the crisis. However, the result is slightly counter-intuitive in that two of the most seriously affected crisis countries, namely Korea and Indonesia, do not show serious misalignment, while Singapore, known to have a basket system, still had a misalignment, compared to uncoordinated basket.
The figures 4.C.1 – 4.C.7 show the movements of actual and coordinated basket currencies from 1990 to 1997. The actual exchange rate was not much deviated from the coordinated basket currencies for the pre-crisis period of 1995-97.
The coordinated basket values show that when the dollar-yen and the dollar-euro fluctuated, the Asian currencies collectively moved more or less correctly. This is rather counter-intuitive, because we would suspect that if the Asian countries had been floating and adopted a loose basket exchange rate regime, a lack of coordination would have made the currencies overvalued more than otherwise.
Similar to the previous result, China, Malaysia, Singapore, and Thailand were found have had overvalued currencies compared to the coordinated basket currencies. The degree of overvaluation was about twenty percent for Thailand.
According to the new measure that takes into account indirect effect of the neighbors’ exchange rate, the actual exchange rate is judged to be more or less right levels just before the crisis. The degree of misalignment is less in coordinated basket values than in uncoordinated basket values. According to this view, the exchange rate was not the problem for the Asian currency crisis.
Figures 4-U. Uncoordinated Basket Exchange Rate,
Real exchange rate, weight= export /total export, 1995M1=100
China
1995M1=100
1990M1-1997M6 Real Exchange Rate
40 60 80 100 120 140 1 1 1 1 1 1 1 1 China UNCCN1 Indonesia 1995M1=100 1990M1-1997M6 Real Exchange Rate
60 80 100 120 1990 : M1 1991 : M1 1992 : M1 1993 : M1 1994 : M1 1995 : M1 1996 : M1 1997 : M1 ID UNCID1 Korea 1995M1=100 1990M1-1997M6 Real Exchange Rae
60 80 100 120 KR UNCKR1
Malaysia
1995M1=100
1990M1-1997M6 Real Exchange Rate
60 80 100 120 140 1990 : M1 1991 : M1 1992 : M1 1993 : M1 1994 : M1 1995 : M1 1996 : M1 1997 : M1 MY UNCMY1 Philippines 1995M1=100 1990M1-1997M6 Real Exchange Rate
60 80 100 120 140 1990 : M1 1991 : M1 1992 : M1 1993 : M1 1994 : M1 1995 : M1 1996 : M1 1997 : M1 PH UNCPH1 Singapore 1995M1=100 1990M1-1997M6 Real Exchange Rate
60 80 100 120 140 1990 : M1 1991 : M1 1992 : M1 1993 : M1 1994 : M1 1995 : M1 1996 : M1 1997 : M1 SG UNCSG1 Thailand 1995M1=100 1990M1-1997M6 Real Exchange Rate
60 80 100 120 140 160 1990 : M1 1991 : M1 1992 : M1 1993 : M1 1994 : M1 1995 : M1 1996 : M1 1997 : M1 TH UNCTH1
Coordinated, weight= export /total export, 1995M1=100 Real exchange rate
Figure 4-C
China
1995M1=100
1990M1-1997M6 Real Exchange Rate
40 60 80 100 120 140 : M1 : M1 : M1 : M1 : M1 : M1 : M1 : M1 China CCN1 Indonesia 1995M 1=100 1990M 1-1997M 6 RealExchange Rate 60 80 100 120 140 160 1990 : M1 1991 : M1 1992 : M1 1993 : M1 1994 : M1 1995 : M1 1996 : M1 1997 : M1 ID CID1 Korea 1995M1=100 1990M1-1997M6 Real Exchange Rate
60 80 100 120 140 1 1 1 1 1 1 1 1 KR CKR1
Malaysia
1995M1=100
1990M1-1997M6 Real Exchange Rate
60 70 80 90 100 110 120 130 1990 : M1 1991 : M1 1992 : M1 1993 : M1 1994 : M1 1995 : M1 1996 : M1 1997 : M1 MY CMY1 Philippines 1995M1=100 1990M1-1997M6 Real Exchange Rate
60 70 80 90 100 110 120 130 1990 : M1 1991 : M1 1992 : M1 1993 : M1 1994 : M1 1995 : M1 1996 : M1 1997 : M1 PH CPH1 Singapore 1995M1=10 1990M1-1997M6 Real Exchange Rate
60 70 80 90 100 110 120 130 1990 : M1 1991 : M1 1992 : M1 1993 : M1 1994 : M1 1995 : M1 1996 : M1 1997 : M1 SG CSG1 Thailand 1995M1=100 1990M1-1997M6 Real Exchange Rate
60 70 80 90 100 110 120 1990 : M1 1991 : M1 1992 : M1 1993 : M1 1994 : M1 1995 : M1 1996 : M1 1997 : M1 TH CTH1
The next set of the figures show the uncoordinated basket and coordinated basket currencies for 1990-2000 (extension by three and half years), Figures 4-UU and 4-CC. For the post-crisis period, there are interesting phenomena. All uncoordinated basket currencies, except Indonesia, show a wild fluctuation. That mirrors the wild fluctuations in the actual exchange rates of Indonesia. Since the uncoordinated exchange rate is influenced with exchange rates of the neighboring countries, the large depreciation of the Indonesian rupiah affects the calculation of the uncoordinated basket exchanger rates of the neighboring countries. If the countries had followed the uncoordinated basket exchange rate, it would have caused competitive devaluation. This would not have happened if the countries had adopted the coordinated basket currencies. In fact, the currencies would not have depreciated as much as they actually did. The large depreciations in the post-crisis period might have been avoided, if the Asian countries acted together not to depreciate, and it might have been feasible. Although the calculation is admittedly crude, and based on many simplifying assumptions, this may be a first step to refine the formula for coordinated basket currencies for the region.
These results imply some aspects of basket currencies, that may be relevant in normal and crisis period. The basket currencies are designed to prevent over-valuation and under-valuation of a currency in terms of the real effective exchange rate. During a normal time, that is not a turbulent crisis period, the gradual fluctuations among the major currencies would affect the real effective exchange rate. The basket currencies, that are designed to track the real effective exchange rate, would avoid this problem. However, if the neighboring countries are adopting the non-basket currencies, the basket currencies would not be optimal for the region. The coordinated basket currencies would be more flexible, because that would avoid the neighboring countries’ inappropriate fixed exchange rates. However, this intuition was not clearly shown in the Asian currencies for the period of 1995-97. The coordinated basket values are closer to the actual exchange rate than the uncoordinated ones.
During the turbulent period, the uncoordinated basket may invite competitive devaluation, when one currency obviously deviated from a long-run value due to political or market turmoil. This is clearly shown in Asian cases in the 1997-2000 period in uncoordinated basket values due to influences from the Indonesian
Uncoordinated, weight= export /total export, 1995M1=100 Figure 4-UU, Real exchange rate, 1990-2000
China
1995M1=100
1990M1- 2000M12 Real Exchange Rate
0 50 100 150 200 250 300 350 400 1990 : M1 1991 : M1 1992 : M1 1993 : M1 1994 : M1 1995 : M1 1996 : M1 1997 : M1 1998 : M1 1999 : M1 2000 : M1 China UNCCN1 Indonesia 1995M1=100 1990M1- 2000M12 Real Exchange Rate
0 100 200 300 400 500 600 1990 : M1 1991 : M1 1992 : M1 1993 : M1 1994 : M1 1995 : M1 1996 : M1 1997 : M1 1998 : M1 1999 : M1 2000 : M1 ID UNCID1 Korea 1995M1=100 1990M1- 2000M12 Real Exchange Rate
0 100 200 300 400 500 600 1990 : M1 1991 : M1 1992 : M1 1993 : M1 1994 : M1 1995 : M1 1996 : M1 1997 : M1 1998 : M1 1999 : M1 2000 : M1 KR UNCKR1
Malaysia
1995M1=100
1990M1- 2000M12 Real Exchange Rate
0 100 200 300 400 500 1990 : M1 1991 : M1 1992 : M1 1993 : M1 1994 : M1 1995 : M1 1996 : M1 1997 : M1 1998 : M1 1999 : M1 2000 : M1 MY UNCMY1 Philippines 1995M1=100 1990M1- 2000M12 Real Exchange Rate
150 200 250 300 350 PH UNCPH1 Singapore 1995M1=100 1990M1- 2000M12 Real Exchange Rate
0 50 100 150 200 1990 : M1 1991 : M1 1992 : M1 1993 : M1 1994 : M1 1995 : M1 1996 : M1 1997 : M1 1998 : M1 1999 : M1 2000 : M1 SG UNCSG1 Thailand 1995M1=100 1990M1- 2000M12 Real Exchange Rate
300 400 500 600 700 800 TH UNCTH1
Coordinated, weight= export /total export, 1995M1=100 Figure 4-CC, Real exchange rate, 1990-2000
China
1995M1=100
1990M1- 2000M12 Real Exchange Rate
0 20 40 60 80 100 120 140 1990 : M1 1991 : M1 1992 : M1 1993 : M1 1994 : M1 1995 : M1 1996 : M1 1997 : M1 1998 : M1 1999 : M1 2000 : M1 China CCN1 Indonesia 1995M1=100 1990M1- 2000M12 Real Exchange Rate
0 100 200 300 400 500 600 1990 : M1 1991 : M1 1992 : M1 1993 : M1 1994 : M1 1995 : M1 1996 : M1 1997 : M1 1998 : M1 1999 : M1 2000 : M1 ID CID1 Korea 1995M1=100 1990M1- 2000M12 Real Exchange Rate
0 50 100 150 200 1990 : M1 1991 : M1 1992 : M1 1993 : M1 1994 : M1 1995 : M1 1996 : M1 1997 : M1 1998 : M1 1999 : M1 2000 : M1 KR CKR1
Malaysia
1995M1=100
1990M1- 2000M12 Real Exchange Rate
0 50 100 150 200 1990 : M1 1991 : M1 1992 : M1 1993 : M1 1994 : M1 1995 : M1 1996 : M1 1997 : M1 1998 : M1 1999 : M1 2000 : M1 MY CMY1 Philippines 1995M1=100 1990M1- 2000M12 Real Exchange Rate
50 100 150 200 250 PH CPH1 Singapore 1995M1=100 1990M1- 2000M12 Real Exchange Rate
0 20 40 60 80 100 120 140 1990 : M1 1991 : M1 1992 : M1 1993 : M1 1994 : M1 1995 : M1 1996 : M1 1997 : M1 1998 : M1 1999 : M1 2000 : M1 SG CSG1 Thailand 1995M1=100 1990M1- 2000M12 Real Exchange Rate
50 100 150 200 TH CTH1
5. Common
Basket
In order to adopt the coordinated baskets, each country has to calculate the coordinated basket weights (cij) using other countries weights and inverting the (I-A) matrix. This may not be practical. When the coordinated basket is to be introduced, it may be easier, politically and practically, to promote a common basket, the weighted average of coordinated baskets of the regional economy. If basket weights of (Yen, Dollar, Euro) are similar to each other, each basket is similar to the GDP-weighted average. If one country’s basket is radically different from another, this may cause a deviation between the country’s basket and the common basket (if this is a small country) or deviations in all other countries (if this is a large country).
The GDP-weighted average is calculated from coordinated basket weights of the seven countries in our sample. If the GDP-weighted average common basket shows the values close to idiosyncratic basket values, the common basket may be sufficient for all practical purposes.
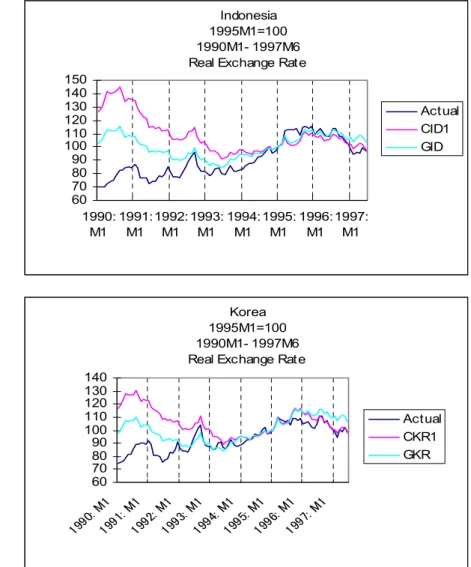
Figure 5 (panels 1 through 7) shows how approximate the common basket values would have been compared to the coordinated baskets that are different from country to another. For most countries, the common basket values is very similar to the coordinated basket values for the period of 1990-97. (The result is similar for the period 1997-2000, too.) This shows that the common basket is good enough to simulate coordinated basket calculated for individual countries. The advantage is that one common basket is calculated, so that coordination becomes automatic when all participating countries adopt the common basket. The shortcoming is that an agency, say, a secretariat for the regional cooperation, has to do the calculation and publish the common basket weights.
Figure 5: Common Basket
Coordinated, weight= export /total export, GDP-weighted Average, 1995M1=100 Real exchange rate
China
1995M1=100
1990M1-1997M6 Real Exchange Rate
40 50 60 70 80 90 100 110 120 130 Actual CCN1 GCN Indonesia 1995M1=100 1990M1-1997M6 Real Exchange Rate
60 70 80 90 100 110 120 130 140 150 1990: M1 1991: M1 1992: M1 1993: M1 1994: M1 1995: M1 1996: M1 1997: M1 Actual CID1 GID Korea 1995M1=100 1990M1-1997M6 Real Exchange Rate
60 70 80 90 100 110 120 130 140 1 1 1 1 1 1 1 1 Actual CKR1 GKR
Malaysia
1995M1=100
1990M1-1997M6 Real Exchange Rate
60 70 80 90 100 110 120 130 1990 : M1 1991 : M1 1992 : M1 1993 : M1 1994 : M1 1995 : M1 1996 : M1 1997 : M1 Actual CMY1 GMY Philippines 1995M1=100 1990M1-1997M6 Real Exchange Rate
60 70 80 90 100 110 120 130 1990 : M1 1991 : M1 1992 : M1 1993 : M1 1994 : M1 1995 : M1 1996 : M1 1997 : M1 Actual CPH1 GPH Singapore 1995M1=100 1990M1-1997M6 Real Exchange Rate
60 70 80 90 100 110 120 130 1990 : M1 1991 : M1 1992 : M1 1993 : M1 1994 : M1 1995 : M1 1996 : M1 1997 : M1 Actual CSG1 GSG Thailand 1995M1=100 1990M1-1997M6 Real Exchange Rate
60 70 80 90 100 110 120 1990 : M1 1991 : M1 1992 : M1 1993 : M1 1994 : M1 1995 : M1 1996 : M1 1997 : M1 Actual CTH1 GTH
6.
Summary and Policy Recommendations
This paper showed two ways to calculate the basket currency values for Asian countries, one without coordination and one with coordination. The results are mixed. Although the coordinated solution is theoretically make sense, it does not produce a usual result of the actual exchange rate having been overvalued before the Asian currency crisis. However, in the post-crisis period, the coordinated solution is better than the uncoordinated one, and actually it would have pointed to more appreciation than the actual rate turned out to be. This is because the uncoordinated one would have produced large depreciation in countries other than Indonesia, because Indonesia had a very large depreciation. The coordinated solution would have preferred a stable exchange rate. In other words, the coordination would have produced more stable exchange rate dynamics in the post crisis period.
Policy coordination in the exchange rate policies among the Asian countries is desirable to produce stability in their real effective exchange rate system. It would avoid competitive devaluation by calculating the stable real effective exchange rate only from major currencies outside the region. In the sense this is close to what was practiced in Europe before the introduction of Euro—fixing the exchange rate each other but float jointly against the outside.
The coordination can be complex if we are to apply the method proposed in this paper. In order to make it more practical, a common basket, or an Asian currency unit, can be introduced. Each country can peg its currency to the Asian currency unit, with some band. When deviations of their idiosyncratic weights (coordinated solution) on (Yen, Dollar, Euro) from ones in the common basket are small enough, as shown in this paper, the common basket is easier, politically and practically, to be adopted. Coordination comes with the common basket automatically. More coordination can be enhanced by an introduction of the Asian currency unit. This will be the next step in search for the best exchange rate arrangement for the Region.
Another important topic to be explored further is whether the Yen could be in the region under consideration rather than the outside the region. In this paper, it is treated to be outside the region, and the region consists of non-Japan Asia. However, an analogy from Europe would be that Japan should coordinate with other Asian
References
Bénassy-Quéré, Agnès (1999) “Optimal Pegs for East Asian Currencies,” Journal of the Japanese and International Economies, vol. 13, 44-60.
Calvo, Guillermo A. and Reinhart, Carmen M., (2000). “Fear of Floating”, NBER working paper, no. 7993, November.
Ito, Takatoshi (1999a). “Asian Currency Crisis: Its Origin and backgrounds”
Journal Development Assistance vol. 5 no. 1, August: 108-141.
Ito, Takatoshi (1999b). “Capital Flows in East and Southeast Asia,” in M. Feldstein (ed.) International Capital Flows, NBER-University of Chicago Press: 111-132. Ito, Takatoshi (2000). “Capital Flows in Asia” in Sebastian Edwards (ed.), Capital
Flows and the Emerging Economies, NBER-University of Chicago Press: 255-296. Ito, Takatoshi; Ogawa, Eiji; and Sasaki, Yuri N. (1998). “How did the Dollar Peg
Fail in Asia,” Journal of the Japanese and International Economies, vol. 12: 256-304.
Ogawa, Eiji and Ito, Takatoshi (2002). “On the Desirability of a Regional Basket Currency Arrangement,” Journal of the Japanese and International Economies, (forthcoming).
Williamson, John (2000). Exchange Rate Regimes for Emerging Markets: Reviving the Intermediate Option, Washington, D.C.: Institute for International Economics, September.