GMAC
Geographic Trend Report for Examinees Taking the
Graduate Management Admission Test
®Johnette Peyton GMAC ® Research Reports • RR-05-02 • June 7, 2005
Introduction
The Geographic Trend Report contains geographic and biographical data describing the population of examinees taking the Graduate Management Admission Test (GMAT®) during testing years (TY) 2000 and 2004. The data was analyzed in an attempt to identify geographic and migratory trends among GMAT® test-takers.
According to a recent article by Richard Florida in the Harvard Business Review1 (2004), students are a leading indicator of global talent flows, and countries and regions that attract students have a leg up on retaining them and on attracting other pools of foreign talent. As such, the flow of student migrations gives indication as to the health and trends of the future global economy.
Data from the 190,264 records of test-takers in TY 2000 and the 206,852 records of test-takers in TY 2004 who took the GMAT® one or more times during these years are summarized in the figures included in this report. This information was obtained from test-taker responses to the biological information questionnaire, score report information from test-taker records, and other registration information for testing years beginning July 1 and ending June 30.
Executive Summary
There are two ways to look at demand—registrations within a country and score reports sent to a country. This report looks at the volume of score reports sent to a
regions such as Canada and Asia appear to have strong regional preferences with regards to where they would like to attend graduate school, while other regions appear to be more “global” in their choice of location. In locations that have high demand but are netting fewer applications, there appears to be a disconnect in the pipeline between
taking the GMAT® and completing the application
process.
Key findings of the report include—
• Overall, the United States continues to be the number one choice for test-takers, but general interest in study within the United States has decreased for most regions of the world1.
• While there has been a reduced interest in sending reports to the United States, there has been increased interest in sending reports to Canada and England.
• U.S. citizens are very unlikely to attend a Non-U.S. business school.
• The majority of Canadian citizens seem to prefer to study in Canada.
• Test-takers from Western Europe have an increasing desire to study closer to home.
• External factors such as immigration laws are likely affecting where test-takers ultimately decide to enroll.
• The percentage of score reports received by U.S. schools from Central Asian citizens has decreased dramatically from TY 2000 to TY 2004.
• Middle Eastern citizens, who previously showed strong interest in studying in the United States, now appear to prefer to study close to their native region.
Background
Within the United States, numerous studies have found that college students are more likely to migrate than those with a high school education, which may indicate a relationship between higher education and adaptability. According to Yolanda Kodrzycki’s 2001 study on the migration of college graduates, for college graduates, most shifts in location take place shortly after graduation2. It is also noted that in the general population the propensity to migrate is about twice as high between the age of 22 to 24 than at age 30 (Eberts, 1992, as cited in Kodrzycki, 2001). This finding is particularly relevant among the GMAT® test-taker population within the United States, as the average age is 28.
Among non-U.S. test-takers, there are a number of factors that may affect decisions to study in the United States or elsewhere—such as improved quality of schools and delays in the Visa obtainment process. These, along with improved global economies, have resulted in a shift in education and the global work force in recent years. Several major economies—most notably, India’s and China’s—have grown to the point where they can offer competitive opportunities for people who stay or return
home (Florida, 2004). According to Florida (2004), both of these countries are investing heavily to build competitive university systems of their own. Also, degree standardizations introduced with the Bologna Accord in 1999 have now been adopted by 40 countries, which has clarified requirements and simplified the application process for graduate programs, including the MBA, around the globe.
Location of GMAT® Test-Takers
Geographic data gathered for TY 2000 and TY 2004 include mailing address at time of registration and country of citizenship. Although the majority of tests are taken within the United States, GMAT® test-takers span the globe, as illustrated in Figures 1 and 2. Sixty-six percent of the test-takers had U.S. addresses at the time of registration in TY 2000, which increased to 68% of test-takers in TY 2004. The next largest concentrations in both testing years came from Asia and Western Europe, with approximately 12% and 7% of the test-taker population, respectively.
Figures 3 and 4 display tests taken by U.S. state. This includes all test-takers residing in the United States at the time of the test. Among GMAT® test takers with a U.S. address, the greatest concentrations at the state level were from California, Texas, and New York.
The tables throughout this report show a comparison of the 10 countries with the most score report submissions for TY 2000 and TY 2004. The tables show the percentage of score reports received per country, the total number of score reports sent, and the average number of score reports that were sent per person. The tables display data for the entire test-taker group as well as a breakdown of information from the “typical” graduate business school candidate demographic, individuals in the 25 to 30 age group with
three to five years of work experience. These tables provide analysis of score reporting behavior for citizenship regions in the United States, Canada, Western Europe, Eastern Europe, Asia, Central Asia, Africa, Middle East, Australia/Pacific Island, and Mexico/Caribbean/Latin America. The numbers are based on the total tests taken by those who responded to the citizenship and/or age
questions in the GMAT® biological information
questions.
Findings
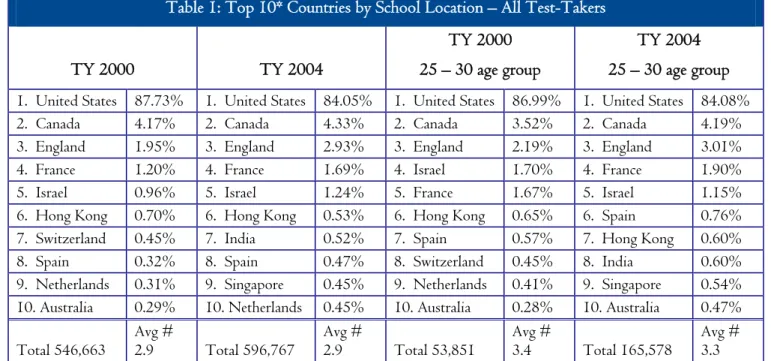
Table 1: Top 10* Countries by School Location – All Test-Takers
TY 2000 TY 2004
TY 2000 25 – 30 age group
TY 2004 25 – 30 age group
1. United States 87.73% 1. United States 84.05% 1. United States 86.99% 1. United States 84.08% 2. Canada 4.17% 2. Canada 4.33% 2. Canada 3.52% 2. Canada 4.19% 3. England 1.95% 3. England 2.93% 3. England 2.19% 3. England 3.01% 4. France 1.20% 4. France 1.69% 4. Israel 1.70% 4. France 1.90% 5. Israel 0.96% 5. Israel 1.24% 5. France 1.67% 5. Israel 1.15% 6. Hong Kong 0.70% 6. Hong Kong 0.53% 6. Hong Kong 0.65% 6. Spain 0.76% 7. Switzerland 0.45% 7. India 0.52% 7. Spain 0.57% 7. Hong Kong 0.60% 8. Spain 0.32% 8. Spain 0.47% 8. Switzerland 0.45% 8. India 0.60% 9. Netherlands 0.31% 9. Singapore 0.45% 9. Netherlands 0.41% 9. Singapore 0.54% 10. Australia 0.29% 10. Netherlands 0.45% 10. Australia 0.28% 10. Australia 0.47% Total 546,663 Avg # 2.9 Total 596,767 Avg # 2.9 Total 53,851 Avg # 3.4 Total 165,578 Avg # 3.3 *based on number of score reports received
Overall, test report submissions for both the years TY 2000 and TY 2004 suggest test-takers would strongly prefer to study at schools located within the United States. However, there was a slight drop in percentage for submissions in TY 2004 from TY 2000 for all test-takers, including those in the 25 to 30 age
group with three to five years of work experience. Increasing interest in studying in England, France, India, and Singapore account for most of the decreased percentage of score reports received by U.S. schools from TY 2000 to TY 2004.
U.S. Citizens
Table 2: Top 10* Countries by School Location – U.S. Citizens
TY 2000 TY 2004
TY 2000 25 – 30 age group
TY 2004 25 – 30 age group
1. United States 98.86% 1. United States 98.43% 1. United States 98.73% 1. United States 98.26% 2. England 0.31% 2. England 0.49% 2. England 0.33% 2. England 0.58% 3. France 0.21% 3. France 0.28% 3. France 0.24% 3. France 0.37% 4. Canada 0.10% 4. Canada 0.15% 4. Spain 0.12% 4. Spain 0.20% 5. Switzerland 0.08% 5. Spain 0.14% 5. Switzerland 0.08% 5. Canada 0.14% 6. Spain 0.06% 6. Switzerland 0.05% 6. Australia 0.06% 6. Israel 0.05% 7. Lebanon 0.05% 7. Netherlands 0.05% 7. Ireland 0.06% 7. Australia 0.05% 8. Australia 0.03% 8. Australia 0.05% 8. Canada 0.05% 8. Switzerland 0.05% 9. Netherlands 0.03% 9. Israel 0.04% 9. Netherlands 0.05% 9. Italy 0.04% 10. Puerto Rico 0.03% 10. Italy 0.04% 10. Israel 0.04% 10. Netherlands 0.04% Total 282,738 Avg #
2.8 Total 320,847 Avg # 2.8 Total 25,089 Avg # 3.4 Total 90,864 Avg # 3.2 *based on number of score reports received
U.S. citizens appear to strongly prefer to study within the United States, with nearly 100% of their score reports being sent to U.S. schools. Among U.S. citizens, schools located in England made the greatest gains by increasing their percentage of score reports received from 0.3% to 0.5% from TY 2000 to TY 2004. Non-U.S. schools fared slightly better among those in the 25 to 30 age group, with England, France, and Spain all doubling their percent of score reports received from TY 2000 to TY 2004. Also, the 25 to 30 age group is showing much more interest in studying in Canada and Israel, with both countries experiencing significant jumps in the rankings from TY 2000 to TY 2004.
Implications
• U.S. citizens are very unlikely to attend a Non-U.S. business school.
• Barriers that may exist include distance, cost, proximity to job, application requirements, and the large selection of U.S. business schools available.
• Non-U.S. business schools should take regional preference factors into consideration when marketing to U.S. citizens and emphasize attributes of their programs that may outweigh barriers such as distance, requirements, and the availability of schools in the United States.
Canadian Citizens
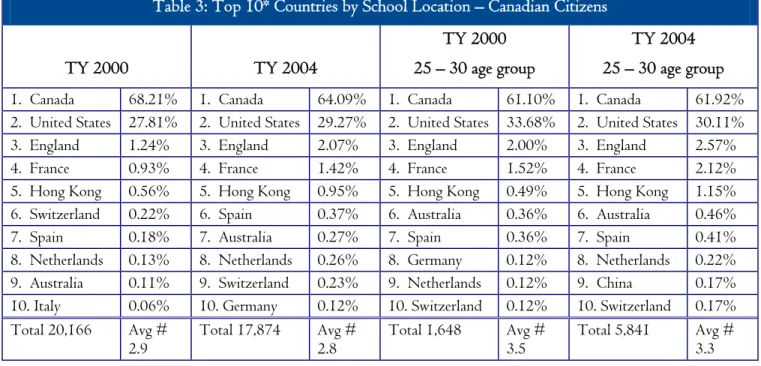
Table 3: Top 10* Countries by School Location – Canadian Citizens
TY 2000 TY 2004
TY 2000 25 – 30 age group
TY 2004 25 – 30 age group
1. Canada 68.21% 1. Canada 64.09% 1. Canada 61.10% 1. Canada 61.92% 2. United States 27.81% 2. United States 29.27% 2. United States 33.68% 2. United States 30.11% 3. England 1.24% 3. England 2.07% 3. England 2.00% 3. England 2.57% 4. France 0.93% 4. France 1.42% 4. France 1.52% 4. France 2.12% 5. Hong Kong 0.56% 5. Hong Kong 0.95% 5. Hong Kong 0.49% 5. Hong Kong 1.15% 6. Switzerland 0.22% 6. Spain 0.37% 6. Australia 0.36% 6. Australia 0.46% 7. Spain 0.18% 7. Australia 0.27% 7. Spain 0.36% 7. Spain 0.41% 8. Netherlands 0.13% 8. Netherlands 0.26% 8. Germany 0.12% 8. Netherlands 0.22% 9. Australia 0.11% 9. Switzerland 0.23% 9. Netherlands 0.12% 9. China 0.17% 10. Italy 0.06% 10. Germany 0.12% 10. Switzerland 0.12% 10. Switzerland 0.17% Total 20,166 Avg #
2.9 Total 17,874 Avg # 2.8 Total 1,648 Avg # 3.5 Total 5,841 Avg # 3.3 *based on number of score reports received
Although Canadian citizens overall appear to prefer to study in Canada, that percentage has decreased slightly from TY 2000 to TY 2004. This is primarily due to more test-taker interest in studying in the United States, England, France, and Hong Kong. The reverse is true for Canadian citizens among the 25 to 30 age group, from which there was a slightly higher percentage of score reports sent to Canadian schools and fewer score reports sent to U.S. schools from TY 2000 to TY 2004. Also, China, which does not appear in any other column for the top 10 among Canadian citizens, was ranked ninth in the 25 to 30 age group in TY 2004.
Implications
• While the majority of Canadian citizens appear to prefer to study in Canada, there continues to be a significant interest in studying in the United States.
• Canadian citizens in the 25 to 30 age group are slightly more likely to consider studying outside of Canada.
• The top five countries for report submissions remained the same for each of the years and groups studied. Schools outside of the top five have much ground to cover to break apparent regional preferences of Canadian citizens.
Western Europe
Table 4: Top 10* Countries by School Location – Western European Citizens
TY 2000 TY 2004
TY 2000 25 – 30 age group
TY 2004 25 – 30 age group
1. United States 60.13% 1. United States 46.87% 1. United States 63.06% 1. United States 54.98% 2. England 11.66% 2. England 13.23% 2. France 10.76% 2. England 12.16% 3. France 8.62% 3. France 10.39% 3. England 9.83% 3. France 10.52% 4. Switzerland 3.34% 4. Greece 4.95% 4. Switzerland 3.22% 4. Spain 5.38% 5. Spain 2.24% 5. Spain 3.43% 5. Spain 3.09% 5. Switzerland 2.59% 6. Netherlands 2.19% 6. Netherlands 2.98% 6. Netherlands 2.35% 6. Netherlands 2.38% 7. Greece 1.76% 7. Switzerland 2.97% 7. Canada 1.80% 7. Portugal 1.89% 8. Canada 1.51% 8. Turkey 2.37% 8. Portugal 1.30% 8. Canada 1.82% 9. Turkey 1.42% 9. Canada 2.22% 9. Italy 1.12% 9. Italy 1.60% 10. Italy 1.08% 10. Portugal 1.85% 10. Finland 0.47% 10. Ireland 0.96% Total 31,530 Avg #
2.4 Total 35,335 Avg # 2.3 Total 4,007 Avg # 2.9 Total 9,892 Avg # 2.7 *based on number of score reports received
Interest among Western European citizens in studying in the United States decreased dramatically from TY 2000 to TY 2004. Test-takers from the Western European region appear to have an increasing desire to remain closer to home, with the majority of the top 10 countries of interest located in Western Europe. However, the 25 to 30 age group is continuing to show a strong interest in studying in the United States. From TY 2000 to TY 2004, Greece rose significantly in the rankings among all test-takers, from seventh to fourth, although Greece does not appear in the top 10 for the 25 to 30 age group in either TY 2000 or TY 2004.
Implications
• Studying in the United States is not as alluring as it once was to Western European citizens, potentially due to program improvements in the area but also likely affected by delays in Visa applications, increases in quality programs, and increases in career
opportunities.
• U.S. schools are most likely popular in this region based upon reputation, but they are facing increased competition from schools located within Western Europe.
• Since test-takers from Western Europe appear to exhibit strong preferences for staying close to their
Eastern Europe
Table 5: Top 10* Countries by School Location – Eastern European Citizens
TY 2000 TY 2004
TY 2000 25 – 30 age group
TY 2004 25 – 30 age group
1. United States 75.34% 1. United States 74.55% 1. United States 70.63% 1. United States 75.83% 2. England 5.80% 2. England 6.30% 2. England 7.14% 2. England 5.90% 3. France 4.28% 3. Canada 5.13% 3. France 5.87% 3. Canada 4.13% 4. Canada 3.96% 4. France 3.87% 4. Canada 4.09% 4. France 4.00% 5. Spain 2.40% 5. Netherlands 1.80% 5. Spain 3.35% 5. Spain 2.13% 6. Netherlands 2.14% 6. Spain 1.43% 6. Netherlands 3.12% 6. Switzerland 1.43% 7. Switzerland 1.60% 7. Switzerland 1.30% 7. Switzerland 1.26% 7. Netherlands 1.37% 8. Hungary 0.89% 8. Germany 0.93% 8. Italy 0.67% 8. Germany 0.77% 9. Italy 0.51% 9. Hungary 0.75% 9. Hungary 0.59% 9. Hungary 0.73% 10. Armenia 0.47% 10. Italy 0.66% 10. Australia 0.45% 10. Italy 0.67% Total 11,881 Avg #
3.2 Total 11,772 Avg # 2.8 Total 1,345 Avg # 3.8 Total 3,000 Avg # 3.0 *based on number of score reports received
The majority of Eastern European citizens appear to prefer to study in the United States, with only a small drop in percentage from TY 2000 to TY 2004. Among the 25 to 30 age group, however, the percentage of submissions sent to U.S. schools increased from TY 2000 to TY 2004, resulting in decreased interest among this group in studying in England, France, Spain, and the Netherlands. This trend is the same for all Eastern European test-takers with the exception of England. Both groups show an increased interest in studying in Canada and Germany in TY 2004.
Implications
• Distance is not a factor for these test-takers, as Eastern Europeans appear to strongly prefer to study in the United States.
• Eastern European citizens exhibit little desire to study close to their native region, with only one or two Eastern European countries making the top 10.
• Citizens from this region appear to be losing interest in studying at schools located in Western Europe.
Asian Citizens
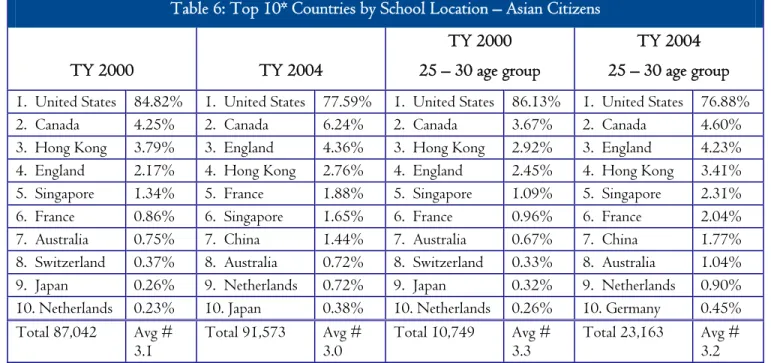
Table 6: Top 10* Countries by School Location – Asian Citizens
TY 2000 TY 2004
TY 2000 25 – 30 age group
TY 2004 25 – 30 age group
1. United States 84.82% 1. United States 77.59% 1. United States 86.13% 1. United States 76.88% 2. Canada 4.25% 2. Canada 6.24% 2. Canada 3.67% 2. Canada 4.60% 3. Hong Kong 3.79% 3. England 4.36% 3. Hong Kong 2.92% 3. England 4.23% 4. England 2.17% 4. Hong Kong 2.76% 4. England 2.45% 4. Hong Kong 3.41% 5. Singapore 1.34% 5. France 1.88% 5. Singapore 1.09% 5. Singapore 2.31% 6. France 0.86% 6. Singapore 1.65% 6. France 0.96% 6. France 2.04% 7. Australia 0.75% 7. China 1.44% 7. Australia 0.67% 7. China 1.77% 8. Switzerland 0.37% 8. Australia 0.72% 8. Switzerland 0.33% 8. Australia 1.04% 9. Japan 0.26% 9. Netherlands 0.72% 9. Japan 0.32% 9. Netherlands 0.90% 10. Netherlands 0.23% 10. Japan 0.38% 10. Netherlands 0.26% 10. Germany 0.45% Total 87,042 Avg #
3.1 Total 91,573 Avg # 3.0 Total 10,749 Avg # 3.3 Total 23,163 Avg # 3.2 *based on number of score reports received
Although the percentage of Asian citizens who would like to study in the United States has decreased from TY 2000 to TY 2004, the United States still appears to be their preferred location of study. Canada is a distant second, while England has replaced Hong Kong as third from TY 2000 to TY 2004. China, which was not in the top 10 in TY 2000, is now ranked seventh among all Asian citizens, as well as among those in the 25 to 30 age group. In TY 2004, Asian citizens were more interested in studying in Canada, England, China, France, and Singapore than they had been in TY 2000.
Implications
• While there appears to be a strong preference by Asian citizens to study in the United States, external factors such as tougher immigration laws, a perceived decrease in the cost-benefit ratio, and increased educational opportunities made available in Asia may affect where test-takers ultimately decide to enroll.
• Asian citizens in the 25 to 30 age group are slightly more likely to indicate a desire to stay within their native region.
Central Asian Citizens
Table 7: Top 10* Countries by School Location – Central Asian Citizens
TY 2000 TY 2004
TY 2000 25 – 30 age group
TY 2004 25 – 30 age group
1. United States 90.77% 1. United States 75.89% 1. United States 90.86% 1. United States 73.56% 2. Canada 2.88% 2. Canada 5.48% 2. Canada 3.60% 2. India 5.91% 3. England 2.20% 3. England 5.25% 3. England 2.09% 3. England 5.77% 4. France 1.15% 4. India 5.01% 4. France 1.36% 4. Canada 5.15% 5. India 0.47% 5. France 2.23% 5. Singapore 0.44% 5. France 3.11% 6. Singapore 0.42% 6. Singapore 1.65% 6. India 0.34% 6. Singapore 2.03% 7. Switzerland 0.39% 7. Australia 1.15% 7. Switzerland 0.29% 7. Australia 1.35% 8. Pakistan 0.32% 8. Pakistan 0.66% 8. Spain 0.24% 8. Philippines 0.62% 9. Australia 0.30% 9. Philippines 0.50% 9. Netherlands 0.19% 9. Netherlands 0.52% 10. Philippines 0.19% 10. Switzerland 0.45% 10. Australia 0.15% 10. Switzerland 0.46% Total 35,130 Avg #
4.6 Total 59,835 Avg # 4.2 Total 2,057 Avg # 5.2 Total 16,421 Avg # 4.5 *based on number of score reports received
The percentage of score reports received by U.S. schools from Central Asian citizens has decreased dramatically from TY 2000 to TY 2004, but no particular region appears to have gained substantially from this change. Instead, test-takers from Central Asia appear to be more “global” in their choice of school location. For all citizens from this region from TY 2000 to TY 2004, there was increased interest in studying in India, Canada, England, and Singapore. Those in the 25 to 30 age group appear slightly less interested in studying in the United States and more interested in studying in India, England, and France.
Implications
• Non-U.S. schools in general will gain from this region’s decreasing interest in studying in the United States, as they do not appear to have any particular regional preferences.
• Interest in studying in India increased greatly in this region from TY 2000 to TY 2004. This may be due not only to more business schools made available in India, but also to more schools in India requiring the GMAT®.
African Citizens
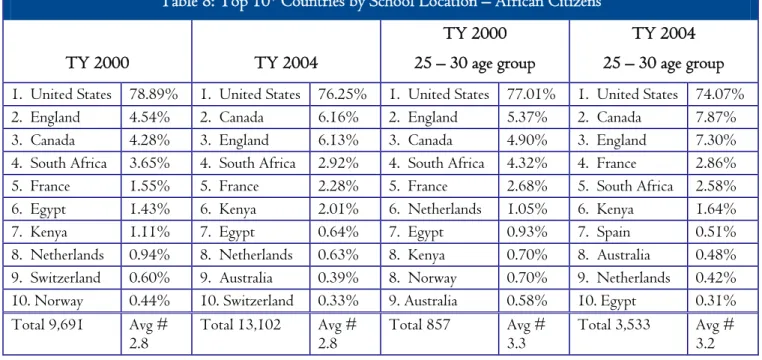
Table 8: Top 10* Countries by School Location – African Citizens
TY 2000 TY 2004
TY 2000 25 – 30 age group
TY 2004 25 – 30 age group
1. United States 78.89% 1. United States 76.25% 1. United States 77.01% 1. United States 74.07% 2. England 4.54% 2. Canada 6.16% 2. England 5.37% 2. Canada 7.87% 3. Canada 4.28% 3. England 6.13% 3. Canada 4.90% 3. England 7.30% 4. South Africa 3.65% 4. South Africa 2.92% 4. South Africa 4.32% 4. France 2.86% 5. France 1.55% 5. France 2.28% 5. France 2.68% 5. South Africa 2.58% 6. Egypt 1.43% 6. Kenya 2.01% 6. Netherlands 1.05% 6. Kenya 1.64% 7. Kenya 1.11% 7. Egypt 0.64% 7. Egypt 0.93% 7. Spain 0.51% 8. Netherlands 0.94% 8. Netherlands 0.63% 8. Kenya 0.70% 8. Australia 0.48% 9. Switzerland 0.60% 9. Australia 0.39% 8. Norway 0.70% 9. Netherlands 0.42% 10. Norway 0.44% 10. Switzerland 0.33% 9. Australia 0.58% 10. Egypt 0.31% Total 9,691 Avg #
2.8 Total 13,102 Avg # 2.8 Total 857 Avg # 3.3 Total 3,533 Avg # 3.2 *based on number of score reports received
Although there was a slight decrease in the percentage of score reports sent to U.S. schools by African citizens, the United States still appears to be their preferred place to study. Since TY 2000, Canada has replaced England as second in their list of top 10 countries in which to study. South Africa and Egypt are still somewhat popular overall, but have become less popular among those in the 25 to 30 age group from TY 2000 to TY 2004. The 25 to 30 age group now seems more interested in studying in Kenya and Spain.
Implications
• The majority of African citizens appear to prefer to study in the United States. For these test-takers, distance and other associated obstacles do not appear to be factors.
• There is more interest in studying in Canada and England among test-takers in the 25 to 30 age group.
• Test-takers from this region appear to have strong regional preferences for study locations, as there has been very little change among countries appearing in the rankings.
Middle Eastern Citizens
Table 9: Top 10* Countries by School Location – Middle Eastern Citizens
TY 2000 TY 2004
TY 2000 25 – 30 age group
TY 2004 25 – 30 age group
1. United States 48.44% 1. Israel 49.36% 1. Israel 50.88% 1. Israel 54.27% 2. Israel 40.19% 2. United States 30.91% 2. United States 42.79% 2. United States 29.67% 3. England 2.62% 3. Canada 5.84% 3. Canada 1.64% 3. Canada 4.46% 4. Canada 2.45% 4. England 3.35% 4. England 1.58% 4. England 3.42% 4. France 2.45% 5. France 3.30% 5. France 1.40% 5. France 2.45% 5. Lebanon 1.54% 6. Lebanon 3.27% 6. Lebanon 0.30% 6. Lebanon 1.21% 6. Switzerland 0.45% 7. United Arab
Emirates 1.00% 7. Australia 0.24% 7. United Arab Emirates 0.92% 7. Kuwait 0.31% 8. Kuwait 0.49% 7. Netherlands 0.24% 8. Spain 0.80% 8. Netherlands 0.21% 9. Spain 0.35% 8. Switzerland 0.12% 9. Kuwait 0.50% 8. Saudi Arabia 0.21% 10. Saudi Arabia 0.30% 9. — N/A 10. Australia 0.35% Total 8,640 Avg #
2.9 Total 13,837 Avg # 2.8 Total 1,643 Avg # 3.5 Total 3,387 Avg # 3.1 *based on number of score reports received
From TY 2000 to TY 2004, interest in studying in the United States has decreased tremendously among Middle Eastern citizens. While test-takers from this region were once divided between studying in Israel and the United States, they now show significantly more interest in studying in Israel as well as increased interest in studying in other countries such as Canada, England, and France. For Middle Eastern citizens in TY 2004, the United Arab Emirates was ranked seventh for the first time among test-takers as a whole and those in the 25 to 30 age group.
Implications
• Middle Eastern citizens appear to prefer to study close to their native region, most likely as a result of increased immigration and Visa issues between the Middle East and the United States.
• Citizens from the Middle East, along with Canadian citizens, are the least likely to want to study in the United States.
• Test-takers 25 to 30 are more likely to seek studies in Israel, and slightly less likely to seek studies outside their native region when compared to all test-takers from the region.
Australian/Pacific Island Citizens
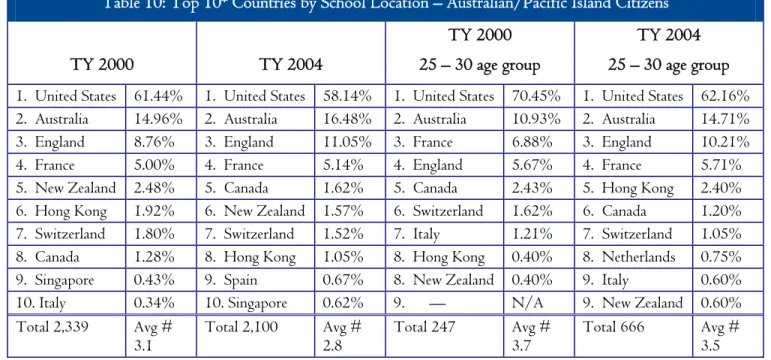
Table 10: Top 10* Countries by School Location – Australian/Pacific Island Citizens
TY 2000 TY 2004
TY 2000 25 – 30 age group
TY 2004 25 – 30 age group
1. United States 61.44% 1. United States 58.14% 1. United States 70.45% 1. United States 62.16% 2. Australia 14.96% 2. Australia 16.48% 2. Australia 10.93% 2. Australia 14.71% 3. England 8.76% 3. England 11.05% 3. France 6.88% 3. England 10.21% 4. France 5.00% 4. France 5.14% 4. England 5.67% 4. France 5.71% 5. New Zealand 2.48% 5. Canada 1.62% 5. Canada 2.43% 5. Hong Kong 2.40% 6. Hong Kong 1.92% 6. New Zealand 1.57% 6. Switzerland 1.62% 6. Canada 1.20% 7. Switzerland 1.80% 7. Switzerland 1.52% 7. Italy 1.21% 7. Switzerland 1.05% 8. Canada 1.28% 8. Hong Kong 1.05% 8. Hong Kong 0.40% 8. Netherlands 0.75% 9. Singapore 0.43% 9. Spain 0.67% 8. New Zealand 0.40% 9. Italy 0.60% 10. Italy 0.34% 10. Singapore 0.62% 9. — N/A 9. New Zealand 0.60% Total 2,339 Avg #
3.1 Total 2,100 Avg # 2.8 Total 247 Avg # 3.7 Total 666 Avg # 3.5 *based on number of score reports received
Overall, Australian/Pacific Island citizens would like to study in the United States, but they have shown increasing interest in studying in other countries as well. This is particularly true for those in the 25 to 30 age group. From TY 2000 to TY 2004, the percentage of test takers who would like to study in Australia, England, and Hong Kong have all increased. Hong Kong has risen substantially in the rankings among this group from eighth to fifth. Conversely, among all test-takers from this region, interest in studying in Hong Kong has declined while interest in studying in Spain and Canada has risen.
Implications
• Distance does not appear to be a factor for Australian/Pacific Island citizens.
• Australian/Pacific Island test-takers in the 25 to 30 age group are more likely to want to study outside the region.
Mexican/Caribbean/Latin American Citizens
Table 11: Top 10* Countries by School Location – Mexican/Caribbean/Latin American Citizens
TY 2000 TY 2004
TY 2000 25 – 30 year group
TY 2004 25 – 30 year group
1. United States 84.09% 1. United States 76.54% 1. United States 86.95% 1. United States 74.17% 2. Canada 4.10% 2. Canada 6.22% 2. England 3.47% 2. England 6.27% 3. England 3.58% 3. England 5.56% 3. Canada 3.19% 3. Canada 5.99% 4. France 2.12% 4. France 3.13% 4. France 1.85% 4. France 3.81% 5. Spain 1.45% 5. Spain 2.39% 5. Spain 1.81% 5. Spain 3.51% 6. Brazil 1.42% 6. Brazil 1.15% 6. Brazil 0.58% 6. Netherlands 0.98% 7. Switzerland 0.69% 7. Netherlands 0.84% 7. Netherlands 0.47% 7. Germany 0.79% 8. Mexico 0.59% 8. Germany 0.64% 8. Mexico 0.43% 8. Brazil 0.76% 9. Netherlands 0.45% 9. Mexico 0.60% 9. Italy 0.41% 9. Italy 0.68% 10. Italy 0.40% 10. Switzerland 0.58% 10. Switzerland 0.32% 10. Mexico 0.57% Total 25,312 Avg #
3.1 Total 22,044 Avg # 3.0 Total 4,645 Avg # 3.8 Total 8,394 Avg # 3.4 *based on number of score reports received
The majority of citizens from the Mexican/Caribbean/ Latin American region appear to prefer to study in the United States. However, this percentage has declined from TY 2000 to TY 2004 for all citizens, as well as for those in the 25 to 30 age group. This is primarily due to test-takers sending more score reports to schools in Canada, England, France, Spain, and Germany.
Implications
• Mexican/Caribbean/Latin American citizens are very unlikely to study at schools located in their native region.
• Test-takers from this region are becoming increasingly interested in studying in Western Europe, especially those in the 25 to 30 age group.
• Given their strong desire to study in the United States, distance does not appear to factor highly into
Conclusion
When reviewing these results, it is important to note that it is not mandatory for test-takers to respond to biological information questions3 to register for the GMAT®. Also,
any test-taker who took the test more than once is represented in the analyses by the number of times they took the test4. The results presented in this report are generalizations, and will not apply to every student. In fact, location preferences vary from individual to individual and circumstances unobservable to researchers also help determine location decisions (Kodrzycki, 2001). UNESCO, who estimated 1.7 million students worldwide were educated abroad in 2000, expects that number will swell to more than 8 million by 2025. Countries that attract these students will inevitably have a huge advantage in the coming war for global talent (Florida, 2004).
Methodology
Country of citizenship, along with score reporting behavior, was used to gauge potential regional trends and changes in test-taker preferences with regards to school location. For every test that is taken, up to 10 instances of score report data is stored. These score reports were then aggregated and grouped by school location for both TY 2000 and TY 2004. Test-taker age on the date of test administration was used for analysis along with geographic region, which was used to group test-takers into ten citizenship categories. (Refer to the Appendix.) “Typical” candidates for graduate business education—individuals in the 25 to 30 age group with three to five years of work experience—account for 53,851 of the 546,663 score
reports submitted in TY 2000 and 165,578 submissions out of a total of 596,767 score reports sent for TY 2004.6
Contact Information
For questions or comments regarding study findings, methodology or data, please contact the GMAC Research and Development department at research@gmac.com.
Acknowledgements
Rachel Edgington, Director, Market Research and
Analysis, GMAC®; Veronica Garcia, Research
Writer/Editor, GMAC®, writing and editorial services. References
Florida, R. 2004. “America’s Looming Creativity Crisis.” Harvard Business Review, vol. 82, no. 10, pp.122-131. Kodrzycki, Yolanda K. 2001. "Migration of Recent College Graduates: Evidence from the National Longitudinal
Survey of Youth." New England Economic Review, January/February, pp. 13-35
Appendix AFRICA Algeria Angola Benin Botswana Burundi Cameroon Cape Verde Chad
Congo, Republic of the Egypt
Eritrea Ethiopia Gabon Gambia, The
Cota D'ivoire (Ivory Coast) Kenya Lesotho Liberia Libya Madagascar Malawi Mali Mauritania Mauritius Morocco Mozambique Namibia Niger Rwanda Senegal Seychelles Sierra Leone Somalia South Africa Sudan Swaziland Tanzania Togo Tunisia Uganda Burkina Faso
ASIA Brunei Myanmar (Burma) Hong Kong Indonesia Japan Cambodia Korea, D.P.R. of (North)
Korea, Rep. of (South) Laos
Macau (SAR of China) Malaysia
Maldives Mongolia
China, People's Republic
Philippines Singapore Sri Lanka Taiwan Thailand Vietnam
AUSTRALIA & PACIFIC ISLANDS
American Samoa Australia Christmas Island Fiji Kiribati Marshall Islands Papua New Guinea New Zealand Palau Tonga Samoa CANADA Canada CENTRAL ASIA Afghanistan Bangladesh Bhutan India Kazakhstan Kyrgyzstan Nepal Pakistan Tajikistan Turkmenistan Uzbekistan EASTERN EUROPE Albania Andorra Armenia Azerbaijan Bosnia-Herzegovina Bulgaria Belarus Croatia Czech Republic Estonia Georgia Hungary Latvia Lithuania
Macedonia, The F.Y.R. of Moldova Poland Romania Russia Slovakia Slovenia Ukraine Yugoslavia
MEXICO, CARIBBEAN, AND LATIN AMERICA
Antigua and Barbuda Argentina Bahamas Barbados Belize Bermuda Bolivia Brazil Cayman Islands Chile Colombia Costa Rica Cuba Dominica, Commonwealth Dominican Republic Ecuador El Salvador Grenada Guatemala Guyana Haiti Honduras Jamaica Mexico Nicaragua Panama Paraguay Peru St. Kitts St. Lucia
St. Vincent and The Grenandines Suriname
Trinidad and Tobago Turks and Caicos Islands Uruguay Venezuela MIDDLE EAST Bahrain Gaza Strip Iran Iraq Israel Jordan Kuwait Lebanon Oman Saudi Arabia Syria
United Arab Emirates West Bank
Yemen
UNITED STATES
United States of America
WESTERN EUROPE Austria Belgium Cyprus Denmark Finland France Germany Greece Iceland Ireland Italy Liechtenstein Luxembourg Malta Monaco Netherlands Norway Portugal Spain Sweden Switzerland Turkey United Kingdom