ANALYZING COST DATA
FOR MANAGEMENT
Copyright 2008 by
DELTA PUBLISHING COMPANY
P.O. Box 5332, Los Alamitos, CA 90721-5332
All rights reserved. No part of this course may be reproduced in any form or by any means, without
Analyzing Cost Data for Management is designedfor business professionals. It covers the managerial use of accounting, financial, and operating data for planning, control, and decision making.
Due to the nature of the subject, the course uses the multidisciplinary approach to the subject, looking at the topic from many different angles such as finance, economics, marketing, information systems, quantitative methods, and the like. Heavily emphasized is the incorporation of information technology (i.e., how to use computer software) into virtually every subject covered in this course.
Furthermore, the course uses the solved problems approach, with emphasis on the practical application of managerial accounting concepts, tools, and methodology. The reader is provided with the following:
1. Definitions and explanations that are understandable.
2. A variety of examples illustrating the concepts and techniques that are concise. 3. Ample problems and detailed suggested solutions.
4
TABLE OF CONTENTS
1. Introduction to Management Accounting
Part I: Processing Cost Data for Cost Accumulation
2. Cost Classifications and Profit Concepts
3. Accumulation of Costs — Job Order Costing
4. Activity-Based Costing and Activity-Based Management
Part II: Analyzing Cost Data for Planning
5. Break-Even and Cost-Volume-Profit Analysis 6. Cost Behavior Analysis and Cost Estimation
7. Budgeting for Profit Planning and Financial Modeling
Part III: Analyzing Cost Data for Control
8. Responsibility Accounting and Cost Control through Standard Costs 9. Performance Evaluation, Transfer Pricing, and Decentralization
Part IV: Analyzing Cost Data for Decision Making
10. Relevant Costs and Short-Term Decisions
11. Long-Term Investment and Capital Budgeting Decisions 12. A Further Look at Capital Budgeting
Financial Tables
Table 1 Future Value of $1 = T1(i,n)
Table 2 Future Value of an Annuity of $1 = T2(i,n) Table 3 Present Value of $1 = T3(i,n)
Table 4 Present Value of an Annuity of $1 = T4(i,n)
5
1 1
INTRODUCTION TO MANAGEMENT ACCOUNTING
Management accounting as defined by the Institute of Management Accountants (IMA) is the process of identification, measurement, accumulation, analysis, preparation, interpretation, and communication of financial information, which is used by management to plan, evaluate, control, and make decisions within an organization. It ensures the appropriate use of and accountability for an organization's resources.
After studying the material in this chapter, you will be able to
State what management accounting is all about.
Distinguish between management accounting and its related fields such as cost accounting and financial accounting.
Describe the three broad purposes for which the manager needs cost information. Identify the role of the controller, the treasurer, and the Chief Financial Officer (CFO). Explain the role of the Cost Accounting Standards Board (CASB).
Identify some new developments that took place in the cost/management accounting discipline over the last two decades.
List three popular certificates that recognize the expertise in the fields of cost/managerial accounting and internal auditing--the Certified Managerial Accountant (CMA), the
Certified in Financial Management (CFM),andthe Certified Internal Auditor (CIA).
FINANCIAL ACCOUNTING VERSUS MANAGEMENT ACCOUNTING Financial accounting is mainly concerned with the historical aspects of external reporting; that is, providing financial information to outside parties such as investors, creditors, and governments. To protect those outside parties from being misled, financial accounting is governed by what are called generally accepted accounting principles (GAAP).
6
Management accounting, on the other hand, is concerned primarily with providing information to internal managers who are charged with planning and controlling the operations of the firm and making a variety of management decisions. Due to its internal use within a company, management accounting is not subject to generally accepted accounting principles (GAAP). As defined by the Financial Accounting Standards Board (FASB), GAAP is the conventions, rules, and procedures necessary to defined accounting practice for external reporting at a particular time.
The differences between financial and management accounting are summarized below:
Financial Accounting Management Accounting
(1) External users of financial information (1) Internal users of financial information
(2) Must comply with GAAP (2) Need not comply with GAAP
(3) Must generate accurate and timely data (3) Emphasizes relevance and flexibility of data
(4) Past orientation (4) Future orientation
(5) Financial information (5) Nonfinancial (e.g., speed of delivery, customer complaints) as well as financial information (6) Looks at the business as a whole (6) Focuses on parts as well as on the whole of a
business
(7) Summary reports (7) Detailed reports by products, departments, or
other segments
(8) Primarily stands by itself (8) Draws heavily from other disciplines such as finance, economics, information systems, marketing, operations/production management, and quantitative methods
THE WORK OF MANAGEMENT
In general, the work that management performs can be classified as (a) planning, (b) coordinating, (c) controlling, and (d) decision making.
Planning: The planning function of management involves selecting long- and short-term objectives and drawing up strategic plans to achieve those objectives.
Coordinating: In performing the coordination function, management must decide how best to put together the firm's resources in order to carry out established plans.
Controlling: Controlling entails implementing a decision method and using feedback so that the firm's goals and specific strategic plans are optimally obtained.
7
Decision making: Decision making is the purposeful selection from a set of alternatives in light of a given objective.
Management-accounting information is important in performing all of these functions.
COST ACCOUNTING VERSUS MANAGEMENT ACCOUNTING
The difference between cost accounting and management accounting is a subtle one. The Institute of Management Accountants (IMA) defines cost accounting as ―a systematic set of procedures for recording and reporting measurements of the cost of manufacturing goods and performing services in the aggregate and in detail. It includes methods for recognizing, classifying, allocating, aggregating and reporting such costs and comparing them with standard costs.‖
Management accounting as defined by the IMA is the process of identification, measurement, accumulation, analysis, preparation, interpretation, and communication of financial information, which is used by management to plan, evaluate, and control within an organization. It ensures the appropriate use of and accountability for an organization's resources. Management accounting also relates to the preparation of financial reports for nonmanagement groups such as regulatory agencies and tax authorities. Simply stated, management accounting is the accounting used for the planning, control, and decision-making activities of an organization.
From this definition of cost accounting and the IMA's definition of management accounting, one thing is clear: the major function of cost accounting is cost accumulation for inventory valuation and income determination. Management accounting, however, emphasizes the use of the financial and cost data for planning, control, and decision-making purposes.
EXAMPLE
Management accounting typically does not deal with the details of how costs are accumulated and how unit costs are computed for inventory valuation and income determination. Although unit cost data are used for pricing and other managerial decisions, the method of computation itself is not a major topic of management accounting but rather for cost accounting.
THE ORGANIZATIONAL ASPECT OF MANAGEMENT FUNCTION
There are two types of authorities in the organizational structure: line and staff. Line authority is the authority to give orders to subordinates. Line managers are responsible for attaining the goals set by the organization as efficiently and profitably as possible. Production and sales managers typically possess line authority.
8
Staff authority is the authority to give advice, support, and service to the line departments. Staff managers do not command others. Examples of staff authority are found in personnel, purchasing, engineering, and finance. The management accounting function is usually a staff function with the responsibility for providing line managers and also other staff people with a specialized service. The service includes (a) budgeting, (b) controlling, (c) pricing, and (d) special decisions.
CONTROLLERSHIP
The chief management accountant or the chief accounting executive of an organization is called the controller (often called comptroller, especially in the government sector). The controller is in charge of the accounting department. The controller's authority is basically staff authority in that the controller's office gives advice and service to other departments. But at the same time, the controller has line authority over members of his or her department such as internal auditors, bookkeepers, budget analysts, etc. (See Figure 1 for an organization chart of a controllership situation).
In a large firm, the financial responsibilities are carried out by the treasurer, controller, and financial vice president, often called a chief financial officer (CFO). The financial vice president is involved with financial policymaking and planning. He or she supervises all phases of financial activity and serves as the financial advisor to the board of directors.
Figure 1 shows an organization chart of the finance structure within a company. Note that the controller and treasurer report to the vice president of finance. The treasurer is responsible for managing corporate assets and liabilities, planning the finances, budgeting capital, financing the business, formulating credit policy, and managing the investment portfolio. The controller is basically concerned with internal matters, namely financial and cost accounting, taxes, budgeting, and control functions. Figure 2 presents the controller's functions.
9
10
FIGURE 2
THE CONTROLLER'S FUNCTIONS
The effective, competent, and timely handling of controllership and treasury functions will ensure corporate financial success. The Financial Executive Institute, an association of corporate controllers and treasurers, distinguishes their functions as shown in Table 1.
It is important to note that there is no universally accepted, precise distinction between the two jobs and the functions may differ slightly between organizations because of size, personality and company policy.
COST ACCOUNTING STANDARDS BOARD
The Cost Accounting Standard Board (CASB), an agency of the US Congress, was established in 1970 to promulgate cost accounting standards covering negotiated defense contracts in excess of $500,000 (executive regulations have extended the standards to cover nondefense procurements in
11 excess of $500,000). "Negotiated" means that the price is tied to costs rather than to competitive bidding.
TABLE 1
FUNCTIONS OF CONTROLLER AND TREASURER
Controller Treasurer
Accounting Obtaining financing
Reporting of financial information Banking relationship
Custody of records Investment of funds
Interpretation of financial data Investor relations
Budgeting Cash management
Controlling operations Insuring assets
Appraisal of results and making recommendations
Fostering relationship with creditors and investors
Preparation of taxes Credit appraisal and collecting
Managing assets funds
Internal auditing Deciding on the financing mix
Protection of assets Dividend disbursement
Reporting to the government Pension management
Payroll
The standards are mainly concerned with definitions, uniformity, and consistency in cost accounting practices. The standards begin with Number 400. Until the CASB's activities ceased in 1980, the Board had issued 19 standards. The Government Accounting Office (GAO) is now responsible for interpreting CASB standards. A list of CASB standards is presented below.
The standards are classified into the following three categories:
1. Standards addressing overall cost accounting matters
400 Definitions
401 Cost accounting standard--consistency in estimating, accumulating, and reporting costs 402 Cost accounting standard--consistency in allocating costs incurred for the same purpose 405 Accounting for unallowable costs
406 Cost accounting standard--cost accounting period
12 404 Capitalization of tangible assets
407 Use of standard costs for direct material and direct labor 408 Accounting for costs of compensated personal absence 409 Depreciation of tangible capital assets
411 Accounting for acquisition costs of material 412 Composition and measurement of pension cost 413 Adjustment and allocation of pension cost
414 Cost of money as an element of the cost of facilities capital 415 Accounting for the cost of deferred compensation 416 Accounting for insurance costs
417 Cost of money as an element of the cost of capital assets under construction
3. Standards addressing allocation of costs
403 Allocation of home office expenses to segments
410 Allocation of business unit general and administrative expenses to final objectives 418 Allocation of direct and indirect costs
(Proposed Standard 419 was combined with this standard)
420 Accounting for independent research and development and bid and proposal costs
Copies of CASB standards, rules, and regulations are available from the:
Superintendent of Documents U.S. Government Printing Office
Washington, D.C., 20402
MANAGERIAL ACCOUNTING IN THE NEW PRODUCTION ENVIRONMENT
Over the past two decades, new technologies and management philosophies have changed the face of managerial accounting. Following are the key developments that have reshaped the discipline. We will discuss these at length in future chapters. For example, where automation and computer-assisted manufacturing methods have replaced the workforce, labor costs have shrunk from between 30 and 50 percent of product and service costs to around 5 percent. Cost accounting in traditional settings required more work to keep track of labor costs than do present systems. On the other hand, in highly automated environments, cost accountants have had to become more sophisticated in finding causes of costs because labor no longer drives many cost transactions.
13 In order to be globally competitive in today's world-class manufacturing environment, firms place an increased emphasis on quality and productivity. Total quality management (TQM) is an effort in this direction. Simply put, it is a system for creating competitive advantage by focusing the organization on what is important to the customer.
Total quality management can be broken down into: Total: that is the whole organization is involved and understands that customer satisfaction is everyone's job. Quality: the extent to which products and services satisfy the requirements of internal and external customers.
Management: the leadership, infrastructure and resources that support employees as they meet the needs of those customers. Market shares of many U.S. firms have eroded because foreign firms have been able to sell higher-quality products at lower prices. Under TQM, performance measures are likely to include product reliability and service delivery, as well as such traditional measures as profitability.
In order to be competitive, U.S. firms have placed an increased emphasis on quality and productivity in order to:
1. Produce savings such as reducing rework costs, and 2. Improve product quality.
Quality costs are classified into three broad categories: prevention, appraisal, and failure costs. Quality cost reports can be used to point out the strengths and weaknesses of a quality system. Improvement teams can use them to describe the monetary benefits and ramifications of proposed changes.
Continuous Improvement (CI) and Benchmarking
Continuous improvement (CI), based on a Japanese concept called Kaizen, is a management philosophy that seeks endless pursuit of improvement of machinery, materials, labor utilization, and production methods through application of suggestions and ideas of team members. The CI utilizes many different approaches, including: statistical process control (SPC)
using traditional statistical control charts and benchmarking examining excellent performers outside the industry and seeing how you can use their best practices. Benchmarking typically involves the following steps:
1. Identify those practices needing improvement.
2. Identify a company that is the world leader in performing the process. 3. Interview the managers of the company and analyze data obtained.
Continuous improvement and benchmarking is often called "the race with no finish" because managers and employees are not satisfied with a particular performance level but seek ongoing improvement.
14
Business Process Reengineering (BPR)
TQM seeks evolutionary changes in the processes while the practice called business process reengineering (BPR) seeks to make revolutionary changes. BPR does this by taking a fresh look at what the firm is trying to do in all its processes, and then eliminating nonvalue-added steps and streamlining the remaining ones to achieve the desired outcome.
Corporate Balanced Scorecard
A problem with just assessing performance with financial measures like profit, ROI and Economic Value Added (EVA) is that the financial measures are "backward looking." In other words, today's financial measures tell you about the accomplishments and failures of the past. An approach to performance measurement that also focuses on what managers are doing today to create future shareholder value is the Balanced Scorecard.
Theory of Constraints (TOC) and Bottlenecks Management
The theory of constraints (TOC) views a business as a linked sequence of processes that transforms inputs into salable outputs, like a chain. To improve the strength of the chain, a TOC company identifies the weakest link, which is the constraint. TOC exploits constraints so that throughput is maximized and inventories and operating costs are minimized. It then develops a specific approach to manage constraints to support the objective of continuous improvement.
Bottlenecks occur whenever demand (at least temporarily) exceeds capacity. For example, although a legal secretary has enough total time to do all her wordprocessing, she may be given several jobs in quick succession, so that a queue (waiting line) builds up. This is a bottleneck, which delays the other activities waiting for the wordprocessing to be finished. TOC seeks to maximize ―throughput‖ by
1. Larger lot sizes at bottleneck work stations, to avoid time lost on changeovers;
2. Small transfer batches—forwarding a small batch of work to the next work station, so that the next operation can begin before the entire lot is finished at the preceding work station; and
3. Rules for inserting buffer stock before or after certain bottlenecks.
THE CERTIFIED MANAGEMENT ACCOUNTANT (CMA)
Management accounting has expanded in scope to cover a wide variety of business disciplines such as finance, economics, organization behavior, and quantitative methods. In line
15 with this development, the Institute of Management Accountants (IMA) created the Institute of Certified Management Accountants, which offers a program leading to the Certified Management Accountant (CMA) examination.
The objectives of the CMA program are fourfold: (1) to establish management accounting as a recognized profession by identifying the role of the management accountant and financial manager, the underlying body of knowledge, and a course of study by which such knowledge is acquired; (2) to encourage higher educational standards in the management accounting field; (3) to establish an objective measure of an individual's knowledge and competence in the field of management accounting; and (4) to encourage continued professional development by management accountants.
The CMA program requires candidates to pass a series of uniform examinations covering a wide range of subjects. The examination consists of the following four parts:
1. Economics, Finance, and Management 2. Financial Accounting and Reporting
3. Management Reporting, Analysis, and Behavioral Issues 4. Decision Analysis and Information Systems
The exam is given twice yearly in June and December.
Note:
1.
For more information, call IMA at (800) 638-4427, ext. 265 or (201) 573-6300 or visit its Web site:http://www.imanet.org.
2.
The IMA has also created the new CFM (Certified in Financial Management) designation to provide an objective measure of knowledge and competence in the field of financial management. Only Part II (Financial Accounting and Reporting) is replaced withCorporate Financial Management. The CFM is co-sponsored by the prestigious Financial Management AssociationInternational, whose Web site is
http://www.fma.org
.
3. Review programs on the CMA/CFM exams are offered by Lambers
(www.lamberscpa.com, 1-800-272-0707) and MicroMash (www.micromash.com, 1-800-272-pass, ext. 2229).
4. The IMA publishes two important journals: Management Accounting (quarterly) and
Strategic Finance (monthly).
16 This certification was created in 1974 by the Institute of Internal Auditors (IIA). The CIA exam is also broader than the CPA exam because it covers a broad range of areas, among them management, economics, finance, and quantitative methods. The CIA exam lasts 14 hours (four 3 1/2-hour parts) and covers the following areas:
1. Theory and Practice of Internal Auditing I 2. Theory and Practice of Internal Auditing II
3. Management, Quantitative Methods, and Information Systems 4. Accounting, Finance, and Economics
Note: For more information, call IIA at (407) 830-7600 or visit its Web site:
http://www.theiia.org
.
CHAPTER SUMMARY
Managerial accounting is the accumulation and analysis of cost data to provide information for external reporting, for internal planning and control of an organization's operations, and for short-term and long-term decisions. This chapter outlined the what and why of management accounting and the relationship between management accounting and its closely related fields--cost accounting and financial accounting.
The chapter also covered the discussion on the role of the controller. Management accounting is expanding rapidly in scope. Also covered was a brief outline of three certification programs that recognize the expertise in the fields of management accounting.
17
2 2
COST CLASSIFICATIONS AND PROFIT CONCEPTS
In financial accounting, the term cost is defined as a measurement, in monetary terms, of the amount of resources used for some purpose. In managerial accounting, the term cost is used in many different ways. That is, there are different types of costs used for different purposes. Some costs are useful and required for inventory valuation and income determination. Some costs are useful for planning, budgeting, and cost control. Still others are useful for making short-term and long-term decisions. A profit concept, contribution margin, which is extremely useful to managers, is also introduced.
After studying the material in this chapter, you will be able to
Identify and cite examples of each of the basic cost elements involved in the manufacture of the product.
Define various cost concepts.
Distinguish between variable costs and fixed costs and explain the difference in their behavior.
Explain the difference between the financial statements of a manufacturer and those of a merchandising firm.
Differentiate between the traditional income statement and the contribution income statement and their uses.
Define profit concepts such as contribution margin.
COST CLASSIFICATIONS
Costs can be classified into various categories, according to:
1. Their management function a. Manufacturing costs
Direct materials
Direct labor
Factory overhead
18 Selling costs
General and administrative costs Research and development costs 2. Their timing of charges against sales revenue
a. Product costs b. Period costs
3. Their ease of traceability a. Direct costs b. Indirect costs
4. Their behavior in accordance with changes in activity a. Variable costs
b. Fixed costs
c. Mixed (semivariable) costs
5. Their degree of averaging a. Total costs
b. Unit (average) costs
6. Their relevance to planning, control and decision making a. Sunk costs
b. Incremental costs c. Relevant costs d. Out-of-pocket costs e. Opportunity costs
f. Controllable and noncontrollable costs g. Standard costs
We will discuss each of the cost categories in the remainder of this chapter.
COSTS BY MANAGEMENT FUNCTION
In a manufacturing firm, costs are divided into two major categories by the functional activities they are associated with: (1) manufacturing costs and (2) nonmanufacturing costs, also called operating expenses.
MANUFACTURING COSTS. Manufacturing costs are those costs associated with the manufacturing activities of the company. Manufacturing costs are subdivided into three categories: direct materials, direct labor, and factory overhead. Direct materials (also called raw materials)
19 are all materials that become an integral part of the finished product. Examples are the steel used to make an automobile and the wood to make furniture. Glues, nails, and other minor items are called indirect materials (or supplies) and are classified as part of factory overhead, which is explained below.
Direct labor is the labor directly involved in making the product. Examples of direct labor costs are the wages of assembly workers on an assembly line and the wages of machine tool operators in a machine shop. Indirect labor, such as wages of supervisory personnel and janitors, is classified as part of factory overhead. Factory overhead can be defined as including all costs of manufacturing except direct materials and direct labor. Some of the many examples include depreciation, rent, property taxes, insurance, fringe benefits, payroll taxes, setup costs, material handling costs, waste control costs, inspection and quality costs, engineering, workmen's compensation, and cost of idle time. Factory overhead is also called manufacturing overhead, indirect manufacturing expenses, factory expense, and factory burden.
Many costs overlap within their categories. For example, direct materials and direct labor when combined are called prime costs. Direct labor and factory overhead when combined are termed conversion costs (or processing costs).
One important category of factory overhead is that of quality costs. Quality costs are costs that occur because poor quality may exist or actually does exist. These costs are significant in amount, often totaling 20 to 25 percent of sales. The subcategories of quality costs are prevention, appraisal, and failure costs. Prevention costs are those incurred to prevent defects. Amounts spent on quality training programs, researching customer needs, quality circles, and improved production equipment are considered in prevention costs. Expenditures made for prevention will minimize the costs that will be incurred for appraisal and failure. Appraisal costs are costs incurred for monitoring or inspection; these costs compensate for mistakes not eliminated through prevention.
Failure costs may be internal (such as scrap and rework costs and reinspection) or external (such as product returns or recalls due to quality problems, warranty costs, and lost sales due to poor product performance).
NONMANUFACTURING COSTS. Nonmanufacturing costs (also called operating expenses) are subdivided into selling expenses, general and administrative expenses, and research and development costs. Selling expenses (also called marketing costs) are those associated with obtaining sales and the delivery of the product. Examples are advertising and sales commissions.
General and administrative expenses (G & A) include those incurred to perform general and administrative activities. Examples are executives' salaries and legal expenses. Research and development costs include all costs of developing new products and services. Such costs are becoming increasingly critical as more high-technology companies enter the economy and as global competition intensifies. Many other examples of costs by management function and their relationships are found in Figure 1.
20
PRODUCT COSTS AND PERIOD COSTS
By their timing of charges against revenue or by whether they are inventoriable, costs are classified into: (a) product costs and (b) period costs.
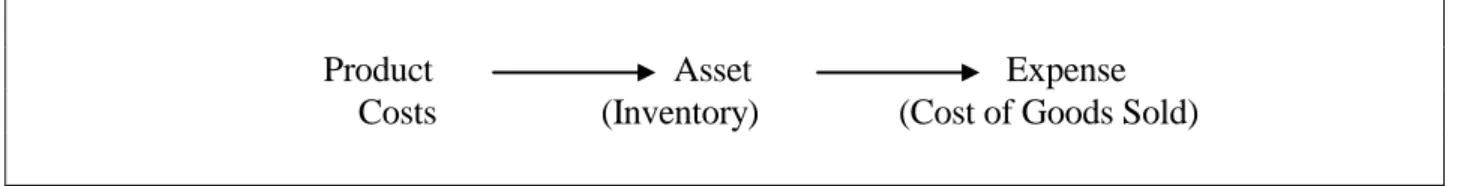
Product costs are inventoriable costs, identified as part of inventory on hand. They are treated as an asset until the goods they are assigned to are sold. At that time they become the expense, i.e., cost of goods sold. All manufacturing costs are product costs.
Product Asset Expense
Costs (Inventory) (Cost of Goods Sold)
GAAP and income tax regulations require that firms treat all manufacturing costs as product costs for external financial reporting using full absorption costing (also called absorption costing). Using full absorption costing, the firm assigns a unit's variable manufacturing cost plus a share of fixed manufacturing costs to each unit produced. Thus the total of units manufactured "fully absorbs" manufacturing costs. (The variable-fixed classification of costs is explained later).
Period costs are all expired costs that are not necessary for production and hence are charged against sales revenues in the period in which the revenue is earned. Firms treat all nonmanufacturing costs--selling, general and administrative expenses, and research and development costs--as period costs.
Period costs Expense
Figure 2 shows the relationship of product and period costs and other cost classifications presented thus far.
21 Costs may be viewed as either direct or indirect in terms of the extent that they are traceable
to a particular cost object. A cost object is any item for which the manager wishes to measure cost. Jobs, product lines, departments, divisions, sales territories, or units produced are typical cost objects. Direct costs can be directly traceable to the costing object. For example, if the object of costing under consideration is a product line, then the materials and labor involved in the manufacture of the line would both be direct costs.
Factory overhead items are all indirect costs since they are not directly identifiable to any particular product line. Costs shared by different departments, products, or jobs, called common costs or joint costs, are also indirect costs. National advertising that benefits more than one product and sales territory is an example of an indirect cost. Accountants may allocate them on some
arbitrary basis to specific products or departments.
YOU SHOULD REMEMBER
The following examples illustrate a cost object and its related direct costs for nonmanufacturing firms.
In a retail firm, such as a department store, costs can be traced to a department. For example, the direct costs of the shoe department include the costs of shoes and the wages of employees working in that department. Indirect costs include the costs of utilities, insurance, property taxes, storage, and handling.
In a service organization, such as an accounting firm, costs can be traced to a specific service, such as tax return preparation. Direct costs for tax return preparation services include the costs of tax return forms, computer usage, and labor to prepare the return. Indirect costs include the costs of office rental, utilities, secretarial labor, telephone expenses and depreciation of office furniture.
22
FIGURE 1
23
FIGURE 2
VARIOUS CLASSIFICATIONS OF COSTS
Variable Costs, Fixed Costs, and Mixed Costs
From a planning and control standpoint, perhaps the most important way to classify costs is by how they behave in accordance with changes in volume or some measure of activity. By behavior, costs can be classified into the following three basic categories:
Variable costs are costs that vary in total in direct proportion to changes in activity. Examples are direct materials and gasoline expense based on mileage driven.
Fixed costs are costs that remain constant in total regardless of changes in activity. Examples are rent, insurance, and taxes.
Mixed (or semi-variable) costs are costs that vary with changes in volume but, unlike variable costs, do not vary in direct proportion. In other words, these costs contain both a variable component and a fixed component. Examples are the rental of a delivery truck, where a fixed rental
24 fee plus a variable charge based on mileage is made; and power costs, where the expense consists of a fixed amount plus a variable charge based on consumption.
Costs by behavior will be examined further in a later chapter. The breakdown of costs into their variable components and their fixed components is important in many areas of management accounting, such as flexible budgeting, break-even analysis, and short-term decision making.
UNIT COSTS AND TOTAL COSTS
For external reporting and pricing purposes, accountants are frequently interested in determining the unit (average) cost per unit of product or service. The unit cost is simply the average cost, which is the total costs divided by the total volume in units. Alternatively, the unit cost is the sum of (a) the variable cost per unit, and (b) the fixed cost per unit. It is important to realize that the unit cost declines as volume increases since the total fixed costs that are constant over a range of activity are being spread over a larger number of units.
EXAMPLE 1
Fixed costs are $1,000 per period and variable costs are $.10 per unit. The total and unit (average) costs at various production levels are as follows:
Volume Total Total Total Variable Fixed Unit
in Fixed Variable Costs Cost Cost Average
units Costs Costs per unit per unit Cost
(b)+(c) (c)/(a) (b)/(a) (d)/(a)
or
(a) (b) (c) = (d) = (e) = (f) (e)+(f)
1,000 $1,000 $ 100 $1,100 $.10 $1.00 $1.10
5,000 1,000 500 1,500 .10 .20 .30
10,000 1,000 1,000 2,000 .10 .10 .20
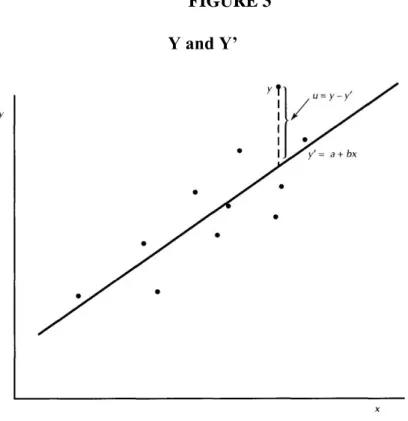
The increase in total costs and the decline in unit costs are illustrated in Figure 3. Also note the relationships for variable and fixed costs per unit:
Behavior as Volume Changes from 5,000 to 10,000
25
Variable Cost Change ($500 to $1,000) No change ($.10)
Fixed Cost No change ($1,000) Change ($.20 to $.10)
FIGURE 3
COSTS FOR PLANNING, CONTROL, AND DECISION MAKING
SUNK COSTS. Sunk costs are the costs of resources that have already been incurred whose total will not be affected by any decision made now or in the future. Sunk costs are considered irrelevant to future decisions since they are past or historical costs. For example, the acquisition cost of machinery is irrelevant to a decision of whether to scrap the machinery.
EXAMPLE 2
Suppose you acquired an asset for $50,000 three years ago which is now listed at a book value of $20,000. The $20,000 book value is a sunk cost which does not affect a future decision.
INCREMENTAL (OR DIFFERENTIAL) COSTS. The incremental cost is the difference in costs between two or more alternatives. Incremental costs are increases or decreases in total costs; or changes in specific elements of cost (e.g., direct labor cost), that result from any variation in operations. Incremental costs will be incurred (or saved) if a decision is made to go ahead (or to stop) some activity, but not otherwise.
EXAMPLE 3
Consider the two alternatives A and B whose costs are as follows:
A B
Difference (B - A)
26
Direct materials $10,000 $10,000 $ 0
Direct labor 10,000 15,000 5,000
The incremental costs are simply B-A (or A - B) as shown in the last column. The incremental costs are relevant to future decisions, which will be taken up in detail in Chapter 11.
RELEVANT COSTS. Relevant costs are expected future costs that will differ between alternatives. This concept is a key to short- and long-term decisions and discussed in detail in Chapter 11.
EXAMPLE 4
The incremental cost is said to be relevant to the future decision. The sunk cost is considered irrelevant.
OUT-OF-POCKET COSTS. Out-of-pocket costs, also known as outlay costs or cash costs, are costs that require future expenditures of cash or other resources. Non-cash charges such as depreciation and amortization are not out-of-pocket costs. These are book costs. Out-of-pocket costs are usually relevant to a particular decision.
EXAMPLE 5
A capital investment project requires $120,000 in cash outlays. $120,000 is an out-of-pocket cost.
OPPORTUNITY COSTS. An opportunity cost is the net benefit foregone by using a resource for one purpose instead of for another. There is always an opportunity cost involved in making a choice decision. It is a cost incurred relative to the best alternative given up.
EXAMPLE 6
Suppose a company has a choice of using its capacity to produce an extra 10,000 units or renting it out for $20,000. The opportunity cost of using the capacity is $20,000.
CONTROLLABLE AND NONCONTROLLABLE COSTS. A cost is said to be controllable when the amount of the cost is assigned to the head of a department and the level of the cost is significantly under the manager's influence. For example, marketing executives control advertising costs. Noncontrollable costs are those costs not subject to influence at a given level of managerial supervision.
27 All variable costs such as direct materials, direct labor, and variable overhead are usually considered controllable by the department head. On the other hand, fixed costs such as depreciation of factory equipment would not be controllable by the department head, since he/she would have no power to authorize the purchase of the equipment.
STANDARD COSTS. Standard costs are the costs established in advance to serve as goals, norms or yardsticks to be achieved and, after the fact, to determine how well those goals were met. They are based on the quantities and prices of the various inputs (e.g., direct materials, direct labor, and factory overhead) needed to produce output efficiently. Standard costs can also be set for service businesses.
EXAMPLE 8
The standard cost of materials per pound is obtained by multiplying standard price per pound by standard quantity per unit of output in pounds. For example, the standard price and quantity of material might be determined as follows:
Purchase price $3.00
Freight 0.12
Receiving and handling 0.02
Less: Purchase discounts (0.04)
Standard price per pound $3.10
Per bill of materials in pounds 1.2
Allowance for waste and spoilage in lbs. 0.1
Allowance for rejects in lbs. 0.1
Standard quantity per unit of output 1.4 lbs.
Once the price and quantity standards have been set, the standard cost of material per unit of finished goods can be computed, as follows:
1.4 pounds x $3.10 = $4.34 per unit.
MERCHANDISING VERSUS MANUFACTURING ORGANIZATIONS
Merchandising firms and manufacturing companies prepare income statements and balance sheets for owners, creditors, and other outside parties. Both types of companies maintain levels of inventory and calculate gross margin using sales and cost of goods sold information. However, merchandising firms are less complex than manufacturing firms.
28 Purchase products that are ready for resale
Maintain only one inventory account on the balance sheet
Include the cost of purchases in the calculation of cost of goods sold
Manufacturing organizations
Design and manufacture products for sale
Reflect three inventory accounts on the balance sheet
Determine the cost of goods manufactured to include in the calculation of cost of goods sold
Merchandising organizations, such as Wal-Mart, Rite Aid, and Office Depot, purchase products that are ready for resale. These organizations maintain one inventory account, called Merchandise Inventory, which reflects the costs of products held for resale. To calculate the cost of goods sold for a merchandising organization, the equation used is:
Beginning Net Cost Ending Cost of Goods Sold = Merchandise + of Purchases – Merchandise
Inventory Inventory
For example, Allison Candy Store had a balance of $3,000 in the Merchandise Inventory account on January 1, 20x0. During the year, the store purchased candy products totaling $23,000 (adjusted for purchase discounts, purchases returns and allowances, and freight-in). At December 31, 20x0, the Merchandise Inventory balance was $4,500. The cost of goods sold is thus $21,500.
Cost of Goods Sold = $3,000 + $23,000 - $4,500 = $21,500
Manufacturing firms, such as Nokia, GM, and IBM, use materials, labor, and manufacturing overhead to manufacture products for sale. Materials are purchased and used in the production process. The Materials Inventory account shows the balance of the cost of unused materials. During the production process, the costs of manufacturing the product are accumulated in the Work in Process Inventory account. The balance of the Work in Process Inventory account represents the costs of unfinished product.
Once the product is complete and ready for sale, the cost of the goods manufactured is reflected in the Finished Goods Inventory account. The balance in the Finished Goods Inventory account is the cost of unsold completed product. When the product is sold, the manufacturing organization calculates the cost of goods sold using the following equation:
29
Beginning Cost of Ending
Cost of Goods Sold = Finished Goods+ Goods - Finished Goods
Inventory Manufactured Inventory
INCOME STATEMENTS AND BALANCE SHEETS--MANUFACTURER
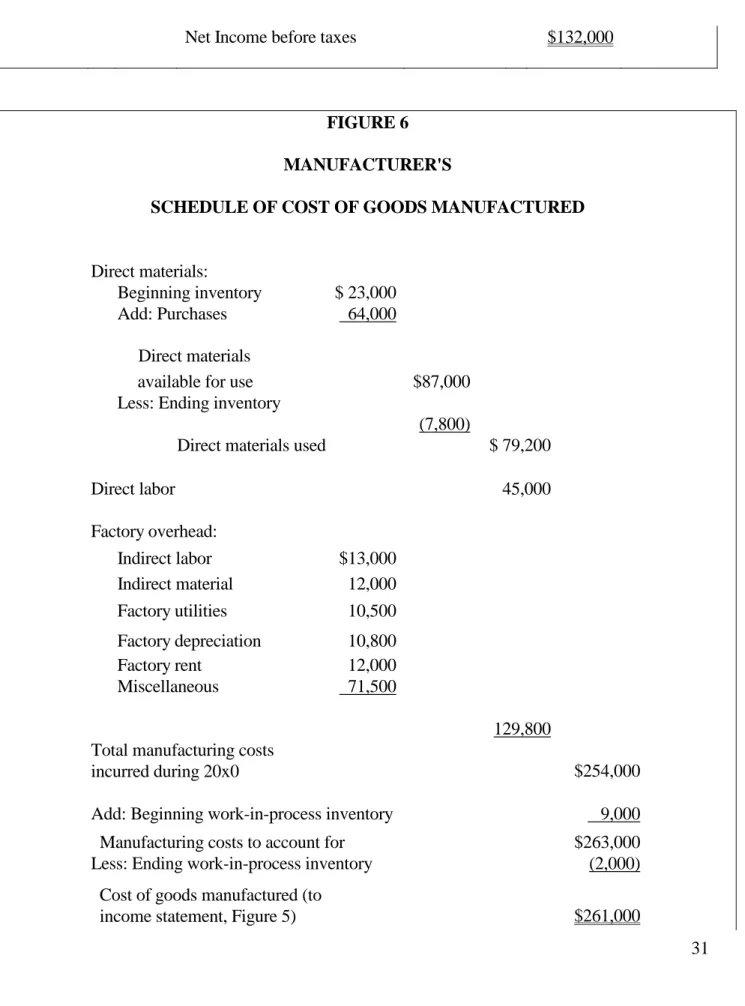
Figure 4 illustrates the income statement of a manufacturer. An important characteristic of the income statement is that it is supported by a schedule of cost of goods manufactured (see Figure 6).
This schedule shows the specific costs (i.e., direct materials, direct labor, and factory overhead) that have gone into the goods completed during the period. The two most important figures on the cost of goods manufactured statement are (1) the total manufacturing costs and (2) the cost of goods manufactured. Be sure not to confuse the terms total manufacturing costs and
cost of goods manufactured. Total manufacturing cost includes the costs of all resources put into production during the period.
Cost of goods manufactured consists of the total costs of all goods completed during the period and includes ―total manufacturing cost‖ plus the beginning work in process inventory minus
the ending work in process inventory. This adjustment process is necessary because total manufacturing cost could include the goods unfinished (work in process), which need to be taken out.
Since the manufacturer carries three types of inventory (direct materials, work-in-process, and finished goods) all three items must be incorporated into the computation of the cost of goods sold. These inventory accounts also appear on the balance sheet for a manufacturer, as shown in Figure 4.
30
FIGURE 4
MANUFACTURER'S CURRENT ASSET SECTION OF BALANCE SHEET
December 31, 20X0 Current Assets: Cash $ 25,000 Accounts Receivable 78,000 Inventories: Raw Materials $ 7,800 Work-in-Process 2,000 Finished Goods 21,000 30,800 Total $133,800 FIGURE 5
MANUFACTURER'S INCOME STATEMENT
For the Year Ended December 31, 20X0
Sales $460,000
Cost of goods sold:
Beginning finished goods inventory $ 18,000
Add: Cost of goods manufactured
(see Schedule, Figure 6) 261,000
Cost of goods available for sale $279,000
Less: Ending finished goods inventory (21,000) $258,000
Gross margin $202,000
Less: Operating expenses
31
Net Income before taxes $132,000
FIGURE 6 MANUFACTURER'S
SCHEDULE OF COST OF GOODS MANUFACTURED
Direct materials:
Beginning inventory $ 23,000
Add: Purchases 64,000
Direct materials
available for use $87,000
Less: Ending inventory
(7,800)
Direct materials used $ 79,200
Direct labor 45,000 Factory overhead: Indirect labor $13,000 Indirect material 12,000 Factory utilities 10,500 Factory depreciation 10,800 Factory rent 12,000 Miscellaneous 71,500 129,800 Total manufacturing costs
incurred during 20x0
$254,000
Add: Beginning work-in-process inventory 9,000
Manufacturing costs to account for $263,000
Less: Ending work-in-process inventory (2,000)
Cost of goods manufactured (to
32
THE CONTRIBUTION INCOME STATEMENT
The traditional (absorption) income statement for external reporting shows the functional classification of costs, that is, manufacturing costs vs. non-manufacturing expenses (or operating expenses). An alternative format of income statement, known as the contribution income statement, organizes the costs by behavior rather than by function. It shows the relationship of variable costs and fixed costs a given cost item is associated with, regardless of the functions.
The contribution approach to income determination provides data that are useful for managerial planning and decision making. For example, the contribution approach is useful:
(1) For break-even and cost-volume-profit analysis,
(2) In evaluating the performance of the division and its manager, and (3) For short-term and non-routine decisions.
The contribution income statement, also known as variable or direct costing, is not acceptable, however, for income tax or external reporting purposes because it ignores fixed overhead as a product cost. The statement highlights the concept of contribution margin, which is the difference between sales and variable costs. The traditional format, on the other hand, emphasizes the concept of gross margin, which is the difference between sales and cost of goods sold.
These two concepts are independent and have nothing to do with each other. Gross margin is available to cover non-manufacturing expenses, whereas contribution margin is available to cover fixed costs. The concept of contribution margin has numerous applications for internal management, which will be taken up in Chapter 10.
A comparison is made between the traditional format and the contribution format below.
TRADITIONAL FORMAT
Sales $15,000
Less: Cost of Goods Sold 7,000
Gross Margin 8,000
Less: Operating Expenses
33 Administrative 1,500 3,600 Net Income $4,400 CONTRIBUTION FORMAT Sales $15,000
Less: Variable Expenses
Manufacturing $4,000
Selling 1,600
Administrative 500 6,100
Contribution Margin 8,900
Less: Fixed Expenses
Manufacturing $3,000
Selling 500
Administrative 1,000 4,500
Net Income $4,400
CHAPTER SUMMARY
Cost accounting is the accumulation and analysis of cost data to provide information for external reporting, for internal planning and control of an organization's operations, and for short-term and long-term decisions. It is important to realize that there are different costs used for different purposes. The cost/management must determine how to use cost data in order to supply the most appropriate cost information.
Cost/managerial accountants prepare the income statement in a contribution format which organizes costs by behavior rather than by the functions of manufacturing, sales, and administration. The contribution income statement is widely used as an internal planning and decision-making tool.
34
3 3
ACCUMULATION OF COSTS - JOB ORDER COSTING
A cost accumulation system is a product costing system. This process accumulates manufacturing costs such as materials, labor and factory overhead and assigns them to cost objectives, such as finished goods and work-in-process. Product costing is necessary not only for inventory valuation and income determination but also for establishing the unit sales price.
We will discuss the essentials of the cost accumulation system that is used to measure the manufacturing costs of products. This is essentially a two-step process: (1) the measurement of costs that are applicable to manufacturing operations during a given accounting period and (2) the assignment of these costs to products.
There are two basic approaches to cost accounting and accumulation:
(1) Job order costing (2) Process costing
After studying the material in this chapter, you will be able to
Explain job order costing.
List the componets of a job cost sheet.
Prepare journal entries for a job order cost system. Deevelop a predetermined overhead rate.
Dispose of overapplied or underapplied overhead.
JOB ORDER COSTING AND PROCESS COSTING COMPARED
The distinction between job order costing and process costing centers largely around how product costing is accomplished. With job order costing, the focus is to apply costs to specific jobs, which may consist of either a single physical unit or a few like units.
Under process costing, accounting data are accumulated by the production department (or cost center) and averaged over all of the production that occurred in the department. Here there is
35 mass production of like units which are manufactured on a continuous basis through a series of uniform production steps known as processes. Figure 1 summarizes the basic differences between these two methods.
FIGURE 1
DIFFERENCES BETWEEN JOB ORDER COSTING AND PROCESS COSTING
Job Order Costing Process Costing
1. Cost unit Job, order, or contract Physical unit
2. Costs are accumulated By jobs By departments
3. Subsidiary record Job cost sheet Cost of production report
4. Used by Custom manufacturers Processing industries
5. Permits computation of (a) A unit cost for A unit cost to be used
inventory costing purposes to compute the costs of goods (b) A profit or loss on each job completed and work in process
JOB ORDER COSTING
Job order costing is the cost accumulation system under which costs are accumulated by jobs, contracts, or orders. This costing method is appropriate when the products are manufactured in identifiable lots or batches or when the products are manufactured to customer specifications. Job order costing is widely used by custom manufacturers such as printing, aircraft, and construction companies. It may also be used by service businesses such as auto repair shops and professional services. Job order costing keeps track of costs as follows: direct material and direct labor are traced to a particular job. Costs not directly traceable--factory overhead--are applied to individual jobs using a predetermined overhead (application) rate.
JOB COST RECORDS
A job cost sheet is used to record various production costs for work-in-process inventory. A separate cost sheet is kept for each identifiable job, accumulating the direct materials, direct labor, and factory overhead assigned to that job as it moves through production. The form varies
36 according to the needs of the company. Figure 2 presents the basic records or source documents used for job costing.
These include:
1. The job cost sheet. This is the key document in the system. It summarizes all of the manufacturing costs --direct materials, direct labor, and applied factory overhead (to be discussed in detail later)--of producing a given job or batch of products. One sheet is maintained for each job, and the file of job cost sheets for unfinished jobs is the subsidiary record for the Work in Process Inventory account. When the jobs are completed and transferred, the job order sheets are transferred to a completed jobs file and the number of units and their unit costs are recorded on inventory cards supporting the Finished Goods Inventory account.
2. The materials requisition form. This form shows the types, quantities and prices of each type of material issued for production.
3. The work ticket. It shows who worked on what job for how many hours and at what wage rate. This is also called the time ticket and illustrated in Figure 2.
4. The factory overhead cost sheet. It summarizes the various factory overhead costs incurred.
5. The memo for applied factory overhead. This is a memorandum that shows how the factory overhead applied rate has been developed.
6. The finished goods record. This is a record maintained for each type of product manufactured and sold. Each record contains a running record of units and costs of products received, sold, and on hand.
The general flow of costs through a job cost system is shown in Figure 3.
JOB ORDER COSTING - ILLUSTRATION
To illustrate a job order cost system, especially the tie-in between the general ledger accounts and the subsidiary records, examine the information presented below.
This illustration covers the month of June, for which the beginning inventories were:
Materials inventory (Material A, $10,000; Material B, $6,000;
37 Work-in-process inventory (Job No. 310; direct materials, $4,200;
direct labor, $5,000; and overhead, $4,000) 13,200
Finished goods inventory (500 units of Product X at a cost of $11
per unit) 5,500
Assume that Job No. 310 was completed in June, and that, of the two jobs started in June (Nos. 320 and 510), only Job No. 510 is incomplete at the end of June. The transactions, and the journal entries to record them, are given below:
1. Purchased $10,000 of Material A and $15,000 of Material B on account.
Materials Inventory 25,000
Accounts Payable 25,000
To record purchase of direct materials.
2. Issued direct materials: Material A to Job No. 310, $1,000; to Job No. 320, $8,000; and to Job No. 510, $2,000; Material B to Job No. 310, $2,000; to Job No. 320, $6,000; and to Job No. 510, $4,000. Indirect materials issued to all jobs, $1,000.
Work-in-Process Inventory 23,000
Factory Overhead 1,000
Material Inventory 24,000
To record direct and indirect materials issued.
3. Factory payroll for the month, $25,000; social security and income taxes withheld, $4,000.
Payroll Summary 25,000
Various liability accounts for taxes withheld 4,000
Accrued Wages Payable 21,000
38
40 4. Factory payroll paid, $19,000.
Accrued Wages Payable 19,000
Cash 19,000
To record cash paid to factory employees in June.
5. Payroll costs distributed: direct labor, $20,000 (Job No. 310, $5,000; Job No. 320, $12,000; and Job No. 510, $3,000); and indirect labor, $5,000.
Work-in-Process Inventory 20,000
Factory Overhead 5,000
Payroll Summary 25,000
To distribute factory labor costs incurred.
6. Other factory overhead costs incurred:
Payroll taxes accrued $3,000
Repairs (on account) 1,000
Property taxes accrued 4,000
Heat, light, and power (on account) 2,000
Depreciation 5,000
$15,000
Factory Overhead 15,00
0
Accounts Payable 3,000
Accrued Payroll Taxes 3,000
Accrued Property Taxes Payable 4,000
Accumulated Depreciation 5,000
To record factory overhead costs incurred.
7. Factory overhead applied to production (at rate of 80 percent of direct labor cost):
41
Job No. 310, Product Y (0.80 x $5,000) $4,000
Job No. 320, Product Z (0.80 x $12,000) 9,600
Job No. 510, Product W (0.80 x $3,000) 2,400
$16,000
Work in Process Inventory 16,000
Factory Overhead 16,000
To record application of overhead to production.
It is important to note that as factory overhead costs are incurred, they are recorded in a subsidiary ledger and debited to the factory overhead account, as shown in journal entries nos. 2, 5, and 6.
8. The factory overhead costs applied to production are periodically credited to the factory overhead account and debited to the work-in-process account, as illustrated in journal entry no. 7). The issue of factory overhead application will be discussed in detail later in the chapter.
9. Jobs completed and transferred to finished goods inventory (see Figure 4 for details):
Job No. 310 (4,000 units of Product Y @ $6.30) $25,200
Job No. 320 (10,000 units of Product Z @ $3.56) 35,600
$60,800
Finished Good Inventory 60,800
Work in Process Inventory 60,800
To record completed production for June.
10. Sales on account for the month: 500 units of Product X for $8,000, cost, $5,500; and 10,000 units of Product Z for $62,000, cost, $35,600 (Job No. 320).
Accounts Receivable 70,000
Sales 70,000
To record sales on account ($8,000 + $62,000) for June.
Cost of Goods Sold 41,100
Finished Goods Inventory 41,100
42
After the above entries have been posted to the accounts of the company, the Work-in-Process Inventory and finished Goods Inventory accounts would appear (in T-account form) as follows:
Work-in-Process Inventory
June 1 balance 13,200 Completed 60,800 Direct materials used 23,000
Direct labor cost incurred 20,000 Overhead applied 16,000
Finished Goods Inventory
June 1 balance 5,500 Sold 41,100 Completed 60,800
The Work-in-Process Inventory account has a balance at June 28 of $11,400, which agrees with the total costs charged thus far to Job No. 510, as is shown in Figure 3.4. These costs consist of direct materials, $6,000; direct labor, $3,000, and factory overhead, $2,400. The Finished Goods Inventory account has a balance at June 28 of $25,200. The finished goods inventory card for Product Y supports this amount (see Figure 4), showing that there are indeed units of Product Y on hand having a total cost of $25,200.
Note that the entries in the ledger accounts given above are often made from summaries of costs and are thus entered only at the end of the month. On the other hand, in order to keep management informed as to costs incurred, the details of the various costs incurred may be recorded more frequently, often daily.
The above example should be studied until the real advantages of using overhead rates (including predetermined rates) are clear. Three jobs were worked on during the month. Job No. 310 was started last month and completed in June.
Job No. 320 was started and completed in June. And Job No. 510 was started but not finished in June. Each required different amounts of direct materials and direct labor (and, perhaps, different types of direct labor). Under these conditions, there is simply no way to apply overhead to products without the use of a rate based on some level of activity.
43 Note also that the use of a predetermined overhead rate permits the computation of unit costs of Job Nos. 310 and 320 at the time of their completion rather than waiting until the end of the month. But this advantage is secured only at the cost of keeping more detailed records of the costs incurred. As we shall see below, the other major cost system - process costing - requires far less record keeping, but the computation of unit costs is more complex.
EXAMPLE 1
Chiphard Works collects its cost data by the job order cost system. For Job 123, the following data are available:
Direct Materials Direct Labor
7/14 Issued $1,200 Week of July 20 180 hrs. @$6.50
7/20 Issued 650 Week of July 26 140 hrs. @ 7.25
7/25 Issued 350
$2,200
Factory overhead is applied at the rate of $4.50 per direct labor hour.
We will compute (a) the cost of Job 123 and (b) the sales price of the job, assuming that it was contracted with a markup of 40% of cost.
(a) The cost of job is:
Direct material $2,200
Direct labor:
180 hrs. x $6.50 $1,170
140 hrs. x $7.25 1,015 2,185 Factory overhead applied:
320 hrs. x $4.50 1,440
Cost of Job 123 $5,825
(b) The sales price of the job is:
44
45
EXAMPLE 2
The following account appears in the ledger after only part of the postings have been completed for June:
Work-in-Process Balance, June $132,200 Direct Materials 134,500 Direct Labor 112,000 Factory Overhead 220,000 $598,700
Job finished during June are summarized as follows:
Job 101 $56,700
Job 107 230,200
Job 111 127,500
$414,400
We will prepare (a) the journal entry to record the jobs completed and (b) determine the cost of the unfinished jobs at June 30.
(a) The journal entry is:
Finished Goods 414,400
Work in Process 414,400
(b) The cost of unfinished jobs is:
$598,700 - $414,400 = $184,300
FACTORY OVERHEAD APPLICATION
Many items of factory overhead cost are incurred for the entire factory and for the entire accounting period and cannot be specifically identified with particular jobs. Furthermore, the amount of actual factory overhead costs incurred is not usually available until the end of the
46 accounting period. But it is often critical to make cost data available for pricing purposes as each job is completed. Therefore, in order for job costs to be available on a timely basis, it is customary to apply factory overhead by using a predetermined factory overhead rate.
Note: Although an actual rate is simple to compute, the results are misleading because overhead rates may fluctuate significantly from month to month. When these fluctuations occur, similar jobs completed in different months will have overhead costs and total costs that differ.
Predetermined Factory Overhead Rate
Regardless of the cost accumulation system used (i.e., job order or process), factory overhead is applied to a job or process. Companies use predicted levels of activity and cost rather than actual levels. The successful assignment of factory overhead costs depends on a careful estimate the total overhead costs and a good forecast of the activity used as the cost driver.
The predetermined overhead rate is determined as follows:
Budgeted annual factory overhead costs Predetermined overhead rate = Budgeted annual activity units
(direct labor hours, machine hours, etc.)
Budgeted activity units used in the denominator of the formula, more often called the
denominator activity level or cost driver, are measured in
(1) direct labor hours (2) machine hours (3) direct labor costs (4) direct material dollars or (5) production units.
Disposition of Under- and Over-Applied Overhead
Inevitably, actual overhead cost incurred during a period and factory overhead costs applied will differ. Conventionally, at the end of the year, the difference between actual overhead and applied overhead is closed to cost of goods sold if it is immaterial. On the other hand, if a material difference exists, work-in-process, finished goods, and cost of goods sold are adjusted on a
47 proportionate basis based on units or dollars at year-end for the deviation between actual and applied overhead. Underapplied overhead and overapplied overhead results as follows:
Underapplied overhead = Applied overhead < Actual overhead Overapplied overhead = Applied overhead > Actual overhead
EXAMPLE 3
Two companies have prepared the following budgeted data for the year 20X1:
Company X Company Y
Predetermined rate based on Machine hours Direct labor cost
Budgeted overhead $200,000 (1) $240,000 (1)
Budgeted machine-hours 100,000 (2)
Budgeted direct labor cost $160,000 (2)
Predetermined overhead rate (1)/(2) $2 per machine hour 150% of direct labor cost
Now assume that actual overhead costs and the actual level of activity for 20X1 for each firm are shown as follows:
Company X Company Y
Actual overhead costs $198,000 $256,000
Actual machine hours 96,000
Actual direct labor cost $176,000
Note that for each company, the actual cost and activity data differ from the budgeted figures used in calculating the predetermined overhead rate. The computation of the resulting underapplied and overapplied overhead for each company is provided below:
Company X Company Y
Actual overhead costs $198,000 $256,000