WHITE PAPER
May 2013
Website Redesign
A/B Testing
Deepak Rathee
Delivery Manager
Vijay Ramanan
Executive Summary
A/B testing is a science. A/B testing is about taking an action and measuring its effects. That is, doing an experiment. One can experiment with small things, like the color of a button on a website. One can also experiment with large things, like business models, new technology, and other disruptive changes.
The critics see the small experiment used to market A/B testing to internet
businesses and think it is the totality of the method. They are right that
companies usually don’t A/B test large changes. It is unusual to run two or more different business models, for example. That doesn’t mean these experiments aren’t done, but they are typically done at the level of the market rather than the individual company. Different companies, called competitors, experiment with a particular combination of strategy, model, and implementation, and the market measure their effect. Sometimes big companies will run these experiments internally.
Google, for example, is currently experimenting with both Android and Chrome OS in more or less the same space. Complex experiments like this aren’t controllable nor are they repeatable, so the methods of social science are preferred over those of the
Executive Summary
hard sciences, but they still fall within the scientific paradigm.
Over the last few years Lister Tech has developed and redesigned various websites for industrial and consumer businesses worldwide. Our web applications, shopping carts, and specifically designed A/B test models have brought great success for many of our customers. One of the services that we offer our clients is an analysis of current internet marketing trends via various methods of split testing, which enables our clients to position
themselves to benefit from the
competitive advantage of early decision on whether to go for a website redesign or not.
The Key findings of the current A/B testing landscape are:
We consider various platforms in the decision-making process.
Experiments vary in frequency, type of page and page element.
Often more than a platform is used to cover all requirements.
Established hypotheses before the start of the test are often wrong. Missing budget is the main reason for not applied testing.
Complexity of the tools and missing
•
•
•
•
•
•
best practices are the top challenges.
•
A/B and multivariate testing “is worth”.•
Behavioral targeting is used little but constantly increasing.The research conducted for this white paper provides statistics based on both industrial B2B websites and consumer based B2C websites, and provides insight into the current “Testing Market” trends for the need of redesign.
Data for this white paper was compiled from the analysis of the recently redesigned website for one of our renowned
organization in language services.
3
A/B split testing is the most basic landing page optimization method available. The name comes from the fact that two versions of your landing page ("A" and "B") are tested. "Split testing" refers to the random assignment of new visitors to the version of the page that they see. In other words, the traffic is split and all versions are shown in parallel throughout the data collection period (usually in equal proportions). This is an important requirement. Parallel tests should always be conducted (as opposed to
one-after-the-other "sequential" ones). This allows you to control as many outside factors as possible. The random assignment of new visitors to particular landing page designs is also critical, because randomness is the basis for the probability theory that underlies the statistical analysis of the results. Usually, version "A" is defined as your original control page, or baseline
(commonly called the champion version). The other version is the alternative (commonly called the challenger). If the challenger proves to be better than the champion, the challenger replaces the champion after the test and becomes the new champion to beat in any subsequent tests.
•
Number of inbound links to individual pagesWhat to test?
Your choice of what to test will obviously depend on your goals. For example, if your goal is to increase the number of sign-ups, then you might test the following: length of the sign-up form, types of fields in the form, display of privacy policy, “social proof,” etc. The goal of A/B testing in this case is to figure out what prevents visitors from signing up. Is the form’s length intimidating? Are visitors concerned about privacy? Or does the website do a bad job of convincing visitors to sign up? All of these questions can be answered one by one by testing the appropriate website elements.
Even though every A/B test is unique, certain elements are usually tested:
•
The call to action’s (i.e. the button’s) wording, size, color and placement•
Headline or product description•
Form’s length and types of fields•
Layout and style of website•
Product pricing and promotional offers•
Images on landing and product pages•
Amount of text on the page (short vs. long).Website Redesign on your mind?
There are many good reasons for a website redesign, whether it’s a rebranding, moving onto a new Content Management System (CMS), or might be a full revamp or a
technology migration. Beware, a redesign can be a huge success – or it could fail terribly. After all, it’s a long and tedious process. Be really clear about why you’re doing the redesign in the first place and tie it to measureable results. Consider the following objectives:
•
Number of visits/visitors/unique visitors•
Bounce rate•
Time on site•
Current SEO rankings for important keywords•
Domain authority•
Number of new leads/form submissions•
Total amount of sales generatedNow how really can a redesign hurt?
Your existing website contains a lot of assets that you have built up, and losing those during a redesign can damage your
marketing. For instance, such assets might include:
•
Most shared or viewed content•
Most trafficked pages•
Best performing keywords you rank for and associated pagesA High Level Walkthrough
A/B testing on the Web is similar. You have two designs of a website: A & B. Typically, A is the existing design (called the control), and B is the new design. You split your website traffic between these two versions and measure their
performance using metrics that you care about (conversion rate, sales, bounce rate, etc.). In the end, you select the version that performs best.
How much of a difference can testing make?
In our experience, if you are running a series of tests on previously untested pages, lead generation marketers can often see a ~40% bump in results. eCommerce marketers often see a ~20% bump. That means if 10% of your visitors currently convert on a page, with testing your page could get a 12%-14% conversion rate. You wind up with more clicks, more leads, more orders… from the exact same amount of traffic! Source: smashingmagazine.com Sample A / B Test Page Title Content Body News Block
Version A Visitors randomly distributed Version B
Version B is better than Version A
Signup Form
Page Title
Content Body Nav Bar Nav Bar
Signup Form News Block
50 Signups 75 Signups
“A/B testing, split testing or bucket testing is a method of marketing testing by which a baseline control sample is compared to a variety of single-variable test samples in order to improve response or conversion rates. Thus helps customer to compare the results and decide ‘Go’, ‘No-Go’ for the website revamp.”
Data from a market study reveals that 65% of marketers still aren’t running tests on their Web or landing pages. Those who do test have a clear competitive advantage.
0 10 20 30 40 50 60 70 80
Marketers who run A/B tests on email campaigns
Marketers who run A/B or multivariate tests on web pages How many marketers use
tests to optimize response rates?
While redesigning a website for one of our esteemed client, we performed tedious A/B split test executions and analyzed the results thoroughly. We checked numerous scenarios across the website based on the requirement.
Client Requirement:
During the initial discussion with the business we were able to gather the base requirement for our tests. Client was eager to know the outcome of A/B split testing for following scenarios:
•
Free trials for the guest users•
Offers and new promotions•
Banners and Page layouts•
Chat module on specific pages•
Security badge on specific pages•
Customer Reviews and Ratings•
Products launch and display•
Price change viz. increase/decrease split•
Shopping cart on certain pages We provided thorough testing of various experiences (splits) in a campaign and further tested multiple campaigns on a website.Below are the steps followed by the
business strategy, developers & the testers (QA).
•
Business Strategy provides the overview and the mockup of requested testexperiences, along with other required
details (like exclusions).
•
Developers set up the campaign tool based on the split percentage. For ex: Controlled (Test A) ~ 40%, Test B ~ 20%,Test C ~ 20% and Test D ~ 20%.
•
Developers enables the QA/Test campaigns (setting of different splits) in the testenvironment.
•
Developers modify web site code to handle pricing, product offering or other dynamic content changes as per the test requirement.•
Developers publish new required web assets and prepare new web experiences,HTML code.
•
QA tests the new experiences on the staging server for browser compatibility, etc. Initial tests are configured by forcing a static URL. This leads to a test behavior, which is different from the controlled (default) behavior.•
Once the configuration settings are done for different splits, Re-testing is done by the QA in order to check that we land to different splits.Note – QA need to clear the cache and
cookies everytime they perform the split check.
•
QA performs the general site regression testingRequirements & Test Scenarios
Cost per Action or CPA (sometimes known as Pay per Action or PPA) is an online advertising pricing model, where the advertiser pays for each specified action (a purchase, a form submission, and so on) linked to the advertisement. Pay per click (PPC) (also called Cost per click) is an Internet advertising model used to direct traffic to websites, where advertisers pay the publisher (typically a website owner) when the ad is clicked.
•
Business Startegy carries out the UserAcceptance Testing (UAT) on the staging server (all sides of the split).
•
Results are communicated to business holders and they set the % level for splits in production environment as per the need of the business.Once it’s verified and tested rigorously on staging environment similar campiagn settings are done on Production environment.
•
Business Strategy creates and approves the production-ready campaign in the tool (includes changing the so called forProd/for-QA targeting parameters and experience percentages). Same process is followed for all other test scenarios.There are various tools in the market that can help set up the campaigns and gather the test results. Few to the well known tools in the market are - Google Analytics, Open Analytics, Omniture Test & Target,
Kameleoon, Persoynze, Divolution, Avenseo, AB Tasty etc.
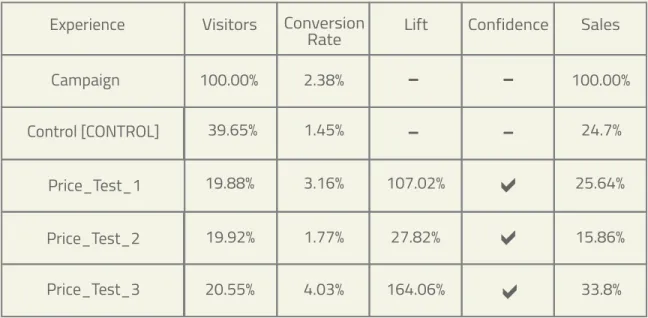
For our customer’s website we analyzed one of the challenging scenario viz. the 4 way Price Test. Here, we analyzed and compared the data results for the Control test (A) versus the Challenge tests (B, C, D viz. Test 1, 2, 3) and after the analysis we found that Test D (Test 3) wins over Test A (control) and Test B (1), C (2).
The results for the same are shared below:
Reports, results and discussion
Based on the above given multi-split testing results the Business Strategy decides to go with either the control or the challenges.
Caution: Set up a Monitoring Campaign before running your first test. This provides a baseline and overview of your Web site through multiple tests. A Monitoring Campaign informs downstream campaigns about the types of offers that are working and the audiences they are targeting.
Fig 1: The graphical results give a further comparison between A, B, C and D tests.
•
Graph 1 - The Control test (A) gives higher visitors turn around as compared39.65% 19.88% 19.92% 20.55% 39.65% (17429 visitors) VISITORS 178.70% Lift (364 Conv)4.03% 1.45% 3.16% 1.77% 4.03%
VISITOR CONVERSION RATE
$400.91 $380.01 $418.53 $379.84
AVERAGE ORDER VALUE
4.40% Lift $418.53 per order
$5.80 $12.00 $7.41 $15.31 $15.31 per visitor 164.06% Lift
REVENUE PER VISITOR
Control Price_Test_1 Price_Test_2 Price_Test_3
Graphs of Key Campaign results
Experience Visitors Conversion
Rate Lift Confidence Sales Campaign 100.00% 2.38% 100.00% 39.65% 1.45% 24.7% 25.64% 107.02% 3.16% 1.77% 4.03% 164.06% 33.8% 27.82% 15.86% 19.88% 19.92% 20.55% Control [CONTROL] Price_Test_1 Price_Test_2 Price_Test_3
-
-Lister Technologies White Paper | Web Redesign - A/B Testing 7
Average order value (AOV) is a metric representing the value of an average order within a period of time. It is quite simply calculated by dividing Revenue by Number of Orders in a specific Period of Time.
Fig 2: The campaign report for A/B/C/D split given above shows the following comparisons viz. Experience (splits), Visitors, Conversion Rate, Lift, Confidence, and Sales.
Data depicts that among all 4 experiences (splits) only one experience is a push winner. Experience D here has comparatively more number of visitors, better conversion rate, higher RPV, lift percent and 100% confidence.
Confidence level is represented by the filled-in bars in the confidence column for each experience. The confidence level, or statistical significance indicates how likely it is that an experience's success was not due to chance. A higher confidence level indicates:
•
The experience is performing significantly different from control.•
The experience performance is not just due to noise.•
If you ran this test again, it is likely that you would see same results.to the Challenge tests (B, C, D). Visitors turn around for Control test (A) is 39.65%.
•
Graph 2 – Visitor conversion rate is highest for Test D as compared with other tests. Overall test D shows a conversion rate of 4.03% which in turn provides a lift of 178.70% as compared to the base.•
Graph 3 – Average order value is more for Test C as compared to Test A, B and D. Overall test C shows a high order value of $ 418.53, which in turn provides a lift of 4.40% as compared to the base.•
Graph 4 – Revenue per Visitor again shows a lift for Test D over Test A, B and C. Overall test D shows a RPV of $15.31, which in turn provides a lift of 164.06% as compared to the base.Therefore, out of 4 level comparisons among both tests, Test D (Test 3) scores over all other tests and should be a best pick.
Conversion rate is the number of conversions divided by the number of visitors (or visits or impressions).
Lift is the percentage difference of your tested experience vs. control.
Revenue per visitor (RPV) is the total sales number divided by the number of visitors (or visits or impressions).
If the confidence level is over 90% or 95%, then the result can be considered statistically significant. Before making any business decisions, try to wait until your sample size is large enough and that the 4 bars of confidence on one or more experiences stays
consistent for continuous length of time to ensure the results are stable.
A successful website redesigning starts even before the site is being “designed.” Often times, people get caught up in how the website looks and this focus overshadows how well it is working. Remember, a website is not a silo. Its integration with other functions, such as social media, email marketing and lead generation, is critical.
Lister technologies eliminate the hassle for its prestigious customers and provide a competent data analysis for the variations to the customer, so as the customer compares the results from the test scenarios and can reach a decision quickly. Team here not only provides the test results but also offers a proactive study on the market trends and analyzes the data for your competitors viz.
•
See how your competitors are faring in search, social media and lead generation.Lister E-Business is an end-to-end solutions provider across the entire e-business lifecycle. We leverage our deep industry expertise in e-marketing, e-commerce and e-services, to help businesses of various sizes maximize their potential. Our track record of delivering excellent customer service, high quality software and value for money ensures we are a long-term
ABOUT US
•
Delve deeper into your competitor’s strengths and weaknesses.•
Compare your lead and sales conversion rates with other companies in yourindustry.
All websites redesigned by Lister technologies are tailored to the consumer experience via A/B..N split testing.
“A/B testing affords us a safe environment where the changes we make can be reversed if they don't perform as we expected. Over time A/B testing will give you the ability to increase a website’s
conversion rate, and thus the revenue generated by the site; if you can achieve this your clients will be most appreciative.
Lister E-Business is an end-to-end solutions provider across the entire e-business lifecycle. We leverage our deep industry expertise in emarketing, e-commerce and e-services, to help businesses of various sizes maximize their potential. Our track record of delivering excellent customer service, high quality software and value for money ensures we are a long-term partner for many customers.
What is A/B Testing?
A/B split testing is named for the two website versions that you are considering."A" refers to the original or baseline version of your site. "B" refers to the alternative or challenger version. Often A/B splits are done on an ongoing basis. This format is
commonly referred to as "champion/challenger".
Significant improvements can be seen through testing elements like copy text, layouts, images and colors. However, not all elements produce the same improvements, and by looking at the results from different tests, it is possible to identify those
elements that consistently tend to produce the greatest improvements.
Users of A/B testing will distribute multiple samples of a test, including the control, to see which single variable is most effective in increasing a response rate or other desired outcome. The test, in order to be effective, must reach an audience of a sufficient size that there is a reasonable chance of detecting a meaningful difference between the control and other tactics.
What things can/should you test on AB TEST?
•
Call to action ButtonsKeep the Tests running until you are confident that one wins over the other
Small conversion wins are not a good indication of a winning content. Have the tests running for a reasonable time and only accept content that is visibly winning.
Start Small
If you are starting out on A/B testing, start by making smaller changes such as placements of content blocks on your website
Put Bolder Testing for smaller percentages or New Visitors
If you are making a radical change on your content to test, test it on a small percentage first. Lots of times big changes on site don’t resonate well with the visitors. Many tools allow you to test new visitors rather than returning visitors so test on this group first before testing it on all the visitors.
A/B Testing Tools
Free A/B Testing Tools
•
Google Website Optimizer•
Page Layouts•
Sign up Forms•
Email Subject Lines•
Checkout ProcessesWhere can/should you use A/B Testing?
On your Website
•
Home page of your website•
Sign up pages on your website•
Any High Traffic Landing pages on your websiteeCommerce Store
•
Checkout Page•
Add to Cart call to action•
Product Landing PagesEmail Marketing
•
Subject Lines•
Call to action buttonsSearch Engine Marketing
•
Main Tag Line•
DescriptionsA/B Test Best Practices
Test Pages with high traffic
Not enough traffic means that the results might not be accurate. Make sure your testing sample size is large enough.
9
Glossary
Paid A/B Testing Tools
•
Adobe T & T powered by Omniture•
Amadesa A/B and Multivariate Testing•
Maxymiser Multivariate Testing•
Optimost•
SiteSpectAdvantages of A/B Split Testing
East of test design - Unlike more
complicated multivariate tests, split tests do not have to be carefully designed or balanced. You simply decide how many versions you want to test, and then split the available traffic evenly among them.
No follow-up tests are required to verify the results - the best performer in the test is declared the winner.
Simple to implement - Many software packages are available to support simple split tests. If you are testing granular test elements, you can design, set up your test, and be collecting data literally within a matter of minutes. This can be done in most cases without support from your I.T. department or others within the
company. You may even be able to collect the data you need with your existing Web analytics tools.
Requires little knowledge of statistics -
Only very simple statistical tests are needed to determine the winner. Basically, all you have to do is compare the baseline version to each challenger to see if you have reached your desired confidence level.
The only approach available to low data rate sites - If your landing page only has a few conversions per day, you simply
cannot use more advanced tuning
methods. But with the proper selection of the test variable and alternative values, you can still achieve significant results in a split test. Improvements in the double or even triple digits are not uncommon.
Drawbacks of Split Testing
Can only test one page element or design at a time - While you have probably identified a number of potential issues with your landing page, A/B testing requires you to test only one new idea one at a time. You will need to guess which ideas to test first (based on your intuition about which ones might make the most difference).
Inefficient data collection - Because they measure more than one variable,
multivariate test make much more efficient use of the data that is collected.
No way to discover the importance of page elements - Some A/B tests involves multiple changes, or even a whole-page redesign. In the end, you'll know which version performed best, but you won't know what specific elements contributed to the increase in conversions. My putting all the elements you want to test into a single version, you've aggregated the data and lost the ability to look at them
separately.
Does not take variable interactions into account - By definition, split tests consider only one variable at a time, so you cannot detect variable interactions. Furthermore, a series of split tests is not the same as a multivariate test with the same variables. Depending on the variable interactions, you may not be able to find the
best-performing recipe at all.
Do’s And Don’ts
•
Even though A/B testing is super-simple in concept, keep some practical things in mind. These suggestions are a result of my real-world experience of doing many A/B tests.Dont’s
•
When doing A/B testing, never ever wait to test the variation until after you’ve tested the control. Always test both versions simultaneously. If you test one11
simultaneously. If you test one version one week and the second the next, you’re doing it wrong. It’s possible that version B was actually worse but you just happened to have better sales while testing it. Always split traffic between two versions.
•
Don’t conclude too early. There is a concept called “statistical confidence” that determines whether your test results are significant (that is, whether you should take the results seriously). It prevents you from reading too much into the results if you have only a few conversions or visitors for each variation. Most A/B testing tools report statistical confidence, but if you are testing manually, consider accounting for it with an online calculator.•
Don’t surprise regular visitors. If you are testing a core part of your website, include only new visitors in the test. You want to avoid shocking regular visitors, especially because the variations may not ultimately be implemented.•
Don’t let your gut feeling overrule test results. The winners in A/B tests are often surprising or unintuitive. On agreen-themed website, a stark red button could emerge as the winner. Even if the red button isn’t easy on the eye, don’t reject it outright. Your goal with the test is a better conversion rate, not aesthetics, so doesn’t reject the results because of your arbitrary judgment.
Do’s
•
Know how long to run a test before giving up. Giving up too early can cost you because you may have gotten meaningful results had you waited a little longer. Giving up too late isn’t good either, because poorly performing variations could cost you conversions and sales. Use a calculator to determine exactly how long to run a test before giving up. (Microsoft, offers a free calculator you can use to predict roughly how long your test may require. This free Excel tool is currently available for download at
http://exp-platform.com/Documents/Pow erCalc2.xlsx )
•
Show repeat visitors the same variations. Your tool should have a mechanism for remembering which variation a visitor has seen. This prevents blunders, such as showing a user a different price or a different promotional offer.•
Make your A/B test consistent across the whole website. If you are testing a sign-up button that appears in multiple locations, then a visitor should see the same variation everywhere. Showing one variation on page 1 and another variation on page 2 will skew the results.•
Do many A/B tests. Let’s face it: chancesare, your first A/B test will turn out a lemon. But don’t despair. An A/B test can have only three outcomes: no result, a negative result or a positive result. The key to optimizing conversion rates is to do a ton of A/B tests, so that all positive results add up to a huge boost to your sales and achieved goals.
Conversion rates and what to measure
A conversion rate is the rate at which visitors perform a desired action for the test, such as the visitor clicking on an offer or adding products to their cart. Additional metrics are used to evaluate the test, such as revenue per order. Reports tell you which combination of changes yielded the best results based upon the conversion rate or uplift in the metrics defined.
To perform an A/B test you will need to measure a conversion rate; the objective of the test being to increase this conversion rate. The most obvious form of conversion rate is sales and can be worked out as the number of sales per 100 visits; so if you average 2 sales per hundred visits your conversion rate is 2%. Raising this conversion rate from 2% to just 2.5% would mean a 25% increase in sales, when viewed this way conversion rates really should be something worth paying a lot of attention to.
sales you can measure the impact of a change However conversion rates can be any
on sales revenue.
Conversion rates can also be measured in terms of revenue. Instead of the number of sales you can measure the impact of a change on sales revenue.
However conversion rates can be any
measurable action and are not just restricted to ecommerce sites and sales. Conversion rates can include:
•
Sales•
Leads (e.g. booking a test drive or requesting an information pack)•
Newsletter sign ups•
Clicking on revenue generating banners or affiliate links•
Spending a minimum amount of time on the site (this is great for detecting low quality pages where visitors are not engaged)Setting up a test
•
Decide what to test•
Set up two designs you want to test (one is the control which is often the original version)•
Don’t be afraid to be bold and test big changes to start with•
Ideally you want a 95% confidence level that your test is statistically significant•
Choose a tool to run your tests or work with a professional company specializing in testingMultivariate Testing
Multivariate testing is similar to A/B testing, but includes more options. Where an A/B test compares two things, a multivariate test might test three, four, or five different designs.
If you opt to use multivariate tests rather than just simple A/B tests, it’s still a good idea to only test one element at a time. In fact, the more options you include in the test, the more complicated interpreting results becomes, and those complications are only exacerbated by testing more than one element.
Multivariate tests can be particularly useful if your client is unsure of how they want their site designed. You can test two or three completely different website mockups and see which one performs the best.
You may then want to run A/B tests on specific elements within the winning design to make sure it’s optimized as well as it can be.
Resources For Deep-Diving Into A/B Testing
If you’ve read this far, then A/B testing has presumably piqued your interest. Here, then, are some cherry-picked resources on A/B testing from across the Web.
Get Ideas for Your Next A/B Test
Which Test Won?
A game in which you guess which variation won in a test.
101 A/B Testing Tips
A comprehensive resource of tips, tricks and ideas.
ABtests.com
A place to share and read A/B test results.
A/B Ideafox
A search engine for A/B and multivariate case studies.
Introductory Presentations and Articles
•
Effective A/B Testing•
Practical Guide to Controlled Experiments on the Web (PDF)•
Introduction to A/B TestingThe Mathematics of A/B Testing
•
Statistics for A/B Testing•
How Not to Do A/B Testing•
What You Should Know About the•
Mathematics of A/B Testing•
Easy Statistics for AdWords A/B Testing, and Hamsters•
Statistical Significance and Other A/B Test PitfallseBusiness
78-080 Calle Amigo, Ste. 200 La Quinta, CA 92253.
www.listertechnologies.com
©Lister Technologies, 2013. White Paper Website Redesign - A/B Testing All rights reserved.