Religion and the Emergence of
Large Societies
Elise E. Koster 5982448 Bachelor thesis Credits: 18 ECBacheloropleiding Kunstmatige Intelligentie University of Amsterdam Faculty of Science Science Park 904 1098 XH Amsterdam Supervisor Dr. B. Bredeweg Institute for Computer Science
Faculty of Science University of Amsterdam
Science Park 904 1098 XH Amsterdam
Abstract
One hypothesis for the evolutionary advantage of religion is that it emerged to function as a substitute for social control in large hunter-gatherer societies. This paper presents different multi-agent models (using reinforcement learning and a genetic algorithm) and observes the group sizes and compositions that emerge. The models confirm earlier research that claims altruists are better for group survival. The reinforcement learning model does not confirm the hypothesis that religion is better for group survival; a purely genetic model, however, does.
Contents
1 Introduction 4 1.1 Theoretical background . . . 4 1.2 Problem at hand . . . 5 2 Simulating societies 6 2.1 Multi-agent system . . . 7 2.1.1 Social reputation . . . 72.2 Discrete reinforcement learning . . . 7
2.2.1 States and actions . . . 7
2.2.2 Rewards and learning . . . 8
2.2.3 Action Selection . . . 9
2.3 Static agents . . . 9
2.4 Reproduction . . . 10
3 Experiments and Results 10
4 Discussion 21
5 Conclusion 22
1
Introduction
A well-supported hypothesis for the evolutionary roots of religion offers in-sight into the causes and effects of religion in different communities.Three theories have been put forward [6] that attempt to explain the evolution of religion:
• Cognitive theories: religion as a by-product of another ‘mental mod-ule’ [1]. For example, religious visions as a side-effect of anthropomor-phization (in this context, seeing faces in inanimate objects), a mental module that developed because it increases alertness to predators. • Ecological regulation theories: religion as an adaptive mechanism with
regards to the environment. For example, prohibiting the consumption of pigs because they use urine and excrement to cool off in warm climates [9].
• Commitment theories: religion ensures cooperation within communi-ties [20]. For example, rituals require a significant investment of re-sources, signaling that those who partake in them are not faking their commitment to the group.
1.1 Theoretical background
One of the commitment theories posits religious belief as a substitute for social control, i.e. belief in a supernatural entity that observes everyone continuously, like security cameras do [19]. When human beings started liv-ing as foragers, survival required cooperation, as individuals were not able to collect enough resources to prevent starvation on their own [22]. Therefore, evolution favoured those individuals with a propensity for collaboration. However, human beings are prone to indolence, as spending less energy for the same amount of food (or other resources) increases one’s chances of survival. Consequently, in any group effort there will be individuals who take advantage of the community’s work without contributing to it. These individuals will harm the other individuals in the group (whodid spend en-ergy collecting resources), eventually preventing the group as a whole from thriving. As a consequence, hunter-gatherer groups remained small, being limited to family members and a few neighbours [19]. In this social setting, control was tight and only those who contributed to the foraging activities would have been entitled to a share of the resources gained. ‘Parasites’, i.e. non-contributors, would not be able to prosper. People’s preference for altruists has been demonstrated in a study [13] where participants donated more generously when they were told the recipient behaved altruistically in the past. Thus, maintaining a positive social reputation became a necessity for survival, forcing people to behave more altruistically when other mem-bers of the group were observing them. Some effects of this mechanism have
been observed in studies: posting an image of a pair of eyes above an hon-esty box (where people are trusted to pay a fair price for the goods they’re taking) increases the donations deposited, compared to posting a control image of some flowers [2].
According to the ‘security camera’-hypothesis, individuals who believe a deity is watching them behave in a more pro-social way, i.e. more concerned with social reputation [12]. Thus, religious groups to grew larger because their belief in a supernatural force reduces the amount of ‘parasites’. This view is supported by the fact that both religion and large societies devel-oped around the same time [19]. The mechanism of belief in supernatural entities stimulating social behavior has also been demonstrated in research: telling children an invisible person is watching them reduces their tendency to cheat [15] and priming adults with religious concepts increases the size of donations they give to anonymous strangers [19].
To test hypotheses about early human societies, research has been done in the field of social simulation, where the prosperity of societies has been modeled in multi-agent systems. One study modeled social interaction in a multi-agent system using the Prisoner’s Dilemma, where cooperators were altruistic agents and defectors were selfish agents [3]. Cooperators collected less resources than defectors in the short term, but ended up with more in the long term. Groups with many altruistic agents amassed more resources than those groups that were permeated by selfish agents. A 2005 study [23] used a multi-agent system to model the appearance of new religious movements. However, this study focused on thesocial, not biological evolu-tion of religion in a modern context. Another study [6] used a multi-agent system to research whether or not religion is an evolutionary adaptation, by modeling communications about the real (verifiable) and an unverifiable world. As such, it modeled the effect ofone aspect of religious behavior on social selection, instead of simulating an environment where one hypothesis is tested. In this study, the ‘greenbeard’-effect [8] [5] is tested using a com-putational model. The greenbeard-effect, in this context, is the idea that religious people are given preferential treatment by others because they are seen as more trustworthy.
1.2 Problem at hand
The central question in this study is whether belief in a supernatural force enables the development of significantly larger societies. The research re-ported in this thesis models a hunter-gatherer society where individuals seek to maximize both their social reputation and the amount of resources col-lected. The growth of populations, the amassing of resources, mortality rates and reproduction rates for groups with different levels of belief are
examined to test the effect religion has on both the size and composition of societies. The paper begins by outlining the research method by describing the algorithms used and how each parameter is set in chapter 2. The re-sults are presented in chapter 3 and discussed in chapter 4. A recap of the research conducted is presented in chapter 5 and proposed future work is discussed in chapter 6.
2
Simulating societies
To simulate a Hunter-Gatherer (HG) society, a model was built that sim-ulates several aspects of life, namely, foraging activities in small groups, altruistic, selfish and neutral actions, the amassment of resources, social reputation and control, reproduction of the fittest agents and finding a bal-ance between collecting as many resources as possible while maintaining a positive social reputation.
The colony of HGs is simulated by a multi-agent system, where each agent represents one HG individual (HGi). Each HGi inherits a policy, i.e. a pre-disposition towards certain actions, from a parent. Four different models have been implemented, two of which using reinforcement learning, where an agent learns the best action to take by receiving rewards from the en-vironment. In these versions, belief alters the reward received from the environment. This combination of inheritance and learning models the in-teraction between nature and nurture in human beings. The third model initializes a certain percentage of static agents (who do not learn), either altruists (who are most likely to pick a social action) or egoists (who are most likely to pick a selfish action). Belief is not modeled in this version. The last model initializes agents with random static policies, where belief modifies the likelihood of certain actions.
In every model, each agent that selects an altruistic action invests some energy (resources) into the foraging activity, while each agent that chooses to leach off the group invests nothing. To model ease of finding food within the current environment, the environmental return (RETURN) is defined as a parameter that each agent’s energy investment is multiplied with. This means that the return per individual for a group that consists only of altru-ists equals RETURN, while adding egoaltru-ists will reduce this number. Agents forage in groups of five (as women in the Hadza, a group of modern hunter-gatherers in Tanzania, do [11]), causing every egoist added to the group to reduce the return per individual of foraging by 15, ending at 0 for a group without altruists. Reproduction is based on the amount of resources that an agent has collected, as agents with more resources are better adapted to the environment. Therefore, the agent has a higher fitness and will thus
reproduce more.
2.1 Multi-agent system
Each agent is an object that keeps track of multiple aspects: • The agent’s own social reputation;
• The amount of resources the agent has collected; • The agent’s preference for certain actions;
• A representation of what the agent knows about the social reputation of other agents.
2.1.1 Social reputation
An agent’s social reputation is a numeric value that reflects how many al-truistic and selfish actions that agent has taken in the past. Each agent keeps an internal record of the social reputations of the agents it foraged with. However, it has no information about agents it has not interacted with. If an agent forages with an individual with a low social reputation, it will store this information internally. The next time they interact, the agent will check the individual’s social reputation, see that it is low, and remove the agent from the foraging group. The agent that was removed will not be able to forage with the other agent again.
In small groups, this mechanism will quickly disable an agent from gathering resources, increasing the chance that the agent will starve or be unable to reproduce. In larger groups however, the agent has a smaller chance of hav-ing interacted with a specific agent before, decreashav-ing the impact of social reputation on its chances of survival.
2.2 Discrete reinforcement learning
2.2.1 States and actions
An action that is optimal in one situation might be sub-optimal in a different situation. In this case, situations are modeled as discrete states. Every state is a combination of an agent’s social status STATUS and the amount of resources hoarded RESOURCES. This leads to a total of 9 possible states:
• Agent is hated and has a low number of resources • Agent is hated and has a medium number of resources • Agent is hated and has a high number of resources
• Agent is neutral and has a low number of resources • Agent is neutral and has a medium number of resources • Agent is neutral and has a high number of resources • Agent is loved and has a low number of resources • Agent is loved and has a medium number of resources • Agent is loved and has a high number of resources
An agent may select one of three actions: a selfish, altruistic or neutral ac-tion. Selecting a selfish action comes down to stealing from the group and as such, will decrease an agent’s social reputation. Selecting an altruistic action means participating in a foraging activity and while this requires an investment of some resources, it will increase the agent’s social reputation. If the agent chooses a neutral action, neither its social reputation nor its resources will change.
Each agent lives for a certain amount of time (set to 30 years, to model the average age of death of hunter-gatherers [7]), after which reproduction takes place. This is a simplified model for the number of children an HGi will have during an average HG-lifespan. During every time step one action is selected, and each agent loses some resources to reflect the fact that merely staying alive costs energy. Thus, while selecting a neutral action seems safe, it will (slowly) lead to a depletion of resources. Once an agent is out of resources, it dies of starvation.
2.2.2 Rewards and learning
In reinforcement learning, agents learn what actions are best for which sit-uation by using the reward they receive to update the selected state-action pair’s expected reward, or the Q-value. Two different types of reinforcement learning are tested: Q-learning [16] and SARSA [18]. Both types update the Q-values for state-action pairs with the help of rewards gained from the en-vironment by selecting a certain action while being in a certain state. For Q-learning, the Q-value is updated according to equation 1, for SARSA, the Q-value is updated according to equation 2.
Q(st, at)←Q(st, at) +α[rt+1+γ maxQ(st+1, a)−Q(st, at)] (1)
Q(st, at)←Q(st, at) +α[rt+1+γQ(st+1, at+1)−Q(st, at)] (2)
Both Q-learning and SARSA use the reward for the current state-action pair (rt+1) to update the Q-value of the previous state-action pair (Q(st, at)).
the corresponding Q-value (max Q(st+1, a)) to update, while SARSA uses the Q-value for the actual action taken (Q(st+1, at+1)) [21] - consequently, SARSA might be a more appropriate implementation of reinforcement learn-ing, as human beings are not completely rational agents. Every time an action is selected, the Q-value for that action in the current state is updated using one of the above formulas. These formulas use the learning rateα, and a discount rateγ, as well as the Q-values for the current and previous state and the reward for the current state to update the Q-value for the action chosen in the previous state. The discount factorγ ensures that the further a reward is in an agent’s history, the less it determines the likelihood of the action being chosen [21], while the learning rateα determines of how much importance the new feedback is compared to the Q-value already found. In this model, the rewardr is defined as the sum of the difference in STATUS and the difference in RESOURCES (see equation 3).
rt= (ST AT U St−1−ST AT U St) + (RESOU RCESt−1−RESOU RCESt) (3)
Beliefb is modeled as an increase in the reward for altruistic actions, and a decrease in the reward for selfish actions. If the selected action is altruistic, the reward is altered using equation 4. If the selected action is selfish, the reward is altered using equation 5.
rt←rt+b (4)
rt←rt−b (5)
2.2.3 Action Selection
The algorithm used to select actions is greedy-, a basic algorithm that selects the action with the maximum Q-value, i.e. the highest expected reward, for that state (greedy), save for percent of the cases, in which a random action is selected. This way, the learned policy is both exploited, i.e. the optimal action is selected, andexplored, so that the agent does not get stuck in a suboptimal action that happened to return a large reward at first [21].
2.3 Static agents
In the models without reinforcement learning, agents in the first generation are instantiated with policies. In the first model, with static selfish and altruistic agents, the selfish agents receive a much higher Q-value for selfish actions than for other actions while the altruistic agents receive a much higher Q-value for altruistic actions than for other actions. In the random model, each state-action pair is assigned a random value between 0 and 100, which is then altered through belief according to equation 10 in the case of an altruistic action, and according to equation 11 in the case of a selfish action.
Q(s, a) = random(0,100)−b (7)
2.4 Reproduction
Once the time for a generation has depleted, reproduction takes place. This consists of measuring an agent’s performance in terms of resources against the ease of finding food in the current environment, i.e. the environmental return RETURN.
The number of children is determined using equations 6-9. RESOURCES>= RETURN×2 5 →3 children (8) RESOURCES>= RETURN×1 4 →2 children (9) RESOURCES>= RETURN× 1 8 →1 child (10) ELSE→0 children (11)
This means that if RETURN = 2 and time = 30, the agent needs at least 2×2
5×30 = 24 resources to produce 3 children (i.e. 4
5 per time step); seen as it loses 1 resource on each time step (ending at 0 resources on t = 0), it would need to have collected an average of 45 + 1 = 95 resources on each time step. For 2 children, it needs 64 resources, for 1 child 108 resources. If it has amassed less resources than that it fails to reproduce, even though it has managed to stay alive. Upon reproduction, one or more new agents are created and the policy of the parent is copied into them. In this manner, the fittest agents reproduce the most, while less fit agents still get a chance for their policy to be tested.
3
Experiments and Results
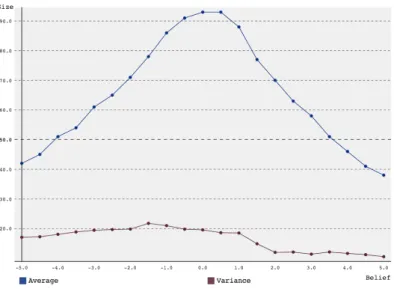
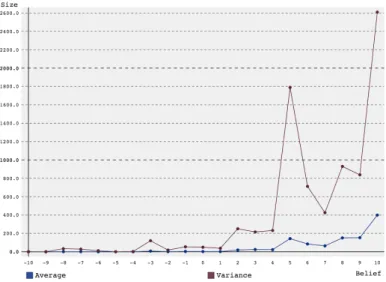
The first set of simulations was run starting with a group of 10 agents, to model the fact that HG-societies originally consisted of just family and a few neighbors [19]. SARSA (as described in chapter 2) was used, as this appeared to be a more accurate representation of human learning. The en-vironmental return was set to 2, and 3 generations were simulated, with discount factor 0.5, learning rate 0.5 andset to 10%. The amount of belief ranged from -5 to 5, with steps of 0.5. The results can be found in figure 1. The peak of the graph is around a belief of 0, with larger (both positive and negative) beliefs producing smaller average group sizes. This is contrary to what was expected, which was that higher belief, making agents more likely to choose altruistic and less likely to choose selfish actions, would lead to a
Figure 1: Average group size and variance over 1000 simulations versus amount of belief for a group starting with 10 agents over 3 generations using SARSA reinforcement learning.
higher average group size. This lead to the idea that maybe the premise that altruistic agents lead to a larger number of resources collected (and thus, larger group sizes) [3] was wrong. To test for this, the model was slightly altered.
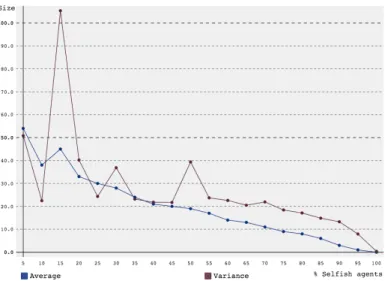
In the new model, agents were static (i.e. no reinforcement learning was used) and either selfish or altruistic. The selfish agents chose to leach 1−= 90% of the time, and the altruistic agents chose to help 1−= 90% of the time. The other 10% of the time, one of three actions (help, leach, do nothing) was chosen at random. Simulations ran 1000 times, simulating 2 generations, with different percentages of selfish agents (between 0 and 100 with step size 5) initialized in the first generation. The group size of the first generation was 100 so that the difference between, for example, 5% and 10% would be reflected. The results can be found in figure 2. For clarity, because the size at 0% selfish agents was so much higher than the rest, figure 3 shows the same results without the data point for 0%.
The average group size decreases from 1067 at 0% to 0 at 100%, confirming that selfish agents have a negative effect on group size. Thus, this was not the issue with the previous simulations. To test if SARSA was the prob-lem, the first set of experiments was repeated using Q-learning instead of SARSA. The results can be found in figure 4.
Figure 2: Average group size and variance over 1000 simulations versus percentage of selfish agents for a group starting with 100 agents over 2 generations without reinforcement learning.
Figure 3: Average group size and variance over 1000 simulations versus percentage of selfish agents (starting at 5%) for a group starting with 100 agents over 2 generations without reinforcement learning.
Figure 4: Average group size and variance over 1000 simulations versus amount of belief for a group starting with 10 agents over 3 generations using Q-learning reinforcement learning.
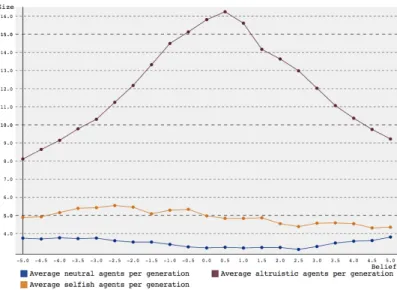
around a belief of 0, while larger beliefs, both in the positive and negative direction, decrease average group sizes. But, as the previous experiments showed, more altruistic agents should increase the size of the group. To test if the problem lay in the fact that higher belief did not increase the amount of altruistic agents, the average number of altruists per generation was plotted for different amounts of belief, for both SARSA and Q-learning. The results can be found in figure 5 (SARSA) and figure 6 (Q-learning). The type of the agent was determined by looking at the action it was most likely to pick, and the average was calculated over 3 generations in 1000 simulations. Thus, the average group size at generation 3 may be much larger than the sum of these averages.
Both in Q-learning and SARSA, the number of altruistic agents peaks around a belief of 0, while the numbers of neutral and selfish agents remains constant with some small fluctuations. Also, even in the case of negative be-lief (which should increase the chance of agents taking selfish actions), there are more altruists than egoists. Thus, discouraging altruistic actions does not make selfish actions more likely to emerge. To see why, the mortality rates, reproduction rates and average resources collected were plotted and compared. These results can be found in figures 7-12.
SARSA and Q-learning produce similar graphs in all three cases. As can be seen in figure 7 and 8, altruists reproduce the most, peaking around belief = 0, while the graphs for selfish and neutral agents are similar, but smaller.
Figure 5: Average number of different agents per generation over 1000 sim-ulation versus amount of belief for a group starting with 10 agents over 3 generations using SARSA reinforcement learning.
Figure 6: Average number of different agents per generation over 1000 sim-ulation versus amount of belief for a group starting with 10 agents over 3 generations using Q-learning reinforcement learning.
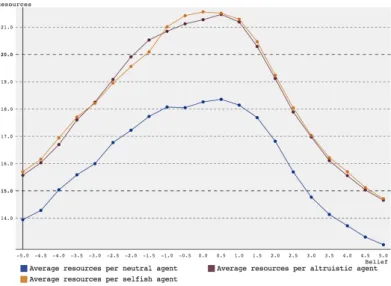
Since reproduction is based on the amount of resources amassed, altruistic agents should have more resources on average than selfish agents. This turns out not to be the case (see figure 9 and 10). In Q-learning, selfish agents even amass more resources than altruists around a belief of 0. This could make sense, if a lot of egoists die before reaching the time of reproduction.
Figure 7: Average reproduction rate per generation over 1000 simulations versus amount of belief for a group starting with 10 agents over 3 generations using SARSA reinforcement learning.
Figure 8: Average reproduction rate per generation over 1000 simulations versus amount of belief for a group starting with 10 agents over 3 generations using Q-learning reinforcement learning.
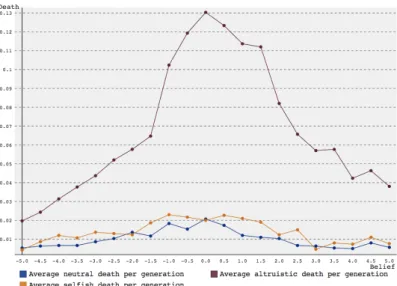
However, as can be seen in figure 11 and 12, more altruists than neutral and selfish agents die. On the other hand, the death rates are quite low in general (with a peak average of 0.13 altruists dying per generations), so this is not influential enough to have a significant effect on group size. Another possible explanation is that there is a certain balance between selfish and
Figure 9: Average number of resources per agent per generation over 1000 simulations versus amount of belief for a group starting with 10 agents over 3 generations using SARSA reinforcement learning.
Figure 10: Average number of resources per agent per generation over 1000 simulations versus amount of belief for a group starting with 10 agents over 3 generations using Q-learning reinforcement learning.
neutral agents, where it pays off to be an egoist because: 1. The group is large enough that social control is marginal;
2. There are enough altruists bringing in resources for leaching to be a viable strategy;
Figure 11: Average mortality rate per generation over 1000 simulations versus amount of belief for a group starting with 10 agents over 3 generations using SARSA reinforcement learning.
Figure 12: Average mortality rate per generation over 1000 simulations versus amount of belief for a group starting with 10 agents over 3 generations using Q-learning reinforcement learning.
3. There aren’t enough egoists to starve the altruists in the group. However, this was not reflected in earlier experiments (see figure 2 and 3). So, both Q-learning and SARSA produce significantly more altruistic than selfish agents, which makes sense as behaving pro-socially increases social
reputation (whereas behaving selfishly decreases it) and may both increase or decrease resources. The spike in altruistic agents around belief of 0 indicates that adjusting rewards based on action selection instead of the consequences of the action does not work well to increase group sizes. This might account for the fact that belief does not seem to have a significant impact on group survival, and as it grows larger even decreases the group’s chances. Rein-forcement learning should work towards building the best strategy for group survival. However, by changing the reward based on a preferred action in-stead of the best action, agents learn a suboptimal strategy.
To test the premise that the current model failed to create higher fitness for higher belief due to reinforcement learning, a basic genetic algorithm was implemented. Initially, the setup of these experiments was close the original version, but policies were randomly initialized to be a number be-tween 0 and 100 instead of learned. The action-selection strategy was still greedy-and belief was modeled as an increase in the Q-value for an altru-istic action and a decrease in the Q-value for a selfish action. These values were static, and therefore did not adapt to the environment. Thus, as values were initialized between 0 and 100, a belief of 10 would increase the chance that an agent was an altruist, but notensure altruism.
To compare the results of the genetic algorithm with reinforcement learning, the average group size, numbers of different types of agents, reproduction and mortality rates and the average amount of resources per type of agent were plotted. These results can be found in figure 15-19.
Although the average group size fluctuates, the graph in figure 15 shows a clear increase in average group size as belief goes up (from 0 to 399), as well as a very large variance. The fluctuation in the graph might be a result of the random initialization.
Figure 16 shows the same trend: group sizes increase as belief increases. At the start, all agents have the same low numbers, but as belief grows, al-truists start to do much better. The fluctuation seen in the previous graph happens here, too, around the same amount of belief.
Figure 17 shows that reproduction rates increase as belief increases, too, which is not unexpected, as the average number of resources per agent in-creases as well (see figure 18). Altruists reproduce the most, because they have the largest average number of resources per agent.
Figure 19 shows that, while mortality rates are quite close together for a belief of -10, as belief increases, so does the difference in mortality rates for altruists and egoists/neutral agents. This is not unexpected, because as be-lief increases, the ratio of altruists compared to egoists increases, ensuring a
Figure 13: Average group size after 10 generations over 1000 simulations versus amount of belief, starting with a group size of 10 using random ini-tialization and asexual reproduction.
Figure 14: Average number of agents per generation over 10 generations and 1000 simulations versus amount of belief, starting with a group size of 10 using random initialization and asexual reproduction.
Figure 15: Average reproduction rate per generation over 10 generations and 1000 simulations versus amount of belief, starting with a group size of 10 using random initialization and asexual reproduction.
Figure 16: Average resources per agent per generation over 10 generations and 1000 simulations versus amount of belief, starting with a group size of 10 using random initialization and asexual reproduction.
Figure 17: Average death rate per generation after 10 generations and 1000 simulations versus amount of belief, starting with a group size of 10 using random initialization and asexual reproduction.
higher chance of survival for all agents in the group, but less so for altruists, because they take the most risk by investing energy in collecting resources.
4
Discussion
In the reinforcement learning model, small levels of belief were not as detri-mental to the group as larger levels. This could be explained as follows: selecting an altruistic action increases social status by 0.5, while resources may change by some number between -1.6 (agent invests 1, eats 1 and re-ceives only 0.4 by only working with egoists) and 0 (agent invests 1, eats 1 and receives 2 by only foraging with altruists). Therefore, the reward is somewhere between -1.1 and 0.5. For selfish actions, social status decreases by 1.0, while resources may change by some number between -1 (agents eats 1 and receives 0 by only working with egoists) and 1.6 (agent eats 1 and receives 1.6 by only working with altruists). Therefore, the reward is somewhere between -2 and 0.6. By increasing the reward with a number much larger than the maximum reward (e.g. 5), the tendency to select one action over the other does not depend on the environment anymore. Thus, while the optimum strategy is to balance the maximization of both social reputation and resources, the introduction of a constant that changes the reward based only on the action chosen and not on the consequences of that action, causes agents to learn a suboptimal strategy for surviving in their environment.
The premise that altruists have a positive and egoists a negative effect on group survival was confirmed, and the hypothesis that the lack of impact of belief was caused by reinforcement learning was confirmed by the genetic model, where belief increased group size, reproduction rate and the number of resources collected. However, there were quite some fluctuations in the graph, possibly because of a quite large factor of randomness.
5
Conclusion
In this research, a multi-agent system was created that modeled religion in hunter-gatherer societies in different ways; different societal compositions in terms of selfish and altruistic agents, using two types of reinforcement learning, and a basic genetic model. Simulations were run to test the ef-fect of religious belief on these societies, where an increase in belief had a detrimental effect on group size when the reinforcement learning model was tested. Because belief was used to adjust an agent’s reward based on what action it selected, agents did not learn the best strategy for their environ-ment, reducing their chances of survival.
A simulation was then run to test the effect selfish agents had on group survival, which showed that as the percentage of selfish agents increases, the group’s chances of survival decreases. Thus, the premise that selfish agents have a negative effect on group size was confirmed. Selfish agents basically ‘steal’ resources from other agents, resulting in more resources per individual if there are no selfish agents. Thus, if there are more selfish agents, the average agent has less resources and will thus reproduce less. Testing the genetic model confirmed that religious belief, if it increases pro-social behavior, has a positive effect on group survival and thus may have had an evolutionary function.
6
Future Work
While the research in this paper has clarified the kind of model that is appropriate for the modeling of the emergence of religion, the genetic im-plementation is very basic, and as such could be improved in multiple ways. Firstly, to account for randomness and increase the accuracy of the results, the simulations should be run more often than 1000 times.
Other options for future work revolve around basing the model more on human beings and thus moving it from a basic simulation to a more life-like emulation. For example, in modern hunter-gatherers, women have children spaced about 4 years apart [10], to reduce the load she has to carry while for-aging. Another suggestion for making the model more life-like is to change
the time of death of the agents to a more complex and realistic one. In the current implementation, agents die at 30, as the average age of mortality for hunter-gatherer ancestors was around 30 [7]. However, this average does not accurately reflect the fact that this number is very low due to high infant mortality; if a forager lived beyond the age of 15, the average age of death was around 60, not 30. A more accurate model would take this into account. A final option for increasing the accuracy of the model is to add certain con-straints that can be observed in nature, i.e. as the population grows, food becomes scarce or predators increase in number [4]. Thus, an addition to the model might be that after a population has grown to N, food becomes scarcer. In that case, selfish behavior might be a better survival strategy, making religious groups less likely to survive than non-religious groups. Furthermore, to form a solid computational model on the evolutionary causes of religion, two other hypotheses should be tested: the cognitive model could model anthropomorphization in religious individuals [1], mean-ing they have a higher likelihood of escapmean-ing predators (while on the other hand, they may invest more resources in rituals), while the ecological model could make less resources available for religious individuals, but decrease their chances of dying from diseases [9]. In addition, the model may be adapted to a version where belief affects only a certain group within the population, thus simulating the fitness of religious individuals versus non-religious individuals, for all three hypotheses.
Lastly, if religion evolved as a form of social control to facilitate the emer-gence of large societies, it would be interesting to research why the rise of atheism [14] and our rapid decrease in privacy due to technological develop-ments coincide. While many factors play a role in the rise of atheism, e.g. the increased availability of scientific knowledge, lack of privacy works like the concept of a panopticon. Since religion is still a mechanism for social control [17], it would be interesting to compare governmental support for re-ligion at the start of the popularity of social media to governmental support for religion in, say, 2020.
References
[1] S. Atran and A. Norenzayan. “Religion’s evolutionary landscape: Coun-terintuition, commitment, compassion, communion”. In: Behavioral
and Brain Sciences27 (2004), pp. 713–770.doi:10.1017/S0140525X04000172. [2] M. Bateson, D. Nettle, and G. Roberts. “Cues of Being Watched
En-hance Cooperation in a Real-world Setting”. In: Biology Letters 2 (2006), pp. 412–414.doi:10.1098/rsbl.2006.0509.
[3] A.L.C. Bazzan, R.H. Bordini, and J.A. Campbell. “Evolution of Agents With Moral Sentiments in an Iterated Prisoner’s Dilemma Exercise”. In: Game theory and decision theory in agent-based systems (2002), pp. 43–64.doi:10.1007/978-1-4615-1107-6_3.
[4] A.A. Berryman. “The Origins and Evolution of Predator-prey The-ory”. In:Ecology (1992), pp. 1530–1535.
[5] R. Dawkins.The Selfish Gene. Oxford, 1976.
[6] J. Dow. “Is Religion an Evolutionary Adaption?” In:Journal of Arti-ficial Societies and Social Simulation 11 (2008).
[7] M. Gurven and H. Kaplan. “Longevity among Hunter-gatherers: a Cross-cultural Examination”. In:Population and Development Review 2 (2007), pp. 321–365.
[8] W.D. Hamilton. “The Genetical Evolution of Social Behavior”. In: Journal of Theoretical Biology7 (1964), pp. 1–16.doi: 10.1016/0022-5193(64)90038-4.
[9] M. Harris.Cows, Pigs, Wars & Witches: The Riddles of Culture. Ran-dom House LLC, 1989.
[10] N.B. Jones. “Bushman Birth Spacing: a Test for Optimal Interbirth Intervals”. In:Ethology and Sociobiology 2 (1986), pp. 91–105. [11] F.W. Marlow. “Hunter-gatherers and Human Evolution”. In:
Evolu-tionary Anthropology: Issues, News and Reviews 2 (2005), pp. 54–67. [12] N. Norenzayan and A.F. Shariff. “The Origin and Evolution of Reli-gious Prosociality”. In:Science 322 (2008), pp. 58–62.doi:10.1126/ science.1158757.
[13] M.A. Nowak and K. Sigmund. “Evolution of Indirect Reciprocity”. In: Nature 437 (2005), pp. 1291–1298.doi:10.1038/nature04131. [14] G. Paul. Is Atheism Increasing at the Expense of Theism? http://
www . scienceandreligiontoday . com / 2012 / 05 / 30 / is atheism -increasing-at-the-expense-of-theism/. [Online; 25th june 2014]. 2012.
[16] “Q-learning”. In:Machine Learning 3-4 (1992), pp. 279–292.
[17] B.H. Raven. “Kurt Lewin Address: Influence, Power, Religion, and the Mechanisms of Social Control”. In:Journal of Social Issues 1 (1999), pp. 161–186.
[18] G.A. Rummery and M. Niranjan. “On-line Q-learning using Connec-tionist Systems”. In: (1994).
[19] A.F. Shariff and A. Norenzayan. “God is Watching You: Priming God Concepts Increases Prosocial Behavior in an Anonymous Economic Game”. In: Psychological Science 18 (2007), pp. 803–809. doi: 10 . 1111/j.1467-9280.2007.01983.x.
[20] R. Sosis. “The Adaptive Value of Religious Ritual”. In:American Sci-entist 92.2 (2004), pp. 166–172.
[21] R.S. Sutton and A.G. Barto. Reinforcement Learning: An Introduc-tion. Cambridge, 1998.
[22] M. Tomasello and A. Vaish. “Origins of Human Cooperation and Morality”. In: Annual review of psychology 64 (2013), pp. 231–255.
doi:10.1146/annurev-psych-113011-143812.
[23] M.A. Upal. “Simulating the Emergence of New Religious Movements”. In:Journal of Artificial Societies and Social Simulation 8 (2005).