SEVERE STORMS
IN THE MIDWEST
Stanley A. Changnon
Kenneth E. Kunkel
Informational/Education Material 2006-06 Illinois State Water Survey
SEVERE STORMS IN THE MIDWEST
By
Stanley A. Changnon and Kenneth E. Kunkel
Midwestern Regional Climate Center Illinois State Water Survey Champaign, IL
TABLE OF CONTENTS
Abstract ... v
Chapter 1. Introduction ... 1
Chapter 2. Thunderstorms and Lightning ... 7
Introduction ... 7
Causes ... 8
Temporal and Spatial Distributions ... 12
Impacts ... 13 Lightning... 14 References ... 18 Chapter 3. Hail. ... 19 Introduction ... 19 Causes ... 19
Temporal and Spatial Distributions ... 19
Impacts ... 23
References ... 24
Chapter 4. Tornadoes and High Wind ... 26
Introduction ... 26
Causes ... 27
Temporal and Spatial Distributions ... 28
Impacts ... 31
References ... 32
Chapter 5. Heavy Rainfall ... 33
Introduction ... 33
Causes ... 33
Temporal and Spatial Distributions ... 34
Impacts ... 40
References ... 42
Chapter 6. Snowstorms ... 44
Introduction ... 44
Causes ... 44
Temporal and Spatial Distributions ... 44
Impacts ... 48
Chapter 7. Freezing Rain and Sleet ... 51
Introduction ... 51
Causes ... 51
Temporal and Spatial Distributions ... 52
Impacts ... 55
References ... 57
Chapter 8. Major Midwestern Storms ... 59
Tornadoes ... 59 Hailstorms ... 61 Rainstorms ... 62 Winter Storms ... 65 Windstorms ... 68 Thunderstorms ... 68 References ... 72 Chapter 9. Summary ... 73 Acknowledgments ... 74
ABSTRACT
The Midwest experiences a wide variety of severe storms in all seasons, a result of frequent passages of different air masses and unstable atmospheric conditions. Warmer months have thunder-storms, lightning, hail, heavy rains, tornadoes, and high winds, all deadly and often quite damag-ing to the environment, crops, and property. The cold season has snowstorms, ice storms, high winds, and sleet storms, also deadly and damaging to the environment, property, and transportation.
The goal of this report is to present information on all important storm types. For each form of severe weather, this includes: 1) descriptions of the atmospheric conditions that cause the storms; 2) information about time and space distributions in the Midwest; and 3) impacts data.
Thunderstorms are most frequent in the southern Midwest, occurring on average, on 55 days a year as compared to only 25 days in the extreme northern parts of Minnesota and Michigan. The annual average loss of life due to lightning in the Midwest is 81 persons, with flash floods causing 45 fatalities, and tornadoes averaging 21 deaths per year. Thunderstorms and their products (hail, tornadoes, heavy rains, lightning) cause an average loss in the Midwest of $2.807 billion per year, but thunderstorms also help the Midwest by providing between 40 percent (northern Midwest) to 60 percent (southern sections) of the total annual precipitation.
Severe snowstorms occur most often, 4 to 8 per year, in the Michigan-Minnesota area, with less than one storm per year in the southern Midwest each year. Ice storms are most frequent, averaging 4 to 5 days per year, in the central and northwestern Midwest with less than 2 ice storm days in the southern areas. The annual average deaths caused by winter storms is 43, and winter storms produce an average of $318 million in losses each year.
The frequency of Midwestern severe storms since 1950 exhibits different distributions. The number of damaging thunderstorms, heavy rain events, and snowstorms show temporal increases with a peak in activity since 1990. In contrast, hailstorms, tornadoes, and ice storm frequencies have decreased over time. The Great Lakes and the Midwest’s large cities (Chicago, St. Louis, and Cleveland) affect the incidence of severe weather. The Great Lakes lead to more thunder-storms, more snowthunder-storms, and record high hail incidences in the fall. The effect of the region’s large cities on the atmosphere has led to increases in thunderstorms and hail in and immediately downwind of the cities, but has also led to fewer snowstorms and ice storms within the cities.
The Midwest has experienced extremely damaging storms, each causing more than a billion dollars in losses and often many lives. The nation’s most deadly tornado in March 1925 occurred in the Midwest with 695 lives lost. The nation’s most damaging hailstorm, causing losses of $1.5 billion, occurred in the Midwest in April 2001, and the region had the nation’s worst floods in 1993 causing $25 billion in losses.
Chapter 1. Introduction
The Midwest, defined here as a 9-state region (IL, IN, IA, KY, MI, MN, MO, OH, and WI), has a continental location far from any oceans, and hence, wide extremes of both temperature and precipitation occur over days, weeks, months, and years. Summers are traditionally hot and humid, and winters are cold and often snowy. Many people consider the more moderate tempera-tures of the transition seasons, spring and fall, to be the most pleasant. Some potentially danger-ous storms occur in every season, and severe storms are an integral part of the climate of the Midwest. Winter can bring huge snowstorms, damaging ice storms, or both. Warmer months, typically March-October, have convective storms, including thunderstorms and lightning, flood-producing rainstorms, hail, and deadly tornadoes. All seasons experience damaging high winds.
This report focuses on various forms of severe stormsthat occur in the Midwest. Severe storms are defined here as precipitation-producing systems that cause human death or injury and damage to property, crops, and the environment. Severe storms are critically important because they affect the region’s economy, environment, and human health. Climate data collected across Midwest since late in the 19th Century provide sufficient information to describe many aspects of the storm climate of the past 50-100 years, its variability over time and space, and its extremes.
Photo 1-1. A young farm girl in Iowa examines wheat destroyed by a hailstorm.
Major business activities in the Midwest are highly climate sensitive. Agricultural yields, whether good or poor, are determined almost totally by climate conditions. Hail, heavy rains, and high winds can decide the fate of the Midwest’s crops. The Midwest also serves as the nation’s center for air and surface transportation, and weather extremes influence each form of transporta-tion—commercial airlines, barges, trains, and trucks. Severe weather causes shipment delays, a major problem for manufacturers, and storms can bring large changes in profits of many businesses.
Severe storms have impacts on human health and safety, including 190 deaths due to torna-does, lightning, winter storms, and floods, on average each year. Property losses caused by severe storms in the Midwest average $2.462 billion per year. All dollar loss values presented herein are dollar values adjusted to 2000 unless noted otherwise. The National Weather Service has several brochures available about how to be safe during different types of severe weather and storms (http:www.crh.noaa.gov/ilx/wxsafety.php).
The climate also shapes key environmental conditions. Record floods in 1993 breached many levees and renewed the growth of natural plants in floodplains. Various storm conditions such as freezing rain and hail are detrimental to growth of all plants in natural, residential, and commercial landscapes.
The region’s unique mix of societal and economic conditions makes the Midwest very vulnerable to severe weather with the potential to produce extremely large losses. For example, because Illinois is the core of the nation’s transportation systems, severe weather, including floods and winter storms, can stop or slow various forms of transportation for days or weeks.
Flood losses in the Midwest, the highest in the nation, have averaged $1.477 billion annu-ally since 1983, and have been increasing at a greater rate than elsewhere in the nation. Flooding is the single, most damaging weather hazard, but losses due to hail, tornadoes, and winter storms
Photo 1-2. Heavy rains produced this flooding that destroyed a rural bridge, and a tornado did major damages to the nearby farm and its trees.
also rank high nationally. Interestingly, benefits come from certain types of storms. For example, thunderstorm rainfall produces 40 percent of the total annual precipitation in northern parts of the Midwest and as much as 60 percent of the total in the southern sections.
The contents of this report should be of use and benefit to the many interests identified above and to those who must make decisions related to storm conditions. This document was designed to serve a diverse audience. Hence, all measures are in English units.
The goal of this report is to present information on all important storm types. For each form of severe weather, this includes: 1) descriptions of the atmospheric conditions that cause the storms; 2) information about time and space distributions in the Midwest; and 3) impacts data. The following chapters describe each of the six major types of severe weather: thunderstorms and lightning, hail, tornadoes, heavy rain, snowstorms, and freezing rain and sleet storms. The final chapter describes exceptionally severe storm events that have occurred in the Midwest.
Long-term data collection in Illinois by the U.S. Weather Bureau has not necessarily been more extensive in the Midwest than in adjacent areas. However, the Illinois State Water Survey (ISWS) has performed major studies of severe weather since the 1950s, helping to provide a wealth of information about Midwestern storms. The ISWS is Home of the Midwestern Regional Climate Center (MRCC), which provides regional data and information on climate.
Theaverage climate of the Midwest depends upon five climatic controls: 1) latitude and solar input, 2) typical positions and movements of weather systems, 3) topography, 4) the Great Lakes, and 5) human-induced effects. The two major influences are the latitude (reflecting the
amount of solar input) and weather systems (air masses and cyclonic storms). Topography, the Great Lakes, and cultural effects are of lesser significance because they influence local climate, not that of the entire region.
The sun, the primary source of energy for virtually all weather phenomena, in large part determines temperatures and seasonal variations. At the region’s mid-latitude location, solar energy input is three or four times greater in early summer than in early winter, which results in warm summers and cold winters when combined with the region’s inland location. The position of the earth in relation to the sun basically determines the duration and amount of solar heating, although cloud cover is an important factor affecting the energy received. The 13-degree differ-ence in latitude between the northern and southern boundaries of the Midwest is reflected in the great range of temperatures. Latitudinal temperature differences in summer when the sun is more directly overhead in the Northern Hemisphere are much less than those in winter. Latitudinal temperature differences across the Midwest are realized in numerous important ways, such as the longer summer storm season in the southern section and more winter storms further north.
Land masses respond much more quickly to changes in solar input than do large water bodies, such as oceans. Therefore, seasonal air temperature changes tend to be larger in the interiors of continents than at coastal locations. Thus, the region’s location in the interior of the North American continent contributes to large seasonal air temperature changes.
The second major factor affecting the region’s stormy conditions is the large-scale general circulation of the atmosphere, which affects typical positions and movements of weather systems. The large-scale circulation is largely determined by the north-south differences in solar heating, the positions of continents, oceans, and major mountain ranges, the sea surface temperature patterns of the oceans, and the influence of the rotating earth. This major feature creates the wide variety of weather conditions that occur almost daily as a result of varying air masses and passing storm systems. The polar jet stream, often located near or over the Midwest, is the focal point for genesis and development of low-pressure storm systems characterized by cloudy skies, windy conditions, precipitation, and storms. Settled weather associated with high-pressure systems generally ends every few days with passage of low-pressure systems that typically bring storms.
These low-pressure systems, which usually originate to the west or southwest, are the primary cause of the Midwest’s severe storms. Although some systems can be traced back to the Pacific Ocean, they lose most of their Pacific moisture in passage across the mountains of west-ern North America. By the time systems reach the Midwest, however, the counterclockwise atmospheric circulation accompanying these systems often results in the advection of moisture from the Gulf of Mexico and the Atlantic Ocean. Although some moisture from the Pacific
Photo 1-5. A squall line forms an elongated echo across the screen of a weather radar. The circles are ranges at 20-mile intervals.
reaches the region, the Gulf of Mexico and the Atlantic Ocean are the primary sources of mois-ture for storm-producing systems. Rapid and marked changes in the weather are common during all four seasons. These highly varying air masses and the cyclonic storms between them reflect the location of the Midwest between major sources of warm, moist air to the south and cold, dry air to the north and west.
Another important feature of the general atmospheric circulation is a semipermanent high-pressure system in the sub-tropical Atlantic, which is most intense during summertime and is known as the Bermuda High. The clockwise circulation of air associated with this high-pressure system affects the climate of much of the eastern United States and southern Canada because it transports large amounts of moisture to the Midwest from the Gulf of Mexico and the Atlantic Ocean. This causes a relatively high frequency of warm humid days during summer, particularly over southern portions of the United States. These conditions help generate convective storms.
In winter, air masses originating in the Pacific Ocean dominate the winter weather more than 65 percent of the time. These air masses lose much of their moisture over the Rocky Moun-tains and often produce cool, cloudy weather over the Midwest during the winter.
In summer, hot, humid air masses from the Gulf of Mexico affect the Midwest about 40 percent of the time. Exceptionally high temperatures, often in excess of 90°F, and very high humidities, often leading to thunderstorms, are common with this type of air mass.
Spring and fall are periods of climatic transition. These typically have complex weather patterns, with contrasting air masses that induce highly variable conditions and numerous con-vective storms. Their frontal systems move rapidly and often produce extensive cloud cover, thunderstorms, and sometimes snowstorms.
Low-pressure systems that originate in western North America cross the continent along various storm tracks. As these storms move, they often swing to the northeast, crossing the Midwest. Most cyclonic storms come either from the Alberta region or the central Rocky Moun-tains, but in summer, roughly 25 percent of the region’s storms develop over the Midwest. Winter storms often intensify as they move over the Midwest.
Three other climatic controls all have localized effects in parts of the Midwest. These include the Great Lakes, topographic effects of the hill regions in various Midwestern areas, and cultural effects resulting from human influences on the atmosphere and, in turn, on storm activity. Each chapter that follows defines how these localized effects alter storm activity and intensities.
Chapter 2. Thunderstorms and Lightning
Introduction
No other atmospheric event carries with it the beauty, fear, and importance of thunder-storms. These complex natural systems convert moisture and thermal energy into rainfall, light-ning, wind, and other severe weather phenomena. This chapter first answers a key question about thunderstorms: what are they?
Most simply, thunderstorms are very large clouds that produce lightning: an electrical discharge between the cloud and the ground, in the cloud, or between clouds. These discharges heat adjacent gases in the air rapidly to 10,000oF, which creates a shock wave we label as thun-der. As long as a cloud produces lightning and thunder, it is defined as a thunderstorm. These storms have life cycles that can vary from 30 minutes up to 6 hours.
Sometimes a thunderstorm is called an electrical storm. The visible form of a thunderstorm is a cumulonimbus, the tallest of all clouds. A thunderstorm results from instability in the atmo-sphere when the surface air is very warm compared to the air aloft. The buoyant surface air accelerates rapidly upward. This strong convective updraft is a major feature of the storm in its formative and mature stages. Moisture in the form of ice crystals rising from the top of a storm forms a distinctive anvil, often called a thunderhead. The storm’s descending precipitation shaft brings down a strong downdraft of cool air from aloft, often marking the storm’s dissipation stage. These downdrafts spread along the earth’s surface, bringing a wind shift before the storm
Photo 2-1. A tall thunderstorm cloud with a major anvil extending outwards from its top moves east across the Midwest.
arrives. In some cases, the rapidly spreading air produces strong surface winds called a gust front. Storms typically grow tall with tops 8-10 miles above the earth’s surface. Even taller storms, becoming 10-13 miles tall, typically create severe weather, including hail, high winds, and tornadoes (Changnon, 2001c).
A developing thunderstorm ultimately generates lightning as a result of internal charge separation, a complex electrification process within the cloud that creates strong electrical fields within the storm. In-cloud particles of water and ice crystals rapidly develop opposing electrical charges as a result of collisions. Larger particles, often negatively charged, tend to fall, whereas smaller ones, often positively charged ice crystals, are carried aloft in the storm’s updraft. This creates an up-and-down vertical electric field that results in lightning. Thus, the storm’s electrification has occurred (Byers and Braham, 1950). Lighting is more fully described later in this chapter.
Causes
Individual thunderstorms can form and remain alone for their entire life cycle. Many thun-derstorms, however, are part of a group of storms moving across the landscape. These can be in a long line, commonly known as squall lines, that may extend from 50 up to 400 miles. Or, they can be in mesoscale convective complexes (MCCs). These are large, semi-circular groups of many storms that can be up to 500 miles across and move together in coherent fashion (Cotton, 1999). Thunderstorms are key elements of the world’s climate.
Thunderstorms begin as rising air resulting from atmospheric conditions characterized by convective instability. Strong convective air motions, the key feature of Midwestern storm development, result from a variety of atmospheric conditions. These include:
• Various types of fronts (cold, warm, and stationary) that separate air masses
• Gust fronts from existing storms as their downdraft hits the surface, spreads, and lifts the air in front of them
• Upper air disturbances
• Heating of the surface by solar radiation creating an unstable vertical temperature profile Convergence of air near the surface, divergence of air aloft, or both, often help generate vertical motions sufficient to cause the formation of cumulus congestus clouds. These clouds are often precursors to development of a cumulonimbus, and in turn, a thunderstorm (Battan, 1964).
In some circumstances, changes in thunderstorm activity occur across short distances of 10 to 100 miles. These changes are due to localized sources that heat or cool the atmosphere or add moisture, and to mechanical obstructions to low-level air flow. Causes of these atmospheric influences include relatively large surface elevation changes, large water bodies such as the Great Lakes, and large urban areas.
Air near the surface and over elevated upland areas is heated during the day by contact with the solar-heated ground surface. This air becomes warmer than (buoyant with respect to) the
43 35 30 30 35 35 35 35 30 25 25 30 35 40 45 47 50 25 25 20 20 55 55 50 47 45 40 40
L
H
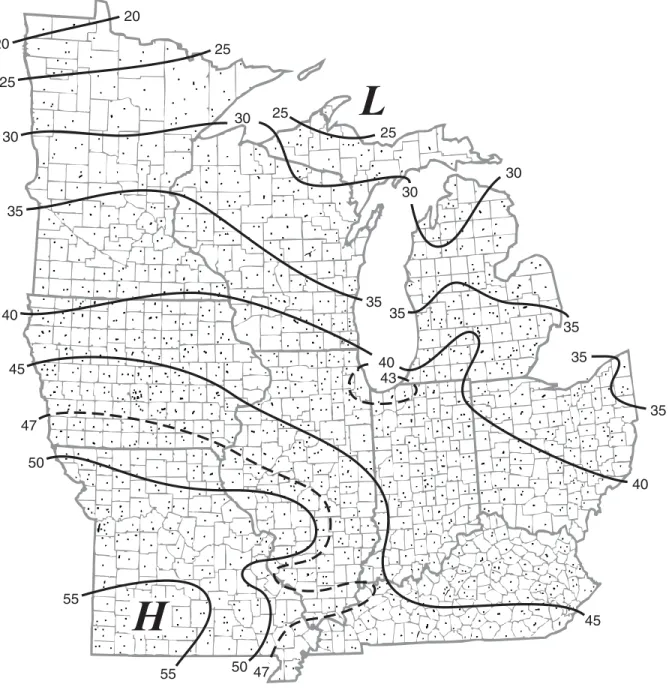
surrounding free atmosphere at the same altitude over nearby lowland areas where the heating occurs lower in the atmosphere, creating local instability. Heating is enhanced at higher altitudes on sun-facing hillsides, and the additional heating causes an upslope flow of air. When the prevailing flow has a similar horizontal directional component, it can combine with the upslope circulation (Court and Griffiths, 1981). This advects moisture into higher elevations where it is triggered by the terrain to form convection and launch cumulus clouds, often over the hills. For example, the Ozark Hills of southern Missouri and Illinois enhance thunderstorm activity (Huff et al., 1975). As shown in Figure 2-1, 55 or more days with storms occur annually in southwest-ern Missouri and 47 or more days with storms in the hills of southsouthwest-ern Illinois, reflecting local topographic effects.
The Great Lakes influence thunderstorms over them and downwind, particularly in summer and fall. In the fall, these large water bodies serve as a moisture source for many passing air masses, adding to the moisture available to support cloud and storm development. However, in the summer, lake water temperatures are often much lower than those of passing air masses. This acts to stabilize the lower atmosphere and reduce thunderstorm development or to minimize storm activity in passing storm systems and downwind of the lakes. Figure 2-1 shows effects of the lakes on thunderstorm frequencies. The lower peninsula of Michigan has shifts in the loca-tions of the 30- and 40-isolines, both reflecting lake effects on storms.
Major urban areas produce sizable effects on the atmosphere. Under certain circumstances, these effects are sufficient to create thunderstorms and increase their associated rainfall
(Changnon, 1978). Large urban areas, primarily by influencing the low-level air flow over them, create convergence zones that either initiate or enhance existing convective storms. The urban heat island, plus structural barriers and urban surface roughness that alters frictional drag, collec-tively create both thermal instability and mechanical turbulence. Thunderstorm activity at several Midwestern cities has been assessed and, in most cases, reveals enhanced storm activity at cities with populations greater than one million. For example, climatological studies of the historical weather records in and around the Chicago metropolitan area discerned 10-20 percent increases in thunderstorm frequencies in and just east of the city. Storm isolines of average storm frequen-cies are shifted eastward at Chicago and St. Louis. Increased lightning occurs downwind of Midwestern urban areas (Westcott, 1995), and increased hail and rain occur at major Midwestern urban areas (Huff and Changnon, 1973).
Factors causing thunderstorms lead to different types of storms classified in a variety of ways including by their structure, their causes, and the degree of their organization within the atmosphere (Barnes and Newton, 1981). There are three storm types, based on the internal structure of a storm. A simple single cell storm reflects a single updraft and downdraft. Such isolated storms usually result from local heating and often last less than an hour. A multi-cell storm consists of several updrafts and downdrafts during the storm’s mature stage and has more than one precipitation shaft, or cells. The new cells tend to develop on the storm’s right flank where warm moist air is most often available. These more vigorous storms typically last 1-2 hours. A supercell thunderstorm, a long-lasting and quite large storm, evolves from a special set of conditions that include very unstable conditions, continual flow of moisture at low levels, a strong jet stream aloft, and a change in wind direction from low to upper levels (typically southerly
flow at low levels changing to westerly flow at upper levels). Strong updrafts that develop in the very unstable atmosphere lift and bring the southerly flow into contact with the strong westerly flow aloft. Interactions of these air streams create one of the signature characteristics of the supercell: rotation. The supercell has a single, quasi-steady rotating updraft. Conditions condu-cive to supercell development invariably are associated with a strong cold front. Supercell storms can last from 4-6 hours, and typically produce damaging winds, severe hail, and/or tornadoes.
Significant convective thunderstorms occur as a result of certain favorable thermal and dynamic influences related to local mesoscale and larger scale synoptic circulation patterns. Hence, other storm classifications have centered around the synoptic weather conditions associ-ated with thunderstorms and their development. One such class is caused by large-scale weather disturbances that include fronts and low pressure centers. One version of this class is elevated thunderstorms, and occur northeast of a surface low-pressure center and north of a warm front. These differ from most storms rooted in near surface atmospheric conditions. The initial uplift to trigger these thunderstorms occurs along a sloped, elevated boundary between cold air below and warm air above that is forced up the slope. If the storms are generated repeatedly in about the same location, and then move away and follow the same track as previous storms, they can create heavy rains of 10-20 inches in 12-24 hours, causing massive regional flooding. These systems often develop along a stationary front.
Another class of storms, air massthunderstorms, results from localized surface heating of moist, potentially unstable air masses. These thermodynamic processes affect the atmosphere’s stability sufficiently to create storms that develop randomly, can occur anywhere, tend to be isolated, and are most common during the summer. Such storms usually tend to be self-limiting and relatively weak, but occasionally they become severe storms.
A third class of storms is a result of convection organized at the mesoscale, on the order of 50 to a few hundred miles. A mesoscale convective system (MCS) is a self-organizing area of convection that lasts for many hours and typically occurs during the warm season in the Great Plains. It occurs when there is a dynamic mechanism to maintain convection, and an MCS is capable of causing a wide variety of severe weather (Fritsch et al., 1986; Anderson and Arritt, 1998). Many of these form in the afternoon east of the Rocky Mountains and High Plains and move into the Midwest. A low-level southerly nocturnal jet is a common MCS feature, providing low-level convergence, an abundant supply of moisture from the Gulf of Mexico, and maintain-ing convection through the nighttime hours. Several special MCS forms are worthy of note. The mesoscale convective complex (MCC), a particular type of large and long-lived MCS, has a lifetime of at least 16 hours (Maddox, 1983). Squall lines are linearly organized mesoscale areas of very strong convection, often creating severe weather. Bow echoes are bow-shaped areas of convection noted for producing long swaths of damaging winds. Derechoes are bow echoes or sequences of bow echoes that produce winds in excess of 58 mph and damage over areas in excess of 250 miles in length (Johns and Hirt, 1987; Ashley and Mote, 2005).
A fourth class of storms is related to convergence zones caused by various conditions, including dynamic processes such as lake breezes. Other zones are created mechanically by airflow deflected around large urban areas. Mountain-flatland air mass differences create
storm-forming convergence zones. Differences between conditions over large lakes and those of pass-ing air masses, in both temperature and moisture content, can create or diminish thunderstorms. Temporal and Spatial Distributions
Thunderstorms occur in all parts of the Midwest. Storm frequencies are higher to the south where warmer temperatures, a longer warm season, and closer proximity to the Gulf of Mexico moisture source lead to more frequent conditions of atmospheric instability. Storm frequencies are also higher in regions where cyclonic activity is more frequent, and where topography, such as that of Missouri, southern Illinois, and Kentucky, accentuates uplift (Figure 2-1). The number of thunderstorms varies across the region and peaks along the southern border of Missouri. The annual maximum, 55 days with storms, occurs in the hills of southwestern Missouri. Storm activity is least, less than 20 days annually, along the northern region’s border.
The Great Lakes and the region’s largest cities also affect thunderstorm frequencies. Studies have shown that the effects of Chicago, Cleveland, and St. Louis on the atmosphere lead to more summer thunderstorms. The St. Louis summer average pattern (Figure 2-2) shows 16-20 storm days in surrounding rural areas, whereas 25 days or more of thunderstorms occur over and downwind of the city. The Great Lakes also influence thunderstorm activity (Changnon, 1966). Relatively cool lake waters in the summer lead to 10-20 percent decreases in thunderstorms over and downwind of the lakes. When lake waters are warmer than passing air masses in the fall,
Figure 2-2. Summer average number of thunderstorms in the St. Louis area, 1971-1975 (Changnon, 1978). Diagonal lines represent the older urban areas and dash-dot lines
outline the boundary of the built-up metropolitan area as of 1970.
0 8 16 10 5 0 Kilometers Miles 16 17 17 18 18 19 20 22 24 25 26 27 28 29 22 20 18 17 16 15 15 17 16 19 18 25 24 22 20 19 26 27 28
H
L
L
L
Airporthowever, the lakes act to increase storm activity. For example, the fall average pattern reveals an increase of 25 percent in storms just east of Lake Michigan. The net effect is a slight increase in storm activity revealed by the positions of the 30- and 40-isolines on Figure 2-1.
A typical thunderstorm has a path 5-10 miles wide, 20-50 miles long, and lasts 1-2 hours. Average point durations of thunderstorms vary from 15 minutes to more than 120 minutes. Durations of thunderstorm events reveal major night and day differences. Daytime storms are on average shorter in duration than night storms in all parts of the region, due to the occurrence of long-lived mesoscale convective systems at night. Although thunderstorms in the Midwest can occur in all months, they are most frequent in summer.
Figure 2-3 shows the temporal distribution of major damaging thunderstorm events and their associated losses in the Midwest during 1949-2003. Both distributions exhibit relatively low values during the early period (1949-1973), followed by an upward trend over time to peaks in 1994-1998. The graph illustrates that losses grew as the number of damaging events increased over time.
Impacts
Thunderstorms both help and harm society and the environment, and also are one of the most damaging of all weather phenomena. Since 1950, U.S. thunderstorms have created enor-mous damages: $87 billion in property losses, $19 billion in crop losses, and more than 12,000 fatalities (Changnon, 2001a). Lightning-induced forest fires are common. Lightning kills on average 144 persons yearly, one of the major weather-related killers in the nation, and second only to heat waves. Lightning is very damaging to power systems. Thunderstorms also produce
0 5 10 15 20 25 30 35 40 45 Number of Ev ents 1949-53 54-58 59-63 64-68 69-73 74-78 79-83 84-88 89-93 94-98 1999-03 Year 0 0.5 1.5 1.0 2.0 2.5 3.0
Losses in Billions of Dollars
Number of Events
Losses in Billions of Dollars
Thunderstorms
Figure 2-3. Temporal distribution of thunderstorm events in the Midwest creating more than $1 million in property losses, 1949-2003. The dashed line represents the number of events per 5-year period, and the
hail, heavy rains, and high winds. Hail damages both crops and property, and hail damages in the Midwest exceed those in any other region of the nation. Storm-generated heavy rains can produce devastating flash floods. For example, a series of thunderstorms on the night of July 17-18, 1996, combined to produce more than 17 inches of rain in the Chicago suburbs, and flood losses of $0.8 billion (Changnon, 1999). The high rainfall rates produced by thunderstorms are a major cause of soil erosion. The high winds generated by thunderstorm downdrafts cause extensive property and crop damages over hundreds of square miles. Some thunderstorms also spawn tornadoes that result in human deaths and property destruction.
In many areas, recent large increases in storm losses have produced major impacts on the insurance industry, government, and the public. Studies have found the primary cause to be the ever-increasing vulnerability of society to major storms. This is a result of growth in population and wealth, plus demographic shifts to more storm-prone areas. Thunderstorm catastrophes, events causing $1 million or more in losses in the U.S., are common in the Midwest with 93 catastrophes since 1949. From 1949 to 1998 the Midwest had $25.4 billion in catastrophe losses, an annual average of $508 million (Changnon, 2001a). The Midwest total is $52.6 million per year.
Society and the environment also benefit from thunderstorms which provide substantial precipitation and various other environmental benefits. Thunderstorms are the prime producer of precipitation in many parts of the Midwest (Changnon, 2001b). Rainfall from thunderstorms is critical for crop production and water supplies throughout the Midwest, and thunderstorm pre-cipitation contributes 40-60 percent of the area’s streamflow. Assessment of conditions during drought years reveals that a major cause for a deficiency in precipitation is the lack of thunder-storm rainfall. Thunderthunder-storms produce 60 percent of the average annual precipitation in the southern Midwest, diminishing to 40 percent of the total in northern Minnesota.
Lightning has positive and negative impacts, as described in the next section. Thunder-storms also act to mix the atmosphere due to their enormous size and strong internal vertical movement of air. These motions greatly affect the chemistry of the atmosphere. Air near the surface that is swept into the huge updrafts helping to create thunderstorms carries atmospheric pollutants up to the stratosphere. In turn, thunderstorm precipitation and downdrafts generated by rain shafts scavenge pollutants and bring them to earth. Thunderstorm precipitation serves as a major scavenger of pollutants in the atmosphere.
Lightning
Lightning is one of nature’s most spectacular and beautiful phenomena, and one of the most deadly and damaging weather conditions. Yet, lightning is also an essential feature in maintaining the electrical balance between the earth and atmosphere.
Most lightning results from major differences in the electrical charge of the atmosphere and that of the earth. The earth generally has a positive electrical charge, and the atmosphere has a negative charge. These differences constantly must be relieved by an exchange of charges, which creates cloud-to-ground lightning, the electrical discharge between these two opposites. These forces are so great that the earth daily experiences one million lightning discharges from 50,000
thunderstorms. An important effect of the worldwide lightning activity is the net transfer of negative charge from the atmosphere to the earth (Battan, 1964).
Each lightning bolt carries an electrical charge of about 30 million volts. The lightning charge seeks the path of least resistance for its channel to earth, resulting in a path that is often quite crooked with several forks. This pathway to the surface often is to a local high point, and often produces strikes on tall buildings, rural barns, and trees. Essential components of a cloud-to-ground lightning stroke are its positive and negative leaders. When the cloud-generated leader reaches the ground, a return stroke comes from the earth. About 20 percent of all lightning strokes are between clouds, and the rest are cloud-to-ground strokes.
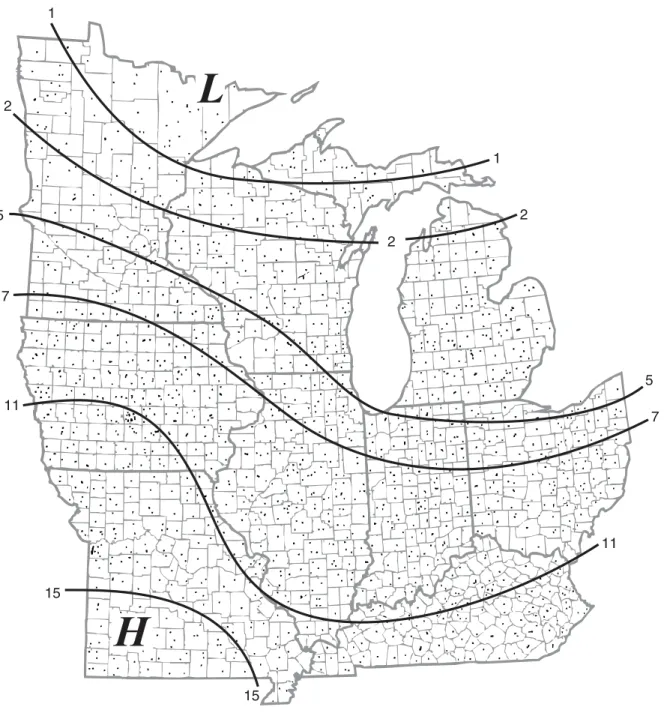
Figure 2-4 shows the annual average number of lightning flashes over a square mile in the Midwest. Flashes (strokes) vary from 15 per square mile in southern Missouri to less than one flash per year in northern Minnesota and Upper Michigan.
Lightning is dangerous, injuring and killing humans and farm animals. It annually kills an average of 81 people in the Midwest, more deaths than from any other form of severe storms, including tornadoes and floods. Lightning also injures an average of 158 persons each year and kills many farm animals in the Midwest.
Lightning causes a variety of damages, including forest fires and fires in buildings. It also causes local and large-scale outages in a power grid, damages communication systems, and damages electrical systems inside structures, including computers.
1 1 2 2 5 7 2 11 15 5 7 11 15
H
L
Figure 2-4. Annual average number of cloud-to-ground lightning flashes per square mile, 1986-2000 (Changnon, 2001c).
Lightning also produces benefits. As noted above, it is an essential element in maintaining the earth-atmosphere electrical balance. Lightning also converts gaseous nitrogen in the atmo-sphere into nitrogen compounds that, in turn, rainfall absorbs and deposits on the ground. This nitrogen serves as a fertilizer for Midwestern soils. Lightning also played a positive role in the history of the Midwest and is the reason that outstanding soils developed from a tall grass prairie for 10,000 years. Lightning-ignited fires in the region often caused huge fires that destroyed trees but enhanced the growth of prairie grasses that once existed over most of the Midwest
(Changnon et al., 2003).
Only three percent of all thunderstorms in the Midwest produce damaging lightning, most commonly in June-August when 80 percent of all such events occur. Damaging lightning occurs most often between 1 and 4 p.m. and is least prevalent between 10 p.m. and 9 a.m. Most dam-ages in rural areas occur to farm buildings, 82 percent of all lightning damdam-ages, and rural schools and churches, 9 percent. In cities with a 100,000 population or more, 40 percent of all damages occur to residences, 23 percent to commercial structures, and 22 percent to industrial buildings/ facilities. The distribution of damaging lightning events is uneven across the Midwest. Areas around major urban centers have the most damages, partly a result of high population density and added storms generated by the effect of urban areas on the atmosphere.
Financial losses resulting from lightning are enormous. Fires to Midwestern forests and uninsured property account for up to $30 million in losses annually. Costs to repair power and communication system damages amount to up to $65 million annually. Damage to in-house electrical fixtures such as computers totals about $20 million a year. Insurance payments for damages to property from lightning total another $365 million a year in the Midwest.
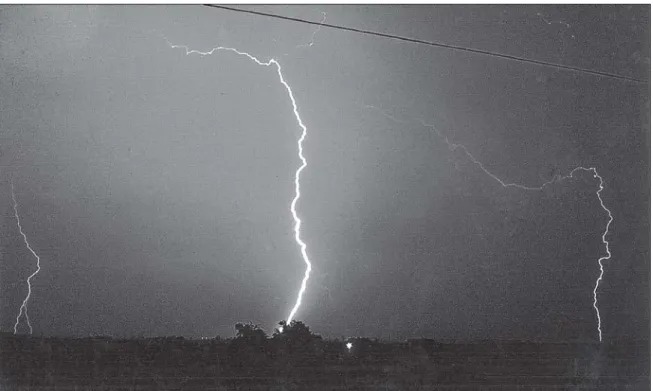
Photo 2-3. A crooked lightning stroke with many branches going to the ground and to other clouds.
References
Anderson, C.J., and R.W. Arritt. 1998. Mesoscale convective complexes and persistent elongated convective systems over the United States during 1992 and 1993. Monthly Weather Review,
126: 578-599.
Ashley, W.S., and T.L. Mote. 2005. Derecho hazards in the U.S. Bulletin American Meteorologi-cal Society, 86, 1577-1592.
Barnes, S.L. and C. W. Newton. 1981. Thunderstorms in the Synoptic Setting. Environmental Research Laboratory, Washington, DC, pp.75-113.
Battan, L.J. 1964. The Thunderstorm. Signal Science Library, New York, pp.12-38.
Byers, H.R., and R.R. Braham. 1950. The Thunderstorm. U.S. Weather Bureau, Washington, DC. Changnon, S.A. 1966. Effect of Lake Michigan on Severe Weather. Great Lakes Research
Divi-sion Publication 15, University of Michigan, Ann Arbor, pp. 220-234.
Changnon, S.A. 1978. Urban effects on severe local storms. Journal Applied Meteorology, 17: 578-586.
Changnon, S.A.1999. Record flood-producing rainstorms of 17-18 July 1996 in the Chicago metropolitan area. Part III: Impacts and responses to the flash flooding. Journal Applied Meteorology, 38: 273-280.
Changnon, S.A. 2001a. Damaging thunderstorm activity in the United States. Bulletin American Meteorological Society,82: 597-608.
Changnon, S.A. 2001b. Thunderstorm rainfall in the contiguous United States. Bulletin American Meteorological Society, 82: 1925-1940.
Changnon, S.A. 2001c. Thunderstorms across the Nation. Changnon Climatologist, Mahomet, IL. Changnon, S.A., Kunkel, K.E., and D. Winstanley. 2003. Climate factors that caused the unique
tall grass prairie in the central U.S. Physical Geography, 23: 259-280.
Cotton, W.R. 1999. An Overview of Mesoscale Convective Systems. Routledge Press, London, pp.3-25.
Court, A., and J. F. Griffiths. 1981. Thunderstorm Climatology. Oklahoma, Norman, OK, pp9-39. Fritsch, J.M., Kane, R.J., and C.R. Chelius. 1986. The contribution of mesoscale convective
weather systems to warm-season precipitation in the U.S. Journal Applied Meteorology, 25: 1333-1345.
Huff, F.A., and S.A. Changnon. 1973. Precipitation modification by major urban areas. Bulletin American Meteorological Society, 54: 1220-1232.
Huff, F.A., Changnon, S.A., and D.M.A. Jones. 1975. Precipitation increases in the low hills of southern Illinois. Part 1: Climate and network studies. Monthly Weather Review, 103: 823-829.
Johns, R.H., and W.D. Hirt. 1987. Derechoes: Widespread convectively induced windstorms. Weather and Forecasting,2: 32-49.
Maddox, R.A. 1983. Large-scale meteorological conditions associated with mid-latitude, mesos-cale convective complexes. Monthly Weather Review, 11: 1475-1493.
Westcott, N.E. 1995. Summertime cloud-to-ground lightning activity around major Midwestern urban areas, Journal Applied Meteorology, 34: 1633-1642.
Chapter 3. Hail
Introduction
Hailstones are pellets of ice created inside thunderstorms. When large enough, they descend, and many reach the ground, damaging plants, crops, and property. Not all thunderstorms generate hail that reaches the ground, but hail is a serious hazard across the Midwest.
Causes
Hailstones typically develop 3-4 miles above the earth’s surface in upper portions of a thunderstorm where air temperatures are between 12oF and -10oF. There, the moist vapor in the updraft, the air moving upward inside the storm, condenses. The particles freeze, forming ice crystals that become the heart of hailstones. Approximately 60 percent of all thunderstorms generate hailstones aloft.
The growth of hailstones sufficiently large to reach the ground requires very strong updrafts, forces creating taller than usual thunderstorms. Strong updrafts support hailstones aloft and allow hailstones to grow, often to diameters of an inch or larger before the stones descend. If falling hailstones enter another strong updraft, they again are carried aloft in the new moist air and grow ever larger, before falling as a volume of large hail. This repetitive growth process is reflected in the structure of hailstones that often show layers of ice around their embryo (Changnon, 2002).
The volume of hail reaching the ground falls 130 feet per second and usually represents less than 10 percent of the volume of rain produced by a thunderstorm. Hail produced by many thunderstorms never reaches the ground because it melts as it descends into the warmer air near the ground, forming raindrops. That is why thunderstorms in warmer climate zones seldom produce hail at the ground.
Severe hailstorms that produce a large quantity of large hailstones, typically more than an inch in diameter, are a result of four atmospheric factors:
• Strong convective instability, creating strong updrafts • Abundant moisture at low levels, feeding into the updrafts
• Strong wind shear aloft, usually shifting from southerly to more westerly as height increases, enhancing updrafts and storm lifetime
• Some dynamic mechanisms that help release instability (for example, flow over hills and ridges) Temporal and Spatial Distributions
When a volume of hailstones descending from a storm reaches the earth’s surface, the stones often cover an area a mile in diameter. As the hailstorm moves over time, falling hail-stones produce an elongated area of hail called a “hailstreak.” Its size and shape depend on storm speed and updraft strength inside the storm. A typical hailstreak is a mile wide and 5 miles in length (Changnon, 1977).
Most thunderstorms that produce hail generate up to two hailstreaks during their lifetime. Some organized lines of thunderstorms produce many hailstreaks with hail covering hundreds of square miles as the storms move across the terrain. Figure 3-1 shows two hailstreaks produced by two storm cells in the Midwest. Infrequently a thunderstorm becomes a well-organized giant that lasts for 3-6 hours, and these “supercell storms” generate very large hailstreaks. A supercell thunderstorm in April 2002 produced a record hailstreak extending from eastern Kansas, across Missouri, and into southern Illinois (Changnon and Burroughs, 2003).
Hailstorms occur in many parts of the world, including most of North America. The Mid-west has a high frequency of hailstorms, and the nation’s hail frequency is highest downwind of the western mountain ranges (Gokhale, 1975). High mountain ranges organize air flows condu-cive to the formation and development of large hail. Hail frequency decreases west to the east across the Midwest (Figure 3-2).
Even in areas of high hail frequency, the number of hailfalls at a given location during a year often varies greatly because hail falls typically over only a few square miles, as shown in Figure 3-1. In any given year, a farm in western Iowa may experience 5-6 hailstreaks, whereas an
Figure 3-1. Two hailstreaks and their rainfall areas (Changnon, 1977).
0 10 20 30 40
MILES
= Report of no hail with each rain cell = Hail report, and where
known, the time difference (minutes) between start of rain and start of hail = Isohyet for total rainfall
(inches) from rain cell = Hailstreak boundary = Isochrones of rain start
time, CDT E X P L A N A T I O N 0.15 1040 5 0 0 0 0115 0125 0130 0120 0135 0.01 0.01 0.05 0.01 0.01 0.04 Farmer City C E L L 3 C E L L 2
H
H
H
L
L
H
2 3 2 2 3 3 3 3 2 2 2 4 4 3 2 2 2 3adjacent farm may experience only 1-2 hailstreaks. These differences occur because the small size of hailstreaks results in a spotty distribution of hail.
Hailstone sizes vary widely, with most between 0.2 and 3.0 inches in diameter. Most hail-stones are small, and 85 percent of all hailhail-stones have diameters of 0.5 inch or less. Hail diam-eters of an inch or larger occur in only 5 percent of all U.S. hailstorms (Flora, 1956). The largest hailstone ever recorded in North America, 6.5 inches in diameter, fell in Nebraska in June 2003.
Assessment of North American hailstones reveals three different classes of hailstones: small (0.25-0.5 inch), moderate (0.5-1.0 inch), and large (>1 inch). Small hailstones are the most frequent in most of North America. Moderate hailstones occur in up to 15 percent of all hailfalls in the Midwest. Hailstones larger than an inch occur in less than two percent of all Midwestern hailfalls.
Most hail falls in the afternoon, although it can occur at any time of the day. The average duration of hail at a point is 5-6 minutes, but durations vary from a few seconds up to 15 min-utes. Hail occurs in the warm season when convective activity peaks. The hail season typically
Photo 3-1. A corn crop destroyed by a hailstorm (left) and hailstones damaged the side of this home (right).
begins in early spring, peaks during summer, with infrequent hail in the fall, and no hail in the winter. However, the effect of the relatively warm water in the Great Lakes during fall leads to hailstorms downwind of the lakes. For example, October is the peak month of hail activity in parts of western Michigan (Figure 3-3), whereas April is the peak month elsewhere in the Mid-west (Changnon, 1966).
Figure 3-4 depicts the temporal distributions of hail-caused losses to property and to crops in the Midwest during 1949-2003. Property losses from hail were highest in 1959-1968 and lowest during 1969-1978 (Changnon, 2004). Crop-hail losses in the Midwest had a somewhat similar distribution over time. Losses were highest during 1954-1968 with a secondary peak in 1994-1998. Crop-hail losses, like the property losses, were low during 1969-1978.
Inadvertent urban modification of hail also occurs. Studies of hail activity at Chicago and St. Louis found that these cities influenced the atmosphere sufficiently to lead to local increases of 10-30 percent in the number of hailfalls (Changnon, 1978).
Impacts
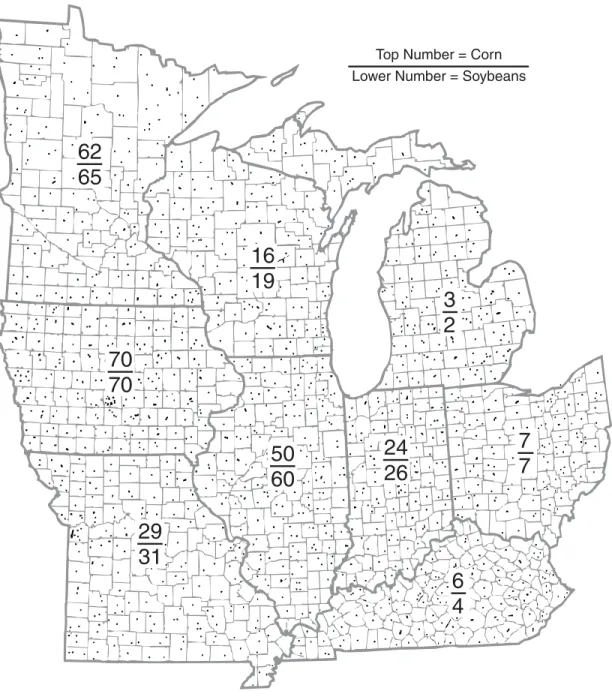
Major losses occur when a series of thunderstorms produce large areas of damaging hail (Decker, 1952). Large hail occasionally kills a human, and the U.S. has had 16 hail-related deaths since 1920. Hail also damages and kills cattle. Ninety percent of all crop-hail losses occur on only 10 percent of the days with hail. Figure 3-5 shows the average number of days per state with crop damage with the highest values (70 days) in Iowa and the lowest (3 days) in Michigan (Changnon, 2002). Crop damage from hail is a function of the hailstone sizes, number of
hail-Figure 3-3. Average frequency of hail days in September and October at weather stations around Lake Michigan with rank 1 representing highest monthly average of all 12 months (Changnon, 1966).
stones per unit area (volume of ice), and wind speeds when hail falls. Annual hail losses incorpo-rate these factors and the number of times hail falls. When high winds occur with hail, they blow the hailstones at angles, thus damaging the sides of structures and the stems of crops. In the United States, property losses from hail average $174 million per year and crop losses average $270 million. The average annual losses from hail in the Midwest totals $148 million, a third the nation’s total hail losses (Changnon, 2004).
References
Changnon, S.A. 1966. Effect of Lake Michigan on Severe Weather. Great Lakes Research Divi-sion Publication 15, University of Michigan, Ann Arbor, pp. 220-234.
Changnon, S.A. 1977. Scales of hail. Journal of Applied Meteorology, 16: 626-648.
Changnon, S.A. 1978. Urban effects on severe local storms at St. Louis. Journal of Applied Meteorology, 17: 578-586.
Changnon, S.A. 2002. Climatology of Hail Risk in the U.S. Changnon Climatologist, Mahomet, IL Changnon, S.A., and J. Burroughs. 2003. Tri-state hailstorm; The most costly on record,
Monthly Weather Review,131: 1734-1739.
Changnon, S.A. 2004. Present and future economic impacts of climate extremes in the U.S. Environmental Hazards, 5: 47-50.
Decker, W.L. 1952. Hail damage frequency, Transactions American Geophysical Union,22: 204-210.
Flora, S.D. 1956. Hailstorms of the United States. University of Oklahoma Press, Norman, OK. Gokhale, N.R. 1975. Hailstorms and Hailstone Growth. State University of New York Press,
Albany, NY. 0 50 150 200 250 300 350 400 450 500 1949-53 54-58 59-63 64-68 69-73 79-83 84-88 89-93 1999-03 Property Losses Year 0 200 Proper
ty Losses in Millions of Dollars
Crop Losses Hail 74-78 94-98 100 150 300 250 350
50 100 Crop Losses in Millions of Dollars
Figure 3-4. Temporal distribution of hail losses to crops and to property over 5-year periods, 1949-2003 (Changnon, 2002).
62
65
16
19
70
70
29
31
50
60
24
26
3
2
7
7
6
4
Top Number = Corn Lower Number = Soybeans
Figure 3-5. Average annual number of hail days causing corn and soybean damages in each state, 1949-2001 (Changnon, 2002).
Chapter 4. Tornadoes and High Winds
Introduction
A tornado is a violently rotating column of air, a vortex spawned by a thunderstorm that reaches the ground. It has a funnel-like appearance. The funnel rotates at high wind speeds that can vary from 70-250 mph or more (Lewellen, 1993), and moves over the land along a narrow path. Fortunately, this extremely dangerous storm is not common. Less than one percent of all thunderstorms ever generate a tornado.
Tornadoes are an enigma that hides, shifts, retreats, reforms, multiplies, and changes shape, size, and intensity, often by the minute. High winds from downdrafts of storms producing a tornado can hamper interpretation of where a tornado actually occurred. Identifying and counting tornadoes is further complicated because some occur in pairs, others produce multiple vortices, and others form and dissipate several times in a few miles. Most tornadoes are small, short-lived phenomenon, but 5 percent become large, long lasting, and very dangerous (Grazulis, 1991)
.
A downburst is a strong downdraft from a thunderstorm that causes an outburst of damaging winds at the surface (Fujita, 1981). The winds travel outward from where they reach the ground, being between 100 yards and 10 miles wide. These high winds can be quite damaging and often are confused as being the result of a tornado. Squall lines and mesoscale groups of storms occa-sionally initiate a large-scale wave of high winds at the surface and these sweep over hundreds of square miles.
Causes
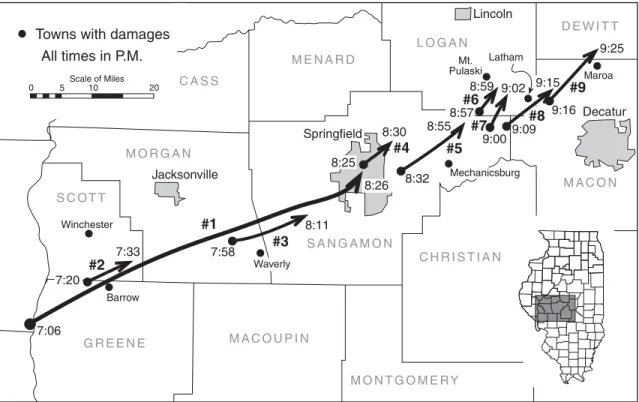
Typical atmospheric conditions leading to tornado formation include exceptional instability, an advancing cold front and low pressure system, and wind shear. Many Midwestern tornadoes come from thunderstorms in a squall line that forms ahead of a surface cold front, along the surface or upper-air cold front, or in a low-pressure trough. The oft-irregular distribution of thunderstorms along a squall line can lead to a complex variety of convergence situations, shear zones, and updrafts that may give rise to tornadoes. Squall line tornadoes often occur in families and move at speeds of 35 mph or higher. Tornadoes from such storms are typically larger and longer lasting than tornadoes created by other synoptic weather conditions. Tornadoes also are created by supercell thunderstorms (see Chapter 2), the most intense, well organized, and long-est-lasting type of thunderstorm. Supercells often create families of tornadoes along their track as shown in Figure 4-1. A tornado outbreak is a family of six or more tornadoes spawned by the same weather system in close time sequence, an hour or less between funnels, as illustrated by the times shown on the tornado tracks depicted in Figure 4-1.
Some thunderstorms that form in unstable warm air masses also cause tornadoes, but these are usually small, short-lived events. Another special form of tornadoes comes from storms in derechoes, a large area of severe thunderstorms that move from the northwest or west, create clusters of downbursts, and generate extensive damage from straight-line winds but also can spawn tornadoes. These tornadoes are related either to a cluster or line of thunderstorms. Derechoes are most frequent in the Midwest (Bentley and Mote, 1998).
Winchester Barrow Maroa Mt. Pulaski Springfield Decatur Lincoln Jacksonville Waverly Mechanicsburg Latham M O R G A N M AC O N L O G A N M E N A R D S A N G A M O N C A S S S C OT T G R E E N E M AC O U P I N M O N T G O M E RY C H R I S T I A N D E W I T T #1 #2 #3 #4 #5 #7 #6 7:06 7:58 8:11 8:59 9:02 8:57 9:00 8:55 8:32 8:30 7:33 8:25 8:26 7:20 #8 #9 9:09 9:16 9:25 9:15 0 5Scale of Miles10 20
Towns with damages All times in P.M.
Temporal and Spatial Distributions
Tornadoes in the Midwest occur most frequently in the spring season, peaking in April and May. The peak is April in the southern parts of the Midwest, and is May-June in the northern sections of the Midwest. However, tornadoes have occurred in all months of the year and in all parts of the Midwest. Their average duration is 22 minutes, although a few long-track storms have lasted for 2-3 hours. Tornadoes are most frequent during afternoon and early evening, but can occur at anytime.
The average size of a tornado track in the Midwest is 11.8 miles long and 585 feet wide. A few record-setting tornadoes have had tracks covering 200 miles and widths of a mile, but 45 percent of all Midwestern tornadoes only have tracks half a mile long (Grazulis, 1991). Forward speeds average 35-40 mph. The preferred direction of tornado movement is from southwest to northeast, followed by west-southwest to east-northeast oriented tracks.
The average annual number of tornadoes during 1901-1980, expressed as the number per 10,000 square miles (Figure 4-2), shows the peak of activity is in Indiana, Illinois, western Iowa, and Missouri. The fewest tornadoes occurred in the extreme northern Midwest and in the south-east. Figure 4-3 shows the state frequencies of tornadoes during 1953-1989. Iowa had 1,105 tornadoes, the most in the Midwest and also ranked sixth nationally. Missouri had 996 tornadoes and ranked seventh nationally. Illinois had 960 and ranked eighth nationally.
L
L
H
H
H
L
3 5 5 5 5 3 3 3 1 1 3 3 3 1 0.5 1 0.5 0.5 0.5 1 5 7 5 1Figure 4-2. Average annual number of tornado occurrences per 10,000 square miles, 1901-1980 (Fujita, 1981).
652
(19)
1105
(6)
714
(17)
960
(8)
996
(7)
744
(14)
652
(19)
514
(21)
304
(27)
Top Number = Number of Tornadoes (Lower Number) = National Rank
Figure 4-3. Number of tornadoes in each state, 1953-1989, and the national rank of each state’s value (Grazulis, 1991).
The 1901-2000 temporal distribution of tornadoes that caused deaths, killer tornadoes, in the Midwest is shown in Figure 4-4. With an ever-increasing population during the 20th Century, one would expect the annual number of tornado deaths to increase over time, but tornado forecasting and detection capabilities developed rapidly after 1950, decreasing deaths. The 100-year distribu-tion shows an early peak of 76 killer tornadoes in 1916-1920 and then 54 others in 1926-1930. Another peak of 58 killer storms occurred during 1971-1975. Years with large numbers include 1974 (33 storms), 1917 (32 storms), and 1965 (29 storms). Values in more recent years, 1976-2000, have been relatively low, likely reflecting increased use of storm warnings. Low storm values occurred in 1931-1940 and 1986-1990, both periods of extreme droughts, fewer thunderstorms, and thus fewer strong tornadoes. Three years had no killer tornadoes: 1910, 1970, and 1989.
The greatest tornado outbreak in the United States and Midwest occurred on April 3-4, 1974: 148 tornadoes in 13 states, including 88 tornadoes in Illinois, Indiana, Michigan, Ken-tucky, and Ohio (see Chapter 8). The famed Palm Sunday outbreak occurred on April 11-12, 1965, and produced 31 severe tornadoes in the Midwest (Fujita, 1974). Major outbreaks of tornadoes in the Midwest have also occurred in off-season months. For example, these outbreaks occurred on January 24, 1967 (18 tornadoes), September 29, 1927 (10 tornadoes), and December 18,1957 (18 tornadoes).
Impacts
A few large, long-lasting storms have been responsible for most tornado damages and deaths. In addition, non-tornadic high winds also remove roofs and produce straight line damage to trees and structures. Intense tornadoes lift houses and trailers, moving them hundreds of feet. Annual average property losses from U.S. tornadoes total $458 million, with $141 million in losses in the Midwest. High wind losses average $35 million per year.
Year 0 40 Number of To rnadoes 20 30 70 60 80 10 50 1901-051906-101911-151916-201921-251926-301931-351936-401941-451946-501951-551956-601961-651966-701971-751976-801981-851986-901991-951996-00
Flying debris is the primary cause of human deaths and injuries. The number of deaths per state in the Midwest from tornadoes since 1952 shows Michigan leads (236 deaths), followed by Indiana (206 deaths), Ohio (170 deaths), and Illinois (147 deaths). The number of tornado deaths adjusted for frequency per 10,000 square miles, shows Indiana leads (57 deaths), followed by Michigan (42 deaths), Ohio (41), Illinois (27), and Kentucky (26 deaths). The average annual number of deaths due to tornadoes in the Midwest is 21.
References
Bentley, M.L., and T.L. Mote. 1998. A climatology of derecho-producing mesoscale convective systems in the central and eastern U.S., 1986-1995. Part 1: Temporal and spatial distribution. Bulletin American Meteorological Society,79: 25272540
Fujita, T.T. 1974. Jumbo tornado outbreak of 3 April 1974. Weatherwise, 27: 116-126. Fujita, T.T. 1981. Tornadoes and downbursts in the context of generalized planetary scales.
Journal of Atmospheric Sciences,38: 1511-1534.
Grazulis, T.P. 1991. Significant Tornadoes 1880-1989. Environmental Films, St. Johnsbury, VT. Lewellen, W.S. 1993. Tornado vortex theory. In The Tornado: Its Structure, Dynamics,
Predic-tion, and Hazards, Geophysical Monograph 79, American Geophysical Union, Washington, DC., pp. 19-39.
Chapter 5. Heavy Rainfall
Introduction
Heavy rainfall can be classified in different ways. Numerous studies have assessed the point amounts of heavy rainfall using historic frequencies; other studies have classified Midwest-ern storms that led to heavy rainfall. This report defines heavy point rains as point rainfall
amounts that equate to once in 5-year levels for durations of 1- 24 hours. Rainstorms that pro-duce 12 or more inches of rain over an area of 600 square miles in 24 hours or less are classified as heavy rainstorms, criteria defined after study of 79 Midwestern rainstorms (Huff, 1979). Such events cause flash floods in small basins and have led to numerous deaths. A 1996rainstorm across Wisconsin, northern Illinois, and Indiana led to 7 deaths and $820 million in losses (Changnon, 1999).
Causes
Most Midwestern heavy rainstorms occur at night, typically from mesoscale convective systems (see Chapter 2). Storm rainfall typically begins in the late afternoon or evening and ends 10 to 14 hours later. Convection induced by local heating is not the primary cause of these storms, although the heating creates a favorable environment for them to occur. Rather massive rainfall amounts require large-scale organized weather systems to provide the local convergence and uplift, plus moisture supply. Most such storms occur in and just south of an east-west ori-ented stationary front that previously was a warm front. Analysis shows that stationary fronts in May-September (the prime storm period) are most frequent along a west-east axis from northern Missouri eastward across Illinois, Indiana, and Ohio (Morgan et al., 1975).
Air and dew point temperatures are quite high south of these fronts. When storms occur, the atmosphere contains exceptionally large amounts of precipitable water (2 inches or more, 200
percent of average) in the storm area. Frequently, a strong, low-level jet is just south of the front, which when coupled with the stationary front, creates the strong convergence that causes numerous thunderstorms to develop repeatedly in the same area. The low-level jet typically exhibits a nocturnal maximum in strength, the main reason that heavy rainstorms occur most frequently at night.These storms often are organized into mesoscale storm complexes, guided by the strong westerly flow, and move repeatedly along the same path. Thus, multiple storms pass over the same area during several hours, leading to very heavy total rainfall (Changnon and Kunkel, 1999; Changnon and Changnon, 2004).
Temporal and Spatial Distributions
Figures 5-1 through 5-4 present selected patterns portraying the heavy rainfall frequencies for points throughout the Midwest (Huff and Angel, 1992). The 1-hour values show a regional peak of 2.4 inches occurs in southern Missouri for the 5-year return period (Figure 5-1). The 100-year, 1-hour return value (Figure 5-2) has its highest values of 4 inches in southern Missouri and northern Illinois. The lowest rainfall values occur in northern and eastern Michigan. The heavy rainfall values for the 24-hour, 5-year return period (Figure 5-3) range from a low of 2.5 inches in Michigan to 5 inches in Missouri. The 24-hour, 100-year return period (Figure 5-4) has a similar distribution of high and low values across the Midwest.
The area of highest rainfall values in the four patterns is oriented west-east from southwest-ern Missouri eastward across Illinois and Indiana. This area is where warm season stationary fronts are most common (Morgan et al., 1975), and thus where heavy rainstorms are most fre-quent and intense.
Studies of Midwestern heavy rainstorms during 1948-1978 identified two sizes of rain-storms (Huff, 1979). The larger mesoscale rain-storms extended over contiguous areas of 5,000 square miles or more. Small-scale rainstorms were confined to areas of 400-2,000 square miles, with most heavy rain over less than 1,000 square miles. The larger storms produced rainfall in about 12 hours, with >1 inch over 5,000 square miles. An area-depth model of these storms (Figure 5-5) shows the ratio of heaviest rainfall to mean rainfall over the entire storm area. Figure 5-6 shows the area-depth curve for small-scale storms, those with durations of 3-8 hours and sizes of 3,000 square miles or less. Thus, for a small-scale 12-hour storm with a mean rainfall of 2.5 inches over the entire storm, the area mean rainfall over the most intense 25 square miles is about 5 inches (a ratio of 2.0).
Studies of rainstorm shapes revealed that the centers of heavy rain intensity in both large and small scale rainstorms most frequently had an elliptical shape. The ratio of the long axis to the short axis of the large storms is 3.8, revealing considerable elongation. The ratio in smaller storms is 2.9, revealing they are more oblate shaped. The orientation of the major axis of both storm sizes reflects the storm motion. Most storms, 71 percent, have orientations ranging be-tween 236 degrees (southwest) and 295 degrees (west-northwest).
Heavy rainstorms usually are produced by one or more squall lines or squall areas. Each system consists of thunderstorms that move with the wind field in which they are embedded.
Figure 5-1. Point rainfall amounts in one hour expected at least once every five years (Huff and Angel, 1992).
Figure 5-2. Point rainfall amounts in one hour expected at least once every 100 years (Huff and Angel, 1992).
Figure 5-3. Point rainfall amounts in 24 hours expected at least once every five years (Huff and Angel, 1992).
Figure 5-4. Point rainfall amounts in 24 hours expected at least once every 100 years (Huff and Angel, 1992).
1.0 1.5 2.0 2.5 3.0 150 500 1000 2000 3500 5000
Area (square mile)
Area-Depth in Ratio 24-hour 12-hour 3-hour Large-Area Model 1.00 1.50 2.00 2.50 10 25 100
Area (square mile)
Area-Depth in Ratio Small-Area Model 2.25 1.75 1.25 200 500
Figure 5-5. Area-depth model values for large mesoscale storms in the Midwest (Huff, 1979).
Figure 5-6 Area-depth model for small mesoscale storms in the Midwest (Huff, 1979).
Motions of storm cell movements show that 75 percent move from 210 degrees (south-south-west) to 300 degrees (west-north(south-south-west), and all had a westerly component.
The preferred starting time of rainfall from larger storm types is 1900 LST (local standard time), as compared to 1600 LST for smaller storms. Duration of heaviest rainfalls is 6 hours for the larger storms and 3 hours for the smaller storms. Average storm duration is 12 hours for the larger storms and 4 hours for the smaller storms. Severe rainstorms mainly occur in the warm season: 51 percent in summer, 20 percent in spring, 22 percent in fall, and 7 percent in winter. The peak month is July, followed by August, June, and September. The historical time distribu-tion of heavy rainstorms in the Midwest shows that a few years have had numerous storms such as 1956 (six storms) and 1957 (eight storms), whereas most years only had one or two rainstorms and a few years had none.
Heavy precipitation events often are identified based on precipitation amounts accumulating during a particular interval of time and by the average frequency of occurrence of that amount. For example, the Chicago area has a daily rainfall amount of 2.5 inches or more about once a year, on average, a daily amount of 4.5 inches or more about once every 10 years, and a weekly amount of 4 inches or more about once a year. These amounts vary across the Midwest, with generally higher amounts in the south for a given frequency of occurrence. For example, the daily amount exceeded about once every 10 years varies from 3 inches in northern Michigan to 6 inches in southwest Missouri.
There has been substantial temporal variability in the frequency of heavy rain events. Figures 5-7 and 5-8 show frequencies for daily and weekly intervals, and for average frequencies of once per year and once per 10 years, based on data from 360 long-term Midwestern stations. The most prominent feature for all combinations is the generally above average frequency since 1976. All curves show maximum values either during 1986-1995 or 1996-2005. The lowest values occur during 1916-1925 with frequencies nearly as low as those in 1926-1935. Another interesting fea-ture is the moderately high frequencies early in the record, particularly at the 1-year return period (Figure 5-7), which had values for 1896-1905 nearly as high as those for the post 1976 periods.
The elevated frequency of heavy precipitation events during the more recent decades is one of the more prominent trends in severe storm occurrences in the Midwest. This has led to in-creased flooding of streams (Changnon and Kunkel, 1995) and severe losses from some flood events (Changnon, 1996; Changnon and Kunkel, 1999). While the recent frequencies were the highest of the instrumental record since 1896, frequencies during 1896-1915 were, in some cases, almost as high as those in recent decades, illustrating large variations possible in the Midwest over multi-decadal periods. This is similar to national behavior found by Kunkel et al. (2003). Impacts
Heavy rains cause soil erosion and account for 68 percent of all erosion in the Midwest. The eroded soils pollute streams and cause loss of capacity in lakes and reservoirs. However, the biggest negative impact from heavy rains and storms is flooding. Flash flooding is particularly damaging and causes most deaths attributed to floods (Changnon, 1999).