www.featurespace.co.uk
REPORT 3:
PREDICTING
PROBLEM GAMBLERS:
Analysis of industry data
Gambling machines research program
28 November 2014
Authors: David Excell, Georgiy Bobashev, Daniel Gonzalez-Ordonez,
Heather Wardle, Tom Whitehead, Robert J. Morris, Paul Ruddle
Contents
Executive Summary ... 5
Introduction ... 6
About the research ... 6
Policy context ... 6
The research process ... 6
About this Report ... 8
About the Research Organisations ... 8
Unique Contribution ... 9
Definitions & Assumptions ... 10
Gaming Machines in Great Britain ... 12
Methodology ... 15
Predictive Models ... 15
Terminology ... 15
Model Development Approach ... 17
Target Variable ... 18
Data Pre-processing ... 18
Model Complexity vs Model Information... 19
Measuring Model Performance ... 19
Data ... 22 Industry Data ... 22 Data Request ... 22 Data Received ... 23 Data Quality ... 24 Survey Data ... 25 Proxy Sessions ... 26
Measurement of Harm Markers ... 27
Between-Session Markers ... 27
Within-Session Markers ... 29
Data Analysis Results ... 31
Baseline ... 31
Player Baseline ... 33
Session Baseline ... 37
Summary ... 40
Using Between Session Markers ... 41
Incorporating Within-Session Markers ... 43
Session Analysis (Unregistered Play) ... 48
Additional Experiments ... 51
Removing multiple loyalty cards ... 51
PGSI Problem Gambling Threshold ... 52
... 54
Predicting PGSI Screening Question Responses ... 55
Gambling Type Analysis ... 56
Factor Group Analysis ... 57
Debit Card Usage ... 58
Discussion ... 60
Can we identify harm? ... 61
Research Implications ... 62
Multiple Variables ... 62
Registered vs Non-Registered Play ... 62
Mandatory ABB Limits ... 63
Research Limitations ... 63 Future Research ... 63 Recommendations ... 66 Conclusion ... 68 About Featurespace ... 70 About RTI ... 71 References ... 72 Document Information ... 73 Document History ... 73
Appendix A Calculating Proxy Sessions ... 74
Appendix B - Measurement of Harm Markers ... 77
Between Session Metrics ... 77
1) Frequency of Play ... 78
2) Duration of Play ... 82
3) Net Expenditure ... 85
4) Levels of Play Engagement ... 88
5) Number of Activities/Games Types Undertaken ... 90
6) Chasing ... 94
1) Debit Card Payment Reloading and Switching ... 97
2) Debit Card Payment Decline ... 99
3) Variability In Staking Behaviour ... 100
4) Use of Autoplay ... 103
5) Play of Multiple Machines Simultaneously ... 105
6) Stake Size ... 106
7) Game Volatility ... 108
8) Way Game Played (e.g. number of bets per stake) ... 111
9) Cash-Out ... 114
Appendix C Representativeness of Loyalty Card Data ... 116
Appendix D Candidate Predictive Modelling Approaches Explored by RTI ... 121
Appendix E Example of transformed between session variables. ... 123
Executive Summary
The Responsible Gambling Trust has been challenged by the Responsible Gambling Strategy Board to answer the following two questions:
Is it possible to distinguish between harmful and non-harmful gaming machine play?
If so, what measures might limit harmful play without impacting those who do not exhibit harmful behaviours?
Focusing on the first of these questions, this report confirms that it is possible to distinguish between harmful-and non-harmful gaming machine play. The research effort undertaken to deliver this report required the skilful processing and analysing of a large dataset using machine learning methods. By focusing on problem gambling behaviour survey data, this advanced technological approach has produced a step-change in the way gambling behaviour and specifically problem gambling behaviour is
understood.
Furthermore, new insights into gambling behaviours have been identified and are detailed in this report. For example, researchers have discovered which Problem Gambling Severity Index questions are most predictive of problem gambling behaviour;
indicative of problem gambling; and the need to consider a range of variables when attempting to distinguish between problem and non-problem gamblers. This has fundamental implications for
operationalising the research and developing intervention strategies, the most critical of which is that a focus on a single factor such as reduction of stake size will not effectively prevent or reduce gambling harm.
From this research it is not possible to state categorically whether only gaming machine play predominantly contributes to problem gambling status, or whether this is
accounted for by participation in multiple forms of gambling. Readers should not assume that problem gambling status is causally and predominantly related to gaming machine play.
Indeed, given the complexity of problem gambling and gambling behaviours in general, the researchers have concluded that any corporate responsibility strategy must take a balanced, rounded approach. That is, that by factoring in the environment, the individual player, and the product being played to provide a complete view rather than focusing on a single variable the gambling industry will be able to significantly improve the detection rate of problem gamblers and the minimisation of gambling related harm.
Finally, consideration has been given to the second question-- what measures might limit harmful play without impacting those who do not exhibit harmful behaviours? although answering this does not contribute to a significant portion of this report. The researchers conclude from their analysis that operators will face trade-offs in delivering harm minimisation interventions, as some amount of non-problem-gamblers will inevitably receive interventions which are unnecessary. Therefore all interventions must be carefully evaluated in a live environment to measure their effectiveness.
Introduction
About the research
Policy context
This report forms part of series of research projects commissioned by the Responsible Gambling Trust to explore the extent to which industry data generated by machines in bookmakers can be used to identify harmful patterns of play. In recent years, there have been increasing c
better understand how consumers play machines. It is hoped that, by analysing transactional data, it will be possible to identify patterns of play that indicate someone is experiencing problems or harm from their engagement in gambling. Industry and regulators alike are keen to see if this is possible. If so, a potential new range of responsible gambling measures, tailored towards and intervening with the individual, could be developed.
To date, regulation of machines tends to be conducted at a high level, making generalisations that focus on restrictions of stake, prize, speed and number of machines. There is no regulation that is tailored towards individual players. The Gambling Commission (the industry regulator) considers that a mix of macro (i.e., stakes and prizes) and micro (i.e., the individual) regulatory approaches may be patterns of play and, if so, what types of interventions could be introduced that
intercede with gamblers experiencing problems. A further concern is to ensure that any individual-led policies intervene with those experiencing problems, whilst allowing those who are not experiencing problems to play without onerous intervention.
The objectives set by the Responsible Gambling Strategy Board (RGSB) for the broader research programme were:
Can harmful and non-harmful gaming machine play be distinguished?, and If so, what measures might limit harmful play without impacting those who do not exhibit harmful behaviours?
The RGSB (Responsible Gambling Strategy Board) is the body responsible for setting strategic objectives for gambling research and policy and advising the Gambling Commission on these issues. To meet these objectives, a series of research projects was planned by the research team, a consortium of NatCen Social Research, Featurespace, Geofutures, and RTI International. These projects focus mainly on the first objective, though consideration is also given to the second. Other research projects (called contextual projects in the broader research programme) contribute to the second objective; for example, by looking at how people understand certain types of player messaging (see Collins et al, 2014).
The research process
To meet the objectives set by the RGSB, a number of project stages were undertaken and three related reports have been published. The project stages are shown in Figure 1.
Figure 1 - Research project stages
In meeting the objective set by the RGSB, the first step was to consider what patterns of play might indicate that someone was experiencing harm. This involved a theoretical review, a rapid evidence review and consultation with key stakeholders to develop a set of metrics (or markers) which may exist within industry data and might indicate that someone was experiencing harm. The results of this stage are published in Wardle, Parke and Excel (2014), called Report 1 in this series (See Wardle, Parke & Excell, Report 1: Theoretical Markers of Harm).
The next step was to consider whether the markers of harm identified from the review were actually evident in industry-collected data. This part of the research was
Markers section of this report.
Early analysis suggested that some of the markers of harm identified in the review could be measured using industry data and therefore further exploration of the data was warranted. A critical question for this research centred on examining the potential patterns of harm identified in theoretical markers of harm from existing academic literature and expert opinion. It was necessary to determine if these theoretical markers of harm were actually patterns of play exhibited by those experiencing harm from gambling. A crucial aspect of this is determining the extent to which potential patterns of harm differentiate between those experiencing harm and those who do not. To explore this, more detail is needed about the player and the extent to which they are experiencing gambling-related problems. This information can only be obtained by communicating directly with players.
The study by NatCen, which is documented in Report 2, fills that gap. It reports survey findings from individuals who have loyalty cards for Ladbrokes, William Hill, or Paddy Power. Using loyalty card holders as a sampling frame for a survey meant that we could link their survey responses with data collected and recorded for their loyalty card. The loyalty cards for bookmakers operate in much the same way as other loyalty cards (like Tesco Clubcards or Nectar cards) where every transaction (where the card is used) is recorded for an individual. This means it is possible to track the frequency and duration of time spent on machines, so long as individuals used their loyalty card when playing. Using this data has considerable benefits over traditional survey approaches, as it is widely accepted that estimates of gambling expenditure obtained through surveys are inaccurate.
The study document in this report has one primary aim: to discover if, by combing the survey results obtain by NatCen from loyalty card holders with the data held by the industry, it is possible to distinguish between harmful and non-harmful play through the identification of specific patterns in a player s behaviour. It is important to note that a majority of surveyed loyalty card holders participated in multiple forms of gambling. Therefore it is not possible to state categorically whether only gaming machine play predominantly contributed to their problem gambling status, or whether that status can be accounted for by participation in multiple forms.
Within that goal, the aims of this report are to:
provide a description of the data and context to the gambling environment from which the data was obtained;
provide an overview of the methodology used to analyse the data;
report on the initial findings that lead to the conclusion that industry data was suitable for further analysis to understand harmful play;
report on the analytics performed and provide a discussion on how the results should be interpreted, and suggest recommendations on how the results could be used and further explored.
Report 2 and Report 3 (this report) should be viewed together and it is these two reports in combination which aim to meet the research objectives set out by the RGSB.
About this Report
The objective of this report is to describe the findings of the research undertaken and ensure that the results can be understood by a wide range of interested stakeholders. A significant proportion of the research effort undertaken to deliver this report has been the sophisticated manipulation and analysis of a large volume of data using state-of-the-art processing systems and statistical algorithms. A summary of the technical
review of the analytical techniques and processes described has been purposely excluded as it would not enhance the understanding of the research for a majority of the readers.
About the Research Organisations
The research documented in this report has principally been carried out by an international team of researchers from Featurespace and RTI International, in tandem with invaluable input and guidance from NatCen. Featurespace took on the role of working with the industry to obtain and process their data, and then worked in conjunction with RTI to analyse the patterns within the data. NatCen undertook the loyalty card surveys and provided analysis of the responses to help guide the data analysis.
With the time-limited nature of this research program, having two organisations working in parallel with varying backgrounds in the application of data analytics enabled different approaches to be explored independently. Results were then compared and
the differences and similarities understood. This also provided additional oversight in terms of quality assurance to ensure valid results were produced.
Unique Contribution
A unique contribution to the understanding of problem gambling is provided in this report. These contributions are summarised below:
It is the first time that the five largest operators in Great Britain have made their data available for analysis by independent researchers.
It is the first time in the world where land-based industry data from multiple operators has been analysed alongside a problem gambling screening score obtained by interviewing individuals. This has provided an incredibility rich data set which has the potential to unlock a whole range of new research initiatives. A number of studies have been completed previous, but the size of these samples has been significantly smaller.
The research is based on a significant sample size (n = 3,988) compared to existing studies which have been limited to, at most, a few hundred individuals.
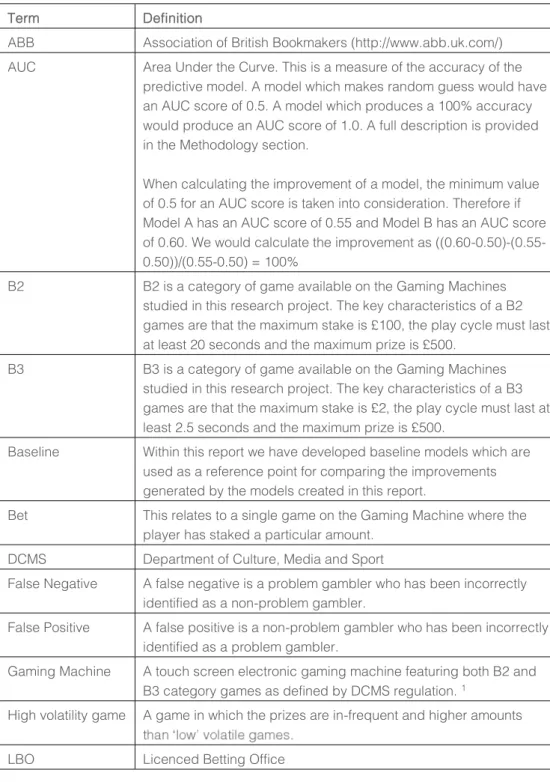
Definitions & Assumptions
These terms have the following meaning within this document:
Term Definition
ABB Association of British Bookmakers (http://www.abb.uk.com/) AUC Area Under the Curve. This is a measure of the accuracy of the
predictive model. A model which makes random guess would have an AUC score of 0.5. A model which produces a 100% accuracy would produce an AUC score of 1.0. A full description is provided in the Methodology section.
When calculating the improvement of a model, the minimum value of 0.5 for an AUC score is taken into consideration. Therefore if Model A has an AUC score of 0.55 and Model B has an AUC score of 0.60. We would calculate the improvement as ((0.60-0.50)-(0.55-0.50))/(0.55-0.50) = 100%
B2 B2 is a category of game available on the Gaming Machines studied in this research project. The key characteristics of a B2 games are that the maximum stake is £100, the play cycle must last at least 20 seconds and the maximum prize is £500.
B3 B3 is a category of game available on the Gaming Machines studied in this research project. The key characteristics of a B3 games are that the maximum stake is £2, the play cycle must last at least 2.5 seconds and the maximum prize is £500.
Baseline Within this report we have developed baseline models which are used as a reference point for comparing the improvements generated by the models created in this report.
Bet This relates to a single game on the Gaming Machine where the player has staked a particular amount.
DCMS Department of Culture, Media and Sport
False Negative A false negative is a problem gambler who has been incorrectly identified as a non-problem gambler.
False Positive A false positive is a non-problem gambler who has been incorrectly identified as a problem gambler.
Gaming Machine A touch screen electronic gaming machine featuring both B2 and B3 category games as defined by DCMS regulation. 1
High volatility game A game in which the prizes are in-frequent and higher amounts LBO Licenced Betting Office
1 These Gaming Machines are colloquially and unofficially known as FOBTs, or Fixed
Odds Betting Terminals. A more detailed description of the type of games available on Gaming Machines, and the differentiation between B2 and B3 games, will be provided in the next report.
Low volatility game A game in which the prizes are frequent and lower amounts than Month(ly) A calendar month, for example, 1-Sept to 30-Sept 2013
PGSI Problem Gambling Severity Index
Playing Day Day of the week in which a registered player has had at least one session on a machine.
RGSB Responsible Gambling Strategy Board (http://www.rgsb.org.uk/) ROC Receiver Operating Characteristic This is a commonly used
graphical method to show the performance of a predictive model. A full description is provided in the Methodology section.
Sensitivity
that is the proportion of correctly identified problem gamblers. Session A continuous period of machine activity from a player. Specificity Equ
that is, the proportion of correctly identified non-problem gamblers. Stake Amount of money the customer is risking on a bet.
Time Periods All time periods are in this report are either shown using the unit of days, or in the format D.hh:mm:ss where D is the total number of whole days and hh, mm, ss represent the number of hours, minutes and seconds respectively.
True Negative A true negative is a non-problem gambler who has been correctly identified.
True Positive A true positive is a problem gambler who has been correctly identified.
Gaming Machines in Great Britain
The focus of the Machines Research Programme commissioned by the Responsible Gambling Trust was to understand if harmful and non-harmful play could be
distinguished on the gaming machines operated by Licenced Betting Offices in Great Britain (England, Scotland and Wales).
Great Britain has one of the most gambling diverse markets in the world, with a wide range of gambling channels, including Retail (e.g. Casinos, Licenced Betting Offices, Bingo Halls, and Arcades), Internet, Mobile, and Telephone betting. There is also a wide range of products offered, including but not limited to, Sports Betting, Casino Games, Poker, Bingo, Lottery and Scratch Cards.
Licenced Betting Offices (LBOs) are retail premises that offer facilities to place a bet; that is, making or accepting a bet on the outcome of a race, competition, or other event. As of October 2014, there are 9,508 registered LBO premises in Great Britain, a majority of which are located on the high-street and residential areas. The five largest operators of LBOs are Betfred, Gala Coral, Ladbrokes, Paddy Power and William Hill. Within their retail premises, these operators generate -The-Licence Betting Office is restricted to four physical Gaming Machines. Each of the five operators also provides remote gambling services. In many town centres, it is not uncommon to see a combination of LBOs located within a short distance from each other. For a detailed analysis of the spatial distribution of the LBOs, please refer to the contextual report generated by Geofutures published as part of this research
programme.
There are two primary gaming machine suppliers in the Great Brian LBO market: Scientific Games and Inspired Gaming. The Gaming Machines are modern gaming terminals offering graphically rich content across a number of different game types. Images of machines from the two primary suppliers are shown in Figure 2.
Figure 2 - Gaming Machine terminals that generated the data studied in this research. Inspired gaming terminals are shown on the left and a Scientific Games terminal shown on the right.
The games offered by a Gaming Machine can fall into the following categories defined by regulation: B2, B3, B4, C and D. A significant proportion of the stakes placed on the gaming machines are from games that fall into the B2 or B3 categories. Full technical
standards for these categories can be found on the Gambling Commissions website2, but a summary of the salient points is provide below:
B2 Category Games. These games have a maximum stake of £100 and a maximum prize of £500. The game cycle must last at least 20 seconds. The most popular style of B2 Category game is Roulette.
B3 Category Games. These games have a maximum stake of £2 and a maximum prize of £500. The game cycle must last at least 2.5 seconds. The typical B3 style
The analysis completed as part of this research did not explicitly look at the difference between B2 and B3 playing characteristics. However the inputs into the predictive models included metrics about the proportion of bets on the different content categories.
One of the key contributors to the successful completion of this research programme was access to player card data. There is no regulatory requirement for Gaming Machine operators to monitor which players are using their gaming machine products. Therefore, at the time when this research was commissioned, the player cards had been implemented as loyalty card schemes to facilitate player insight and marketing. This has meant that the operators have independently implemented their own schemes with different degrees of data capture and data quality. However, there are some commonalities when the same Gaming Machine supplier has been used between been run by Ladbrokes since 2008. Both Paddy Power and William Hill introduced their loyalty schemes in 2013, and Gala Coral introduced their Coral Connect scheme early in 2014. An example of the player cards provided by the industry is shown below in Figure 3. Some of the loyalty card programmes bridge the gap between retail and remote gambling, enabling the players to transfer funds between the channels. For the time period studied in this research, loyalty card data was only available from
Ladbrokes, Paddy Power and William Hill.
2
http://www.gamblingcommission.gov.uk/shared_content_areas/gaming_machines_technical_stan. aspx
Figure 3 - Example Loyalty Cards from Ladbrokes, William Hill, Gala Coral and Paddy Power.
Methodology
In this section, a brief overview is provided on the methodology and techniques used to analyse the data to answer the research question. The aim of this section is to provide enough background knowledge to the reader to aid in the interpretation of the results presented later in the report. We also explore some of the complexities of the data modelling approach in the context of distinguishing between harmful and non-harmful gaming machine play. The approach used to examine the performance of the predictive models is provided and explains how different trade-offs can be made when applying predictive models in an operational environment.
The data analysed in this process had some unique challenges that need to be considered when designing the methodology. The key challenges were:
Data volume: Just under 10 billion data records were provided for this analysis. Analysing this volume of data required consideration of how to store, access, and process it efficiently and accurately.
Data Skewedness: When investigating the data there is often a significant difference between the mean and median values of the data. This shows that there is a small number of extreme values which can alter our perception of what the majority of customers are doing.
Representativeness of Registered Players: When comparing sessions generated by registered and non-registered players, we observed that registered sessions provided an
over-sessions, compared to the entire data set. Detail of this analysis is provided in Appendix C.
Predictive Models
In its simplest form, a predictive model takes a range of characteristics as inputs and looks at how well a prediction can be made from them. A predictive model can be as
be male. This predictive model is making an assumption that all males have hair shorter than 5cm. In the real-world, inaccurate predictions would be produced by only applying this rule. Increasing the number of input characteristics and the complexity of
interpreting the relationships within the data allow accuracy to be improved.
Terminology
To measure the quality of a predictive model, the target that we are trying to predict needs to be defined. For this research, we have defined our target as predicting problem gamblers. In predictive modelling t
that we have correctly identified someone as a problem gambler and a negative -problem gambler. When
we have four metrics to quantify the quality of the output:
True Positive: The correct identification of a problem gambler. True Negative: The correct identification of a non-problem gambler.
False Positive: The incorrect identification of a non-problem gambler as a problem gambler.
False Negative: The incorrect identification of a problem gambler as a non-problem gambler.
In this report, these results are presented as a rate. This enables us to understand the proportion of problem gamblers/non-problem gamblers that would be identified (either correctly or incorrectly). The rates are defined as:
True Positive Rate (TPR) True Negative Rate (TNR) False Positive Rate (FPR)
False Negative Rate (FNR)
The objective of the predictive model is to maximise the true positive and true negative rates while minimizing the false positive and false negative rates. It is useful to note that there is a relationship between the rates, such that:
True Positive Rate = 100% False Negative Rate True Negative Rate = 100% False Positive Rate
As these variables are related, if we achieve a high true positive rate we also have a low false negative rate.
In Report 2 of this research programme, and also in other problem gambling literature, definitions using the terminology introduced above:
Sensitivity = True Positive Rate Specificity = True Negative Rate
Model Development Approach
To process of turning raw data into a predictive model takes a number of defined steps. This process is described below:
1. Data Validation and Preparation In this step, the received data was validated to ensure it is consistent with expectations (e.g. the format, number of records, etc.) and converted into a common format so that the data from each supplier could be analysed as a whole, rather than independently. In this step the proxy session algorithm was also used to assign individual machine events to a player session.
2. Variable Calculation In this step, a number of session and player level variables were calculated. The majority of the variables calculated were based on the theoretical makers of harm identified in Report 1. Analysis of each of the variables is provided in Appendix B of this report.
3. Data Pre-processing In this step the variables were transformed using a number of approaches to help the predictive models distinguish between different types of behaviour. More detail of these transformation approaches are provided below.
4. Dataset Selection When verifying or testing a predictive model it is
important that the data used to build the model is not included. The entire data is therefore divided into three separate datasets for training, verification, and testing. Depending on the analysis, players or sessions were randomly allocated to the different datasets. In this research project, the training dataset contained 50% of the data, and the remaining data was allocated to both the verification and test datasets, which received 25% each.
5. Model Training In this step, the predictive modelling algorithms analyse the available data and determine which player patterns are most likely to relate to the target variable: in this case, our problem gambling label. In this process a number of models were generated, relating to different algorithms, parameters for those algorithms, input data, and transformations to the data. A range of predictive modelling algorithms used by RTI is described in Appendix D. 6. Model Validation Within the data validation phase, we examined all of the
predictive models which had been trained to see which had the best performance on the validation data set.
7. Model Testing To confirm the accuracy of the model and to help understand its capabilities, it was testing on the final test dataset.
8. Cross validation Finally, to ensure that the original random allocation of data repeated the training and testing phases using the model specification that delivered the best accuracy. The details of the validation process was a 10-fold cross validation. Cross validation is the process whereby the data is of positive and negative examples. K-1 buckets are then used to train the model and then the accuracy of the model is tested on the remaining bucket. testing.
The process described above has been designed to avoid one of the key issues of
-number of input variables, such as were present in this research project.
The concept of over-fitting when building a predictive model relates to the performance of the model when it is applied to new data that was not used in the training process.
Ideally, when a model is built it will learn patterns which define a generalised relationship between the inputs (gambling data) and the target output (problem gambling). When generalised relationships are identified the model should produce consistent performance across the test data and new data as it is processed. In exist only within the training data. The model is then expecting to see these same performance will be impacted.
Target Variable
In this report we examine two different outcomes: Whether someone is a problem gambler
Whether a session of play comes from a problem gambler.
To define a problem gambler, we are utilising the Problem Gambling Screening Index obtained from the survey results in the loyalty card data. Participants in the survey who
-in the survey and how the score is derived is provided -in the follow-ing section. Determining whether someone is a problem gambler is important for understanding the utility of using loyalty cards to collect data across multiple gambling sessions. To determine whether someone is a problem gambler we have analysed all of the data associ
measure the accuracy of this prediction, we compare the predicted label to the actual label for that player.
Determining whether a session comes from a problem gambler is important for understanding how well problem gambling can be identified when a loyalty card is not used. A majority of the data currently being generated by the gaming machines is not linked to a loyalty card, highlighting the need for this analysis. To determine whether a session of play comes from a problem gambler we analyse the activity associated with that session and generate a single prediction. To measure the accuracy of this
prediction we compare the predicted label to the problem gambling label for the player who generated the session. The limitation with this approach is that we are making an assumption that every time a problem gambler plays on the machines they are exhibiting problem gambling behaviours.
Data Pre-processing
Before producing the predictive models, a number of pre-processing tasks were tested to see if they could improve the performance of the model. The pre-processing tasks involved transforming the input values so that they could be compared in different ways. This is often required, as it is in our case, when there is a non-linear relationship
between the input data and what is being predicted. As an example, a £2 increase in stake might have a different predictive ability if the increase is from £2 to £4, compared to an increase from £20 to £22. This effect is further confounded in our case where the data is highly skewed with a small number of significant outliers.
A range of transformations have been tested in the model building process. Each of these is listed below with a brief explanation:
Unmodified No modification is made to the underlying variable and it is fed directly into the model.
Absolute Value When a variable takes on negative and positive values, the absolute value can be taken to reduce the range from zero to a positive
can be taken to change the meaning of the value. For instance, if a player has three sessions with net expenditure of -£200, -£5 and £250, taking the absolute value transforms this data to £200, £5 and £250. For the original data set we could interpret this as two losing sessions and one winning session. With the transformation the interpretation changes to one session with minimal change in financial outcome and two sessions with a large change in financial outcome.
Winsorized This is a process where extreme values or outliers are removed from the output to prevent those values from dominating the patterns learnt by the model.
Log For variables where there is a large number of samples that take on small values, and there is a small number of samples which take on high values, taking the log of these values can provide a more informative scale for a predictive algorithm. As an example, if we had the raw values 10, 100, 1000 and 3 as inputs into the predictive algorithm.
Zero Indicator For variables that have dominating proportion of zeroes (e.g. number of games at the highest stake, amount won in a session, etc.), the
hat has a category for zeroes, and the rest of the values are aggregated based on the quartiles of the remaining data.
Grouped This is the process where a variable which can take on many values (such as the amount won on a game) is reduced down into a smaller number of groups (such as a small, medium and large win). In statistics, this
Model Complexity vs Model Information
When building a predictive model, there is often a trade-off to be made between the underlying complexity of the patterns and the degree of explanation that can be extracted from the model. In this research, we have used a hierarchy of models based on different predictive algorithms that will lead us to a more accurate separation between problem and non-problem gamblers.
Measuring Model Performance
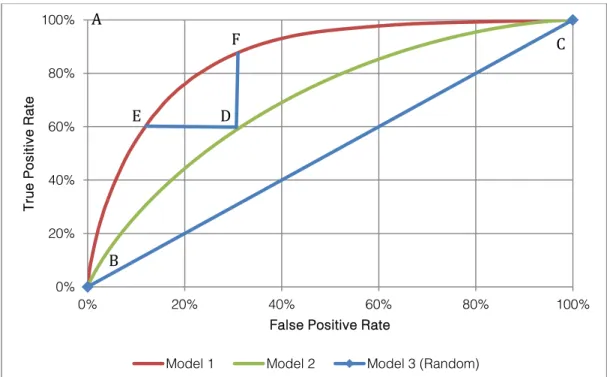
To understand the performance of the predictive models we have used the Receiver Operator Characteristic (ROC) Curve. The ROC curve was first used in World War II for the analysis of radar signals and today is commonly used to evaluate the performance of machine learning techniques. Figure 4 provides an example ROC curve with the performance of three models included. The false positive rate is plotted on the
horizontal axis and the true positive rate is plotted on the vertical axis. This enables us to compare the performance of correctly identifying problem gamblers (the true positive rate) against the impact of incorrectly identifying non-problem gamblers as problem gamblers (the false positive rate). The points on each of the curves correspond to the performance of the model at different thresholds. A threshold is used to make the discrimination between a problem and non-problem gambler (e.g. players scoring higher than the threshold are labelled as problem gamblers). The higher thresholds are on the left of the curve, and decrease as you follow each of the curves to the right. In an ideal world, we would produce a model as close to possible to point A in the figure. Generating models that perform near this point is very rare. This is a model operating position which has a true positive rate of 100% and a false positive rate of 0%, perfectly distinguishing between problem and non-problem gamblers. At points B and C, we are operating at the two extremes of either predicting everyone to be a non-problem gambler (point B) to predicting everyone to be a problem gambler (point C). Model 3 has been included in this diagram to show what would be achieved by just measuring the accuracy of a models whose output was a random guess. If a model has a similar performance to Model 3, it shows that the input variables could not be used by the predictive modelling algorithm to make an informed prediction. Ideally, we want our models to deliver a performance as far away from this as possible. Models 1 and 2 are two models that are able to make informed predictions. In this case Model 1 is outperforming Model 2. This can be seen in the figure as the curve corresponding to Model 1 is higher than the curve for Model 2.
By having Model 1 and 2 on the same ROC curve it is possible to see the impact of the improved accuracy between the models. If previously we had been using Model 2 to identify problem gamblers, we could have decided to operate at point D. By looking at the vertical and horizontal axes we can see that this point generated a true positive rate of 60% and a false positive rate of 30%. That is 60% of the problem gamblers where correctly identified and 30% of our non-problem gamblers where incorrectly identified as problem gamblers.
If we now want to move to our more accurate Model 1, we have two choices. Firstly, we could decide to move to point E. This would enable us to identify the same proportion of problem gamblers (60%) but instead we would reduce the incorrect classification of non-problem gamblers from 30% to 10%. Alternatively, we could decide to move to point F. This would enable us to keep the same false positive rate (30%), but we would be correctly identifying a higher proportion of problem gamblers (improving from 60% to 90%).
Alternatively, it would be possible to trigger one intervention for customers that have a score at or above point E (where we are more confidently identifying problem gamblers) and then a second, potentially softer intervention for customers who fall between the boundaries of points E and F.
Finally, to compare the different models it is useful to have a single figure which describes their performance. In this report we have used the Area Under the Curve (AUC) metric. This value ranges from 1 (a model which produces no errors) to 0.5, the performance of Model 3. In our example, Model 1 has an AUC value of 0.85 Model 2 has an AUC value if 0.70.
Figure 4 Example Receiver Operator Characteristic Curve 0% 20% 40% 60% 80% 100% 0% 20% 40% 60% 80% 100% Tr ue P os it iv e R at e
False Positive Rate
Model 1 Model 2 Model 3 (Random)
A
B
C
D
E
F
Data
In this section, a description of the data used to complete this research is provided. This covers both the data obtained from the industry along with the loyalty card survey
One key conclusion about the data used as part of this project is that although it is significant in volume (over 9.5 billion individual gaming machine events3), the breadth of the variables in each of these events is limited. For each event we only know the time when the event took place, the location where it took place, the type of event (cash in, cash out, bet, win), the game being played, and the value of the transaction (e.g. the amount staked or the amount won).
Industry Data
The data used to generate this report was supplied by the five major Licensed Betting Offices in the UK (Betfred, Coral, Ladbrokes, Paddy Power and William Hill), and their gaming machines suppliers (Inspired Gaming and Scientific Games). The relationship between the LBOs and the gaming machine suppliers is shown in the table below: Gaming Machine Supplier Licensed Betting Offices
Inspired Gaming 1. Betfred
2. Paddy Power 3. William Hill
Scientific Games 1. Coral
2. Ladbrokes
Data Request
Timeframe
The time period covered by the data used in the research is 10 months from 1 September 2013 to 30 June 2014. For the initial evaluation on the suitability of the available (1 September 2013 to 30 November 2013).
It is important to note that the initial sample of loyalty card holders to survey was drawn from the first 3 months of data used in the evaluation phase.
Data Attributes
The primary set of data requested from the industry (where available) was: 1. Players The attributes recorded for each registered player.
2. Shops The attributes for each store which contains a Gaming Machine, 3. Machine Events The transactional data captured on each Gaming
Machine, for example: records relating to players putting money in and taking money out of the machine, placing bets, and associated winnings.
3 A machine event refers to action which is recorded on the machine, such as a note
4. Games The games available on each Gaming Machine, in particular the legal category of the game, the type of game, and the theoretical RTP (Return to Player) at different stake levels.
The secondary data request was also comprised of:
1. Payment data Transactions relating to debit card transactions (both failed and successful) which are used to fund activity on the machines. 2. Self-Exclusion Registered players who have self-excluded.
3. Player Limits Registered players who have specified limits on their play. 4. Responsible Gambling Any information relating to players
receiving/viewing literature related to problem gambling. 5. Online Transfer
account.
6. Sports Trading Data The number of bets, turnover and winnings per day per shop.
7. Customer Contact Data associated with contact with registered players, e.g. marketing material, complaints, etc.
8. Promotions Data relating to player bonuses, free bets, etc. 9. Player Surveys Info
players.
10. Market reviews Reports and literature relating to the impact of promotions.
Data Received
Featurespace received varying levels of granularity in the data from each of the operators based on the underlying sophistication of their Gaming Machine offering. Rather than detail the specifics of the data received from individual operators, general parameters are listed below. Overall, we received data relating to:
333,091 uniquely identifiable customers4 8,289 unique shops
32,650 unique Gaming Machines
9,550,448,367 analysed machine events, including 6,768,053,704 bets 661 different games5
Specifically for the surveyed customers we had 3,988 loyalty card holders
4,374 unique shops that these players gambled at 524,277 gaming machine sessions
35,668,298 bets placed
4 This does not mean that the study corresponds to 333,091 individuals. An individual
person may have relationships with more than one operator or may have used different loyalty cards during the three month period.
5 This is the number of unique games across the suppliers, but they may have very
similar games across both (e.g. Roulette will be included twice, once for its Inspired Gaming implementation and once for its Scientific Games implementation).
Some important notes about the received data:
During the period for which we obtained data, Betfred did not operate a loyalty scheme. Therefore no Betfred customers were included in the loyalty card survey.
During the initial 3 months for which data was requested, Coral did not operate a loyalty scheme but had an internal system for recording repeat activity of customers. These labels have been included when calculating the between session metrics for the evaluation of the industry data. No Coral customers were included in the loyalty card survey.
Paddy Power and William Hill introduced their loyalty card schemes in 2014 and therefore some of the behaviours associated with the early period of received data may not be indicative of long term customer usage. The loyalty scheme used by both Paddy Power and William Hill collects minimal information about the player (e.g. only their mobile phone
and/ on registration,
so are not guaranteed to be accurate.
After receiving the data, Featurespace transformed the data from the gaming machine suppliers and the operators into a common format so that data could be used to calculate metrics across the entire data set.
Data Quality
In general, no significant data quality issues have been identified that would invalidate the results produced as part of this research. Minor issues were experienced, and a brief description is provided below. In most of the cases, we have been able to either work around the issue or have excluded the problematic data from the analysis. In future research, resolving these data issues may enable the performance of the predictive models to be improved.
Debit Cards It was known at the start of the project that there was not a precise method for matching transactions on the gaming machines to debit card transactions recorded by the electronic point of sale systems. A precise match is not possible as these two systems work independently. After a player has made a deposit, either the full or partial amount is manually transferred onto the machine by a member of staff. To identify debit card occurred in the same shop, at approximately the same time and for
approximately the same value. This requirement to search introduces a degree of error within the data.
Online Transfers We needed to further clarify with the operators how the transfers between funds used on the gaming machines to online accounts can be accurately matched. Within the
time-explored.
Operator and Supplier Data Matching We have experienced issues with matching identifiers for players and shops in the data supplied by the machines suppliers and the operators. This meant for a small subset of the data a full set of attributes could not be obtained.
Timestamps We were made aware by one of the suppliers that they experience errors with the timestamps associated with the recorded machine of the research presented in this report.
It is also worth noting that some attributes are likely to be over-represented by loyalty card
contextual research completed as part of the overall research program, we know that approximately one in three individuals has multiple loyalty cards. However, and more importantl
when they play on the machines so we are only capturing a portion of their gaming machine activity.
Survey Data
To complete the data set required to undertake the research, the Loyalty Card Survey data generated by NatCen was merged with the industry data. Full details of the survey process and a complete analysis of the survey data is provided in Report 2.
The most important component of the loyalty card survey data that is used in this report is the Problem Gambling Screening Index (PGSI). The Problem Gambling Screening Index is generated by asking the following nine questions to the loyalty card holder about their gambling activity over the last 12 months:
1. How often have you bet more than you could really afford to lose?
2. How often have you needed to gamble with larger amounts of money to get the same feeling of excitement?
3. How often have you gone back another day to try to win back the money you lost?
4. How often have you borrowed money or sold anything to get money to gamble?
5. How often have you felt that you might have a problem with gambling? 6. How often have people criticized your betting or told you that you had a
gambling problem, regardless of whether or not you thought it was true? 7. How often have you felt guilty about the way you gamble or what happens
when you gamble?
8. How often has your gambling caused you any health problems, including stress or anxiety?
9. How often has your gambling caused any financial problems for you or your household?
For each question the participant can select from the answers in the table below. The table also shows the score associate with each response.
Response Score
Almost always 3
Most of the time 2
Sometimes 1
Never 0
Table 1 - PGSI Question Responses and Scores
To generate the PGSI score, the individual scores from the responses to the questions are summed together. The possible range of PGSI scores therefore ranges from 0 to 27. The PGSI specification has provided thresholds with which to label different severities of gambling related risk as listed in Table 2. This table also shows the number of survey participants that fall into each category.
Gambler Types PGSI Score Survey Participants
Problem Gambler 8 or above 951
Moderate Risk Between 3-7 1025
Low Risk Between 1-2 923
Non-Problem Gambler 0 1089
Table 2 - Gambler Types as defined by the PGSI Score and the number of survey participants that fall into each category.
Proxy Sessions
The gaming machines operated by the LBOs in Great Britain to do not require a player to insert their loyalty card before they begin playing. It is possible for the player to insert or withdraw their card at any point of their session. Therefore if a session is only defined during the period when the card was actually inserted, it is possible for some player activity to be excluded from our analysis. To overcome this problem, an algorithm was developed to predict when sessions started and ended on the machine. A session generated by this process is referred to as a proxy session. A loyalty card player is then associated with each proxy session where their card was inserted for at least one event within the calculated proxy session.
Using a proxy session to identify player sessions has limitations but on the whole we research. While full details of how the proxy sessions are determined is provided in Appendix A, the key variables used in this process are the balance of the machine, the time since the last event on the machine and the type of event taking place. For example, a cash-in event is more likely to indicate the start of a session than is a stake event.
Measurement of Harm Markers
The first step in this research programme generated a list of the many theoretical markers of harm or patterns of play that might indicate that someone had problems with their gambling. The evidence review suggested that these were all plausible but it wa
patterns look like. The second step of the research program was to complete a preliminary analysis of industry data to see if it was possible to calculate these metrics from industry data and if these metrics showed sufficient statistical variance to suggest that by applying predictive modelling we would be able to distinguish between harmful and non-harmful play.
The preliminary data analysis contained 2.6 billion data records of gaming data from the period 1 September 2013 to 30 November 2013. The markers in this report are broken down into two categories
term behaviour across multiple gaming sessions; and 2) within session markers which
From this preliminary analysis we did find that it was possible to calculate a large proportion of the metrics and that they demonstrated sufficient statistical variance to give us confidence that predictive modelling would be successful.
A summary of the characteristics found for each of the markers is provided below. A full description of this analysis is provided in Appendix B. Within the scope of the
preliminary session we also examined the representativeness of registered sessions (where a loyalty card is present) compared to unregistered sessions (where a loyalty card is not present). We found that registered sessions
over-sessions, in that they are often longer and involve more money and bets. A full description of this analysis is provided in Appendix C.
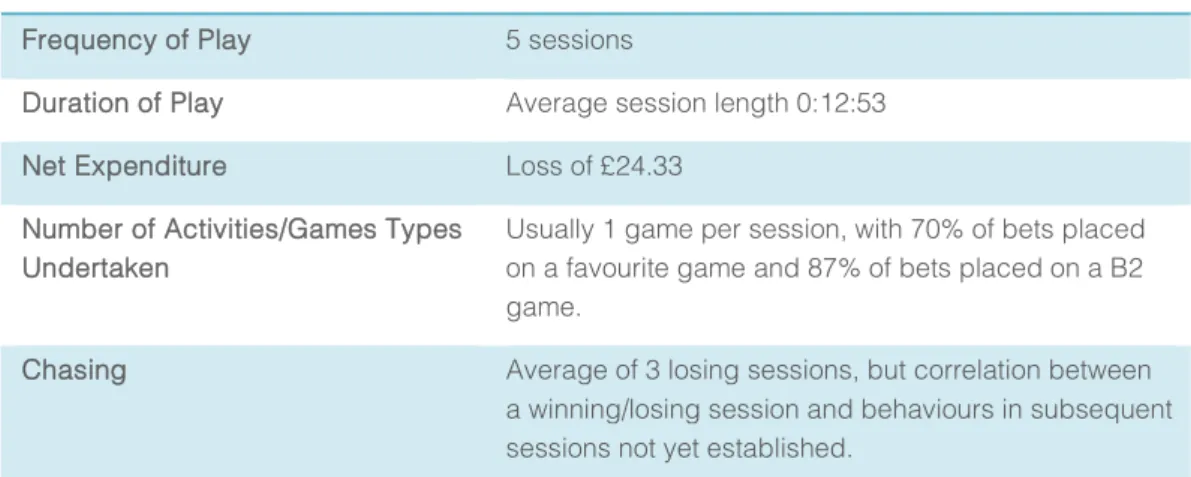
Between-Session Markers
These metrics included frequency and duration of play, net expenditure, levels of play engagements, number of activities/games types undertaken, and chasing. Based on these metrics, we can construct a view of the behaviour of a typical player compared to that of a 90th percentile player (those who experience the most losses). This provides a snap-shot view of both average and extreme play. Use of player loyalty cards, some of which are employed only once, impacts the calculation of these figures downwards so that values may seem low.
Marker Results for a typical player in a 3-month period Frequency of Play 5 sessions
Duration of Play Average session length 0:12:53
Net Expenditure Loss of £24.33
Number of Activities/Games Types Undertaken
Usually 1 game per session, with 70% of bets placed on a favourite game and 87% of bets placed on a B2 game.
Chasing Average of 3 losing sessions, but correlation between a winning/losing session and behaviours in subsequent sessions not yet established.
Table 3 - Values for the Between Session Markers at the median.
Marker Results for variables at the 90th percentile in a 3-month period
Frequency of Play 40 sessions
Duration of Play Average session length 1:08:06
Net Expenditure Loss of £776.09
Number of Activities/Games Types Undertaken
Usually 3 unique games per session and 17 unique games over the entire period
Chasing Average of 26 losing sessions, but correlation between a winning/losing session and behaviours in
subsequent sessions not yet established
Table 4 - Values for the Between Session Markers at the 90th percentile.
Examination of these markers has revealed:
A majority of the players exhibit minimal values (such as low values of stakes, session length and games played). For example, a typical player plays 5 times a month, while only 1 in 10 will play 40 times a month. The median player loss is £24.33 over a three month period, whereas 1 in 10 will lose £776.09.
For all metrics, there are minimal circumstances where metrics have extreme values. For some of these cases it is difficult to determine exact usage: the card may be used by one person, or shared, or mistakenly left in the machine. For most of the variables we generally see an exponential distribution as the values increase. This means that small values are very common and large values placed a long way from the average are very rare. In other words, values around 15 are five times more common than values around 25, and values around 25 are 5 times more common than those around 35.
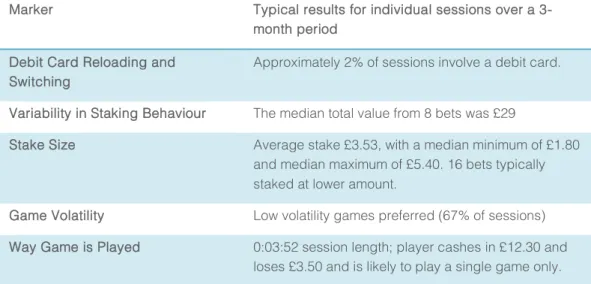
Within-Session Markers
These metrics included debit card reloading and switching, variability in staking behaviour, stake size, game volatility, and the way a given game is played. Again, we can construct views of a typical and a 90th percentile player based on these metrics.
Marker Typical results for individual sessions over a 3-month period
Debit Card Reloading and Switching
Approximately 2% of sessions involve a debit card.
Variability in Staking Behaviour The median total value from 8 bets was £29
Stake Size Average stake £3.53, with a median minimum of £1.80 and median maximum of £5.40. 16 bets typically staked at lower amount.
Game Volatility Low volatility games preferred (67% of sessions) Way Game is Played 0:03:52 session length; player cashes in £12.30 and
loses £3.50 and is likely to play a single game only.
Table 5 - Values for the Within Session Markers at the median.
Marker Typical results for individual sessions at the 90th percentile over a 3-month period
Debit Card Reloading and Switching
Approximately 2% of sessions involve a debit card.
Variability in Staking Behaviour The median total value from 86 bets was £400 Stake Size Average stake £21.18, with a minimum of £10.00 and
maximum of £37.60.
Way Game is Played 0:23:36 session length; player cashes in £100.00 and loses £60.00 and is likely to play a single game only.
Table 6 - Values for the Within Session Markers at the 90th percentile.
For the Within Session Markers, player behaviour for both typical and 90th percentile players has been constructed for those markers where results were conclusive. In summary
Again, the majority of players exhibit minimum values for most variables. A typical player places 8 bets over a session totalling £29 in stakes, while only 1 in 10 players will place 86 bets totalling £400 over a session. Examination of stake size strengthens this observation: a typical stake for the majority of players is £3.53, or at most £5.40, while 1 in 10 players will stake £21.18, or a maximum of £37.60. By examining over 80 variables and the range of values observed for each, Featurespace was able to construct a very detailed picture of the variety of activity possible within the machines. This means that, for a large majority of the variables
measured for each of the markers, there is sufficient variation which enables the behaviour of sessions to be differentiated and characterised.
In summary, we successfully demonstrated in this preliminary analysis that: It is possible to use industry data to measure markers of theoretical harm The distribution of values derived from these markers shows potential for being able to differentiate between harmful and non-harmful gaming machine play.
Data Analysis Results
In this section results are presented in three main parts:
1. Baseline We establish baseline models so we can use this to compare our new predictive models against, measuring how well they perform in predicting problem gamblers or problem sessions.
2. Player Analysis We present predictive models developed to identify whether someone is experiencing gambling problems or not
3. Session Analysis We present predictive models showing whether a session is likely to be from a problem gambler or not.
4. Additional experiments We present the results of further investigations into the data to understand what elements of the problem gambling are more predictive than others.
A discussion of the results is contained in the next section.
-problem gambler. Therefore a true positive implies the correct identification of a problem gambler and a false-positive implies the incorrect classification of a non-problem gambler as a problem gambler. Likewise, a true negative implies the correct identification of a non-problem gambler and a false-negative implies the incorrect classification of a problem gambler as a non-problem gambler.
When contextualising the results presented, it is important to remember that the players analysed in this research represent a heavily skewed subset of very engaged loyalty card holders. Therefore the performance of the models is conservative, and if models of this type are operationalised higher accuracy rates would be expected.
Baseline
To be able to interpret the results of the analysis a baseline is required with which a comparison can be made. The baseline has been established using principles from the Code of Conduct rolled out by the Association of British Bookmakers (ABB) in March 20146.
This Code itself consists of multiple elements of harm minimisation, one of which is reiterated here:
Providing customers with new tools such as mandatory time and money based reminders, the ability to set spend and time limits on gaming machines and to request machine session data;
have been set when a player exceeds £250 of spend or 30 minutes of session length.
Spend is defined as the total amount of money which has been deposited into the -up is generated, but the player can still continue playing. In the remainder of this subsection we define a player to have received this intervention if they experience this mandatory pop-up.
refers to the total amount of cash that has been loaded into the machine. In the figures below we will refer to Cash-In rather than spend so that is consistent with the
terminology used throughout the report.
The selection of this Code as a baseline is advantageous as it has been implemented with the same gambling products and environment in which this analysis took place. It is acknowledged that the Code of Conduct was derived from best practice rather than a quantitative analysis similar to that which has been conducted as part of this research programme. Furthermore the analysis performed on the Code is not intended as an evaluation of the C
-in-the-Featurespace have been engaged by the Responsible Gambling Trust in a separate project to complete an early impact study of the Code. The outcome of this evaluation will be published after the release of this research.
The baseline has been established on both a player and session to match the two types of models described in this report. For both models we have examined the performance of session cash-in and length, independently and in combination. When combining the two variables, Logistic Regression has been used to produce a single score to which a threshold can be applied to distinguish between problem gamblers and non-problem gamblers.
There are also some key differences to bear in mind when reviewing the results below in the context of the ABB implementation:
The player baseline figures are based on average values over all of the essions. The ABB pop-up is triggered when one session goes above the £250 limit. As an example, if a player had two sessions, one at £200 and the other at £275 the average cash in value would be £237.50. In our baseline analysis it would be inferred that this player would not receive the pop-up, when in fact they would have received the pop-up on one of their sessions. The session baseline figures look at the results of each session independently and therefore report on the percentage of sessions that would receive the pop-up message. Within this analysis presented it is not possible to infer the proportion of problem gamblers that received the pop-up. For example it might be possible that a higher proportion of problem gamblers triggers the pop-up, just which
Each of these points can be further clarified within the scope of the data available, but this analysis is outside the scope of this particular report. The subtle nuances of the implementation of the baseline and its interpretation are important to understand when contextualising the results presented in this report.
To benchmark the analytical models developed we will look at comparative detection rates of the new models compared to the baseline (e.g. we will be able to see how many more problem gamblers could be detected at the same false positive rate). As each model to enable an immediate comparison. Models that generate higher AUC values are more accurate than those with lower values.
Player Baseline
To generate the baseline model for players we initially looked at the session cash-in value and its predictive power. We then took the second element, session length, investigating its predictive power. Finally the two elements were combined to see what performance could be obtained.
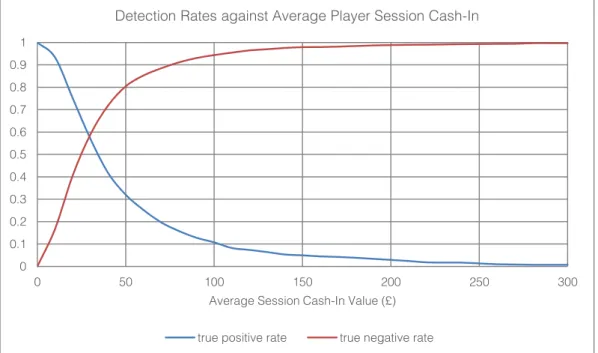
To investigate session cash- -in amount
over the entire length of their available history. Figure 5 shows the true positive and true negative rates for different average session cash-in values. This figure enables us to assess the accuracy of correctly identifying problem (the true positive rate) and non-problem (true negative rate) gamblers at different threshold values. To obtain the best performance for this model, we want the two detection rates to be at the highest this is the point where the lines cross. The cross over point is a useful metric to compare the predictive power of individual variables. For this variable, the cross-over point occurs at a detection accuracy just below 60% and for an average session cash-in value of £30.
Figure 5 Analysis of average Session Cash-In to identify problem gamblers.
The mandatory limit set by the ABB of £250 shows that 1.3% of problem gamblers would receive the pop-up and 99.2% of non-problem gamblers not receive the pop-up, however 0.8% of the non-problem gamblers would receive the pop-up. In contrast if a threshold of £100 was selected the proportion of correctly identified problem gamblers would increase from 1.3% to 10.7% the proportion of correctly identified non-problem gamblers would reduce from 99.2% to 94.3%. Therefore this means that we are able to accurately identify more problem gamblers, but at the same time we are also incorrectly labelling more non-problem gamblers as problem gamblers.
The next step in looking at the baseline model for players was to examine session length. This is shown in Figure 6. In this case we see that mandatory threshold of 30 minutes identifies a higher proportion of problem gamblers (14.5%), however a lower proportion (86.4%) of non-problem gamblers would avoid being treated, giving rise to a 13.6% false positive rate. The cross-over point for this variable occurs at around 13 minutes, but at a much lower overall detection rate compared to the average session
0 0.1 0.2 0.3 0.4 0.5 0.6 0.7 0.8 0.9 1 0 50 100 150 200 250 300 Average Session Cash-In Value (£)
Detection Rates against Average Player Session Cash-In
cash-in amount as presented above (60% compared to 55%). This tells us that average session cash-in is a better indicator of problem gamblers than session length.
Figure 6 Analysis of the average session length to identify problem gamblers.
So far we have looked at the performance of each measure individually, whereas logistic regression allows us to look at them together. This is shown in Figure 7. The Logistic Regression model produces an output between 0 and 1. The selection of a threshold will produce the detection rates as shown by this figure. The cross over point for this model is at the detection rate of 60%, this shows that be combining the session length variable with the total cash-in variable there is no improvement to our model performance. 0 0.1 0.2 0.3 0.4 0.5 0.6 0.7 0.8 0.9 1 0 10 20 30 40 50 60 Time (minutes)
Detection rates and Average Session Length
Figure 7 - Analysis of using average session cash-in and average session length in a predictive model to identify problem gamblers
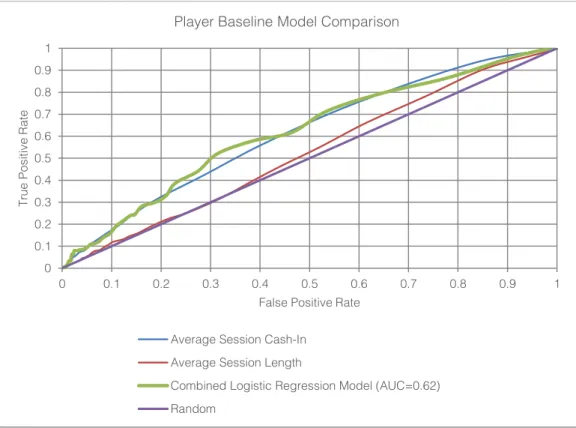
Now we have developed three different player baseline models. These can be compared by plotting the false positive rates for each model against the true positive rate, see Figure 8. As a reminder, the objective is to get the models to be as close to the top left hand corner of the chart as possible. Figure 8 shows that the average session total cash-in variable performs better than the session length variable, which is only performing marginally above the random model. By combining these two variables in our logistic regression model we only get a marginal uplift in performance compared to just using the average session cash-in variable alone.
It is useful in this example to point out how the ROC curve can be used to assess the performance of the models and the trade-offs which need to be made. In the analysis above we concluded that average session total cash-in variable was very similar to the combined Logistic Regression model. The ROC curve corroborates this finding, but it does show that the Logistic Regression model has a marginal increase in the true positive rate in the lower range of false positive rates (between 20% and 40%).
0 0.1 0.2 0.3 0.4 0.5 0.6 0.7 0.8 0.9 1 0 0.1 0.2 0.3 0.4 0.5 0.6 0.7 0.8 0.9 1 Logistic Regression Score
Detection Rate Baseline Logistic Regression Player Model
Figure 8 - Comparison of Baseline Player Models 0 0.1 0.2 0.3 0.4 0.5 0.6 0.7 0.8 0.9 1 0 0.1 0.2 0.3 0.4 0.5 0.6 0.7 0.8 0.9 1 T ru e Pos it iv e R a te
False Positive Rate
Player Baseline Model Comparison
Average Session Cash-In Average Session Length
Combined Logistic Regression Model (AUC=0.62) Random
Session Baseline
Now that the player baseline model has been developed, we use the same principle to develop a session baseline model. For the session model we are now measuring our accuracy of determining if the session is generated by a problem gambler or not. As each player has generated many sessions we are making many more predictions. It is expected that the performance of a session model will be less than that of the player model as although the session may be from a problem gambler, they might not exhibit any problematic play in each session that they play.
-in amount. Figure 9 shows the true positive and true negative rates based this variable. From the figure we can see that at the ABB limit of £250, 4.0% of problem gambler sessions would receive the intervention and 97.4% of non-problem gamblers would avoid the intervention. The point of cross-over between the two rate curves is just above 50% indicating that this variable has minimal discriminating between problem and non-problem gamblers.
Figure 9 Session Cash-In
The next step in building our session baseline model is to look at session length. The performance of this variable is shown in Figure 10. At the ABB limit of 30 minutes 12.9% of problem gambler sessions receive the intervention and 87.1% of non-problem gambler sessions avoid the intervention. Again the cross-over point between the two rate curves is only marginally above 50%, indicating minimal discrimination between the two categories of players.
0 0.1 0.2 0.3 0.4 0.5 0.6 0.7 0.8 0.9 1 0 50 100 150 200 250 300 Value (£)
Detection Rates and Session Cash-In
Figure 10 Session Length
investigate their combined predictive power. The performance of this model is shown in Figure 11. Compared to the figures presented previously in this section, the true positive and true negative rate lines show a sharp jump between 0 and 1. This indicates that these variables provide limited discriminatory power. Using the logistic regression model to obtain the same true positive rate as the session length model (12.9%) a threshold of around 0.225 should be selected, this corresponds to a true negative rate of 89.4%, and this represents a 2.3 percentage point improvement.
0 0.1 0.2 0.3 0.4 0.5 0.6 0.7 0.8 0.9 1 0 10 20 30 40 50 60 Session length (minutes)
Detection Rates and Session Length
Figure 11 Logistic Regression Session Model
Now that we have our three models we can compare their performance. This is shown in Figure 12. This comparison shows that the accuracy of each metric is poor, only
Figure 12 - Comparison of Baseline Session Models
0 0.1 0.2 0.3 0.4 0.5 0.6 0.7 0.8 0.9 1 0 0.05 0.1 0.15 0.2 0.25 0.3 0.35 0.4 Score logistic regression
Detection Rate Baseline Logistic Regression Player Model
true positive rate true negative rate
0 0.1 0.2 0.3 0.4 0.5 0.6 0.7 0.8 0.9 1 0 0.1 0.2 0.3 0.4 0.5 0.6 0.7 0.8 0.9 1 Score RF global
Baseline Session Model Comparison
Session Cash-In Session Length
Combined Logistic Regression Model (AUC=0.52) Random