City University of New York (CUNY)
CUNY Academic Works
International Conference on Hydroinformatics
City College of New York
8-1-2014
An Artificial Neural Network-Based Rainfall
Runoff Model For Improved Drainage Network
Modelling
David Walker
Edward C. Keedwell
Dragan A. Savić
Richard Kellagher
Follow this and additional works at:
http://academicworks.cuny.edu/cc_conf_hic
Part of the
Water Resource Management Commons
This Presentation is brought to you for free and open access by the City College of New York at CUNY Academic Works. It has been accepted for inclusion in International Conference on Hydroinformatics by an authorized administrator of CUNY Academic Works. For more information, please
contactAcademicWorks@cuny.edu.
Recommended Citation
Walker, David; Keedwell, Edward C.; Savić, Dragan A.; and Kellagher, Richard, "An Artificial Neural Network-Based Rainfall Runoff Model For Improved Drainage Network Modelling" (2014).CUNY Academic Works.
11th International Conference on Hydroinformatics HIC 2014, New York City, USA
AN ARTIFICIAL NEURAL NETWORK-BASED RAINFALL RUNOFF
MODEL FOR IMPROVED DRAINAGE NETWORK MODELLING
DAVID WALKER (1), ED KEEDWELL (2), DRAGAN SAVIĆ (3), RICHARD KELLAGHER (4)(1-3): Centre for Water Systems, University of Exeter, United Kingdom. (4): HR Wallingford, United Kingdom
Urban dra inage catchment modelling is an important hydrological proble m that necessitates accurate runoff predict ion. This paper presents a model, based on an artific ial neural network and trained with an evolutionary algorith m, which ma kes accurate predictions of sewerage flow in urban catchments where the runoff is dominated by infiltrat ion proble ms . A range of input sets are e xa mined, the best of which is found to be a linear aggregation of antecedent rainfa ll and air te mperatures over a period of three months.
INTRODUCTION
Accurately modelling rain fall runoff is an important issue in hydrology. In order to be able to properly plan how to respond to extreme rainfall events and prevent floodin g, organisations must be able to predict the runoff that will result fro m forecast events. Urban drainage catchment modelling requires rainfa ll runoff models as a prerequisite and a variety of diffe rent runoff models can be used. These include the Wallingford Procedure Runoff [1] (i.e., PR Equation), the Ne w UK Runoff Model [2], and the SCS Method [3]. These methods are based on relative ly simp le procedures which have been shown to be reasonably robust in predict ing runoff. This paper takes an alternative approach to constructing a practical runoff model that will a llow for the co mple x inter-re lation of runoff that actually occurs fro m impermeab le a reas, local surface storage and variation in rainfall induced infiltration due to wet weat her responses. As an alternative to constructing physical models, v arious computational intelligence approaches have been used to predict model output, including artific ia l neural networks (A NNs) [4]. Apart fro m the uncertainties associated with th e actual measure ment of connected surfaces to an urban drainage system, the process by which runoff occurs is known to be non -linear, and ANNs are adept at pred icting such processes. They have been used to predict runoff in a number of natural catch ments (e.g., [5]) and in studies for predicting the performance of urban drainage systems (e.g., [6]). Th is paper proposes a model that uses an ANN trained to predict runoff in a system dominated by infilt ration. The A NN is a data-driven approach, in this case using information about various meteorologica l conditions (e.g., ra infa ll and air te mperature over time) as inputs and flow data as a single output to be predicted. The basic procedure for ma king predictions with an ANN is as follows. The network is trained on inputs for which the corresponding outputs (in this case, the a mount of runoff caused by the meteorologica l conditions at a given time) are known and validated on a further set of known e xa mp les that
were not used during training. The resulting model is called a blac k bo x model, as the inner workings of the ANN cannot be equated to the physical processes driving runoff. The goal of the study is to determine a set of inputs that produces sewerage flow predictions in urban catchments where the runoff is dominated by infiltration problems (due to high groundwater table and sewer condition), a ma jor issue for the water industry. As demonstrated by the results presented later in this paper, given an appropriate set of inputs an ANN is capable of predict ing runoff, thus avoiding many of the uncertainties involved in tradit ional runoff modelling. The results presented in this paper are for a site in the UK in which runoff is dominated by infiltration. The goal of the study is to demonstrate that an ANN is capable of modelling runoff in such an environment. The available data re lating to the case study site comprises of rainfall data, air te mperature and sewer flo w data. All data has been aggregated from their native frequencies to the hourly level, and is availab le over a period covering January 2010 to October 2012. The re are periods within th is range where measure ments were not recorded.
Figure 2: Ra infall events; rainfa ll is shown fro m the top and flo w runs along the bottom. The separation of the data into events is shown, and the numbers running along the centre of the plot show the event IDs.
The inputs used in this study are rainfa ll and air te mperature data. This data is separated into a set of 15 rainfa ll events that have been identified such that they contain contiguous measure ments (i.e. they have no missing data) and any intervening periods with missing data are e xc luded fro m study. Figure 1 illustrates the data, subdivided into rainfa ll events.
MODELLING RUNOFF WITH ANNS
The model proposed in this study is called RAPIDSLite, and is based on an earlier ANN mode l, RAPIDS [7]; it was specifica lly developed for modelling rainfa ll runoff. It consists of an ANN model wh ich is tra ined by an evolutionary algorithm (EA).
Neur al Ne twork Model
An ANN is a computational model based on the way in which the human brain processes informat ion [4]. It is a collection of neurons which are a rranged into layers. Neuron s in adjacent layers are connected by weighted edges. The model consists of an input layer, a h idden layer, and an output layer. The neurons in the hidden and output layer produce a signal that is calculated by taking a weighted sum of the inputs to the neuron:
(1)
Here, xd is an input to the node, and wkd is the edge between that input and the node. The bias
term is wk0. The output yk is then passed through an activation function:
(2)
RAPIDSLite e mploys the sigmo id function (Eq . 2) and, in this study, uses a single hidden layer of size H = 10. Va rious studies have used this architecture [5]. Since the aim is to predict total daily flow, the network consists of a single output.
Network Trai ning
The network we ights were tra ined with an EA. An EA is a population-based algorithm in which each candidate solution is an ANN model. The tra ining process seeks a set of weights that ma ximises the predictive quality of the model. Edge we ights are constrained to lie between -1 and 1, and are mutated with probability 1/P (P is the number of solution parameters , for P edges in the ANN) using an additive Gaussian mutation. The pred ictive quality of a network is evaluated with the mean absolute error (MAE) of the predictions for the tra ining data and the best solutions fro m the co mbined parent and ch ild populations are reta ined as the parent population in the ne xt generation. The EA is e xecuted for suffic ient generations to allow it to converge; this period was determined e xperimentally.
In order to p revent over training [8], whereby the model cannot generalise to new observations, a cross validation scheme is used. Given the set of E ra infa ll events, leave-one-out cross validation was used such that the model was trained E times on the fu ll set of tra ining data with one of the events omitted. This event was then used to test the data by using it as a set of previously unseen inputs.
EXPERIMENTAL S ETUP AND RES ULTS
One of the principal mot ivations behind this study is to identify a set of inputs that can be used to predict runoff. To this end, RAPIDSLite has been tested on a range of different inputs (varying the form of antecedent rainfall incorporated into the model). In the case of each experiment, the optimisation parameters remain fixed. The standard deviation σ of the mutation was 0.1 (co mputed from the Gaussian distribution from wh ich the mutations were drawn ). The EA operated with a population size µ = 5 and its runtime , determined e xperimentally, was 2,000 generations for da ily inputs and 10,000 generations for sub -daily inputs. In order to study the sensitivity of the mode l to d ifferent sets of inputs, each e xperiment was repeated 10 times so that the distribution of results could be evaluated. Experimental results we re evaluated using Nash-Sutcliffe Effic iency Coefficient (NSEC) [9], where the best possible score is 1 and would indicate that the model has perfectly matched the target values. NSEC scores of 0.5 or higher are generally accepted in the water industry, and in this paper scores of 0.8 or higher are sought.
Initial Results
Initia l e xperiments were conducted at the daily level with inputs describing ra infa ll and a ir temperature. The inputs for ra infall consisted of the current day value, as well as for the previous seven days, and aggregated inputs covering the 30 and 90 days prior to the current observation. Matching air te mperatures were used, making a total of 20 inputs.
Table 1: The para meters used in the three configurations of the initial e xperiments conducted. A ma rk indicates that a given input was included in the model tested under a specific option.
Curre nt ra inf al l P re vi ous 7 da ys ’ ra infa ll (7 input s) 30 da ys ant ec ede nt ra infa ll (1 i nput ) 90 da ys ant ec ede nt ra infa ll (1 i nput ) Curre nt a ir te m pe ra ture P re vi ous 7 da ys ’ ai r t e m pe ra ture (7 i nput s) 30 da ys a ir te m pe ra ture (1 input ) 90 da ys a ir te m pe ra ture (1 input ) Option 1 ● ● ● ● ● ● ● ● Option 2 ● ● ● ● ● ● Option 3 ● ● ● ● ● ●
Table 1 lists the inputs that were inc luded in each of the three in itia l configurations of the model. The first contains all of the inputs, while the subsequent two options omit the 30 and 90 day antecedent informat ion, in order to study the difference in quality ca used by long periods of antecedent rainfall and air te mperature data.
Figure 3: Bo xplots showing the distribution of NSEC results for the in itia l set of e xperiments. The results show that the model is reasonably insensitive to t he length of antecedent rainfa ll, although results for option 3 a re margina lly worse than those for options 1 and 2. A preliminary e xperiment omitting 30 and 90 days antecedent information entire ly produced considerably poorer results.
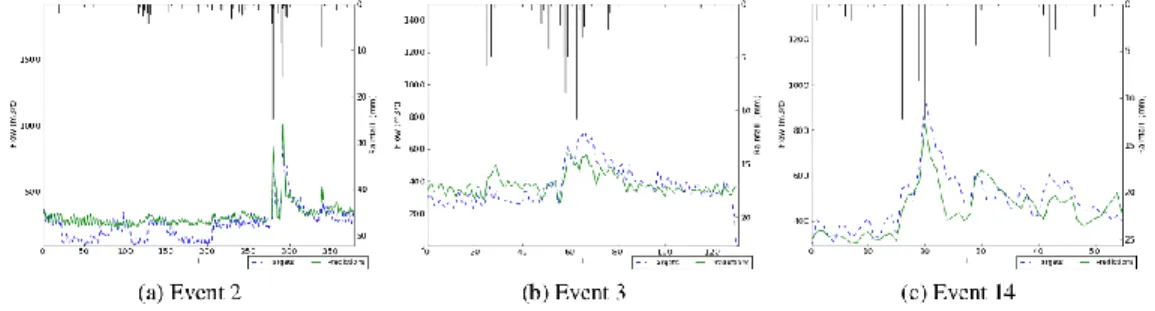
Figure 4: Hydrographs for e xe mpla r test events evaluated with a model developed under the set of inputs described by option 2.
Figure 3 illustrates the distribution of NSEC results of the 15 ra infall events for each of the first three model configurations examined. Each of the 15 bo xes in each experiment represents a single event, each of which was used as the training event 10 times in order to evaluate the distribution of results. NSEC results below -1.5 are o mitted fro m these plots. The configuration that yielded the most events with a mean NSEC of 0.5 or greater was option 2 (with 8 events), however it is difficult to say that there is a clear winner between the three options as the results are fa irly simila r. Opt ion 3 has the worst performance; the fe west events of the three options achieved a mean NSEC of 0.5 or greater, and two of the events are completely omitted as they are co mpletely be low the lower bound of -1.5. Exe mp lar hydrographs for option 2 are shown in Figure 3.
In the case of option 3, the model evaluated on event 2 again showed the best results; the model identifies the shape of the main peak in the flo w data, and its prediction of the peak’s magnitude is only slightly below that of option 2. As in Figure 3, the period of lo w flow in the first half of the event, where the model has over-predicted the amount of flow, is likely to be indicative of inaccuracies in the target data. In both events 1 and 9, the predicted flow va lues are much worse than those for event 2, with the model fa iling to match the shape, and in some case the magnitude, of the peaks. The significantly poorer predictions in these events, characterised by a lack of ra infall and compared to events with mo re rainfa ll on which pred ictions were much better, indicates that these events are affected by a dry weather flo w; results for these two events were systematically poor for a ll e xpe riments conducted in this study . This demonstrates the importance of selecting a set of inputs that completely represents the complete runoff generation process. In fact, the NSEC performance for these events throws int o question its suitability as a performance measure for this type of analysis; for low flows it tends to heavily penalise the algorith m, resulting in the values shown for events 1 and 9.
Sub-Daily Ti meste ps
Ra infall can occur within the daily frequency discussed so far. To de monstrate that the model can ma ke predictions at sub-daily timesteps, we perform a similar e xperiment to the daily simu lations described above, for 6-hourly inputs. The input set is as follows:
Figure 6: Event hydrographs for the sub-daily e xperiments.
1. Ra infall and a ir te mperature for the current timestep (2 inputs).
2. Ra infall and a ir te mperature for the previous 24 hours at 6-hourly intervals (8 inputs). 3. Ra infall and air te mperature for the three days preceding the 6-hourly inputs in (2) at
24-hourly intervals (6 inputs).
4. Summed ra infa ll and average air te mperature for the previous 90 days (2 inputs). The input set therefore has a total of 20 inputs. The para meterisation of the optimiser and the ANN configuration remains unchanged from the previous set of experiments , however, to cope with the increased number o f observations the model was trained for 10,000 generations. Figure 4 shows the distribution of NSEC values for the sub -daily e xperiments. As before, the model is capable of ma king predictions with mean NSECs of 0.5 or more, however perhaps the more interesting result is for events 1 and 9. As can be seen, the events (which the model fa iled to predict accurately in the da ily e xperiments) show an improve ment. A lthough they still represent poor results, the error is less severe indicating that the model is able to better predict events containing little flo w using sub-daily timesteps; optimising the ANN for longer may further imp rove the results . Figure 5 illustrates the hydrographs predicted by the sub -daily configuration. The quality o f the predictions in this case is poorer; this is to be e xpected, as the target hydrographs themselves are less smooth. That said, the genera l t rend has been identified, imply ing that further train ing may result in a better fit of the noisy target data.
Alternati ve Antece de nt Preci pitation as a Network Input
The previous section’s e xperiments incorporated the notion of antecedent rainfa ll into the model by means of aggregated rainfa ll va lues, for 30 and 90 days. An alternative is to use the norma lised antecedent precipitation index (NAPI) [10], formulated as follows:
(3) NAPI is incorporated into the set of inputs, replacing the summed antecedent rainfall inputs used in the previous experiments. Two sets of inputs are exa mined. Both of which include the current day’s rainfall and NAPI fo r the preceding 30 days. One of the options also contains an input describing rain fall for each of the 7 days leading up to the current observation, as was the case in options 1–3. The a ir te mperature inputs rema in the same as used in the previous e xperiment; the structure of the ANN and the para metrisation of the EA is unchanged from options 1–3 (running for 2000 generations). The NA PI decay coeffic ient k is set to 0.8.
Table 2 shows the inputs used in the two NAPI e xpe riments and Figure 6 illustrates the corresponding distribution of NSEC results for the two e xpe riments. The results for option 5 are comparable to those of options 1–3, however a re of slightly lower quality (the mean NSEC is 0.5 or greater for fewe r events than it is for those of option 2). Op tion 6, which o mitted the inputs relating to the previous 7 days rainfall, resulted in noticeably poorer results than for any of the input sets tested so far, with the model output simply pea king on days of peak rainfa ll. None of the events achieved predictions with NSEC scores greater than 0.5, indicating that the increased resolution close to the event is important, as was shown for the sub -daily input set. Figure 7 illustrates flow hydrographs for option 5. In each case, the predictions are a poorer match than those shown for earlier daily input sets. In particular, this configuration is unable to properly match the peaks of the true target signal, under o r over predicting in each case. Table 2: The para meters used in the two configurations of the NAPI e xperiments.
C u rr e n t ra in fa ll P re v io u s 7 da ys ’ ra in fa ll (7 in p u ts ) N A P I C u rr e n t a ir te m p e ra tu re P re v io u s 7 da ys ’ a ir te m p e ra tu re (7 i n p u ts ) 3 0 d a y s a ir te m p e ra tu re Option 5 ● ● ● ● ● ● Option 6 ● ● ● ●
Figure 7: NSEC results for the NAPI e xperiments.
Figure 8: Event hydrographs for option 5, the first of the NAPI e xpe riments.
Summary of Results
Co mparing the three types of configuration tested in this section, the best result is for the initia l configuration (under option 2, 8/ 15 events have NSEC greater than 0.5, co mpared to option 4 with 4/15 and option 5 with 6/15) in which antecedent rainfa ll info rmation is incorporated in the form of aggregated values (summed for ra infall and averaged for a ir te mperature) over a
significant period, such as the 90 days used in this study. Such an input set is capable of producing a model with co mparab le p redictive ability in other catchments, provid ing that the physical drivers of the runoff process itself a re not drastically different to that of the case study site used as an exa mple in this paper.
CONCLUS ION
This paper has demonstrated an ANN model for p redicting runoff in a system dominated by sewer infiltrat ion. The study compared various sets of inputs with the aim of determining a sensible input configuration, and, while they cannot be said to be a general set of inputs, those based on summed antecedent rainfall and averaged air temperature produced the best results, with the majority of the predict ions resulting in NSEC scores greater than 0.5. Models for other case study sites using such an input set should theoretically produce runoff predict ions of a similar quality to those shown for the case study used in this paper. Subsequent experiments with sub-daily inputs produced the interesting result that the prediction error of the model in the worst case was significantly reduced. Other input sets included NAPI values in the place of summed antecedent rainfall, and this was shown to be less effective for this case study.
REFERENCES
[1] Dept. of Environment, “Design and Analysis of Urban Storm Drainage – the Wallingford Procedure.” National Water Council (Water Authorities Association), (1981).
[2] National Engineering Handbook , Section 4, Supplement A, “Hydrology,” US Dept. of Agriculture, Soil Conservation Service, Washington, D.C., (1957).
[3] Ashley, R., Blank sby, J., Cashman, A., Jack , L., Wright, G., Pack man, J., Fewtrell, L. and Poole, A, “Adaptable Urban Drainage - Addressing Change in Intensity, Occurrence and Uncertainty of Storm Water (AUDACIOUS),” J. Built Environment, Vol. 33, No 1, pp70-84. (2007).
[4] Bishop C., “Neural Network s for Pattern Recognition”, Oxford University Press , (1995). [5] Minns A. and Hall M., “Artificial Neural Networks and Rainfall Runoff Models”,
Hydrological Sciences, Vol. 41, pp399-417, (1996).
[6] Lok e, E., Warnaars, E., Jacobsen, P., Nelen, F. and Almeida, M, “Artificial Neural Networks as a Tool in Urban Storm Drainage,” Water Science and Technology 36, pp101-109, (1997).
[7] Duncan A., Chen A., Keedwell E., Djordevic S. and Savić D., “Urban Flood Prediction in Real-Time from Weather Radar and Rainfall Data using Artificial Neural Network s”, Proc Weather Radar and Hydrology International Symposium, International Association of Hydrological Sciences.
[8] Tetko, I., Livingstone, D., and Luik, A., “Neural Network Studies 1: Comparison of Overfitting and Overtraining,” J. Chem. Information and Computer Sciences, Vol. 35, No. 5, pp826-833, (1995).
[9] Srinivasulu, S., and Jain, A., “A Comparative Analysis of Training Methods for Artificial Neural Network Rainfall Runoff Models,” App. Soft Computing, Vol. 6, pp295 -306, 2006. [10] R. Heggen, “Normalized Antecedent Precipitation Index”, Journal of Hydrological