Development of RF Spectrum Management Tool
for Malaysia Using Open-Source Software
Mohamad Afif Saman, Ahmad Fadzil Ismail, Huda Adibah Mohd Ramli, and Khairayu Badron
Faculty of Engineering, International Islamic University Malaysia, Kuala Lumpur, Malaysia Email: {afif.saman, af_ismail, hadibahmr, khairayu}@iium.edu.my
Wahidah Hashim
MIMOS Berhad, Technology Park Malaysia, Bukit Jalil, Kuala Lumpur Malaysia Email: {wahidah.hashim}@mimos.my
Abstract—In recent years, mobile communications technologies have evolved rapidly. A lot of countries including Malaysia have adopted these technologies once they are available. This increases the number of subscribers and services in cellular network. It forces new installation of cellular base stations (BS) in order to improve coverage. This however increased the likelihood of interference between BS which will reduce network efficiency. Thus, it is needed to develop a Radio Frequency (RF) spectrum monitoring tool that not only can identify interference before any new BS installation but also monitor interference between existing BS. The tool’s database needs to contain data on BS, their location as well as its respective allocated frequency so that interference could be determined promptly. Expensive commercial spectrum management tool led us to seek low cost solution. This paper aims to outline the approaches taken in developing a spectrum management tool for Malaysian authority. The tool is currently being devised using an open source Geographical Information System software. The end result will be a simple low cost tool that not only can identify interference but also display the coverage area of BS; which all in all can be very useful and practical for spectrum management process.
Index Terms—spectrum, radio frequency, interference, spectrum management tool
I. INTRODUCTION
Mobile communication has become an essential part of today’s society. With rapid development of new technologies and services in radio communication such as third generation (3G) and fourth generation (4G) technologies, exceptional demand for radio frequencies seems inevitable especially in cellular network communication [1]. People around the world now are using mobile communication as a platform for their entertainment, business as well as safety. As mobile communication market continues to grow further, competition among government, public and commercial sectors for spectrum access grows stronger [2]. As a
Manuscript received July 10, 2013; revised August 28, 2013. The work is currently being supported by the International Islamic University Malaysia under Endowment Grant Type B2011.
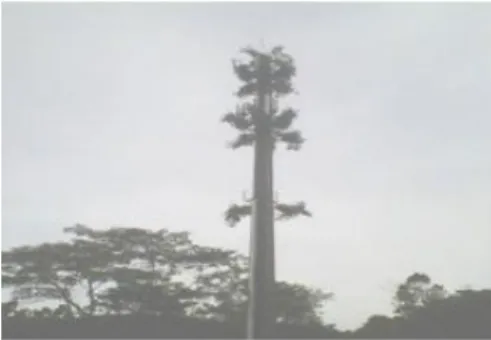
result, installation of new base stations (BS) has increased to accommodate the increasing number of users and services in mobile communication. A BS could cover certain area, known as cell [3]. A typical tower for a BS with multiple antennas installed is depicted in Fig. 1. Each cell has limited number of users that it could establish connection with. BS with higher frequency transmission has smaller cell size. However, there are several issues concerning the manifold BS installations. One of the major issues is interference among BS.
In mobile communication network, two BS cells located side by side cannot operate within same set of frequency because it will create interference between the two signals which consequently lead to signal corruption. This is known as adjacent channel interference. Since spectrum is a limited resource, each cell cannot be assigned with unique frequency. Instead, two or more cells could use same set of frequency given that the distance between these BSs are far enough to avoid interference. This technique is known as frequency reuse or channel reuse and these cells are known as co-channel cells the interference problem between them is called co-channel interference [4].
Figure 1. Typical base station
Spectrum management system is introduced to minimalize interference among radio systems and creating an efficient structure in which spectrum’s demand can be met [1] and [5]. The spectrum management process involves spectrum planning, assigning and monitoring. These tasks are performed through spectrum management tool. Most spectrum management tools are aided with Geographical
Information System (GIS). GIS is a system that widely used to manage spatial information in digital form. It helps to visualize the geographic pattern of data by collection, analyzing, modelling and managing spatial data. [6] and [7] GIS has been used in variety of applications such as population planning, environmental planning, global positioning system (GPS), security, agriculture, remote sensing, radio wave planning and others.
Commercial spectrum management software costs a lot of money. Every nation has different rules and regulation in spectrum management. Each spectrum management organization has different needs [1]. Furthermore, with the current evolution trend in mobile communication, constant changes are needed in the spectrum management tool’s functionalities. Since commercial software is likely to be proprietary, additional fees and costs will be imposed to the organization whenever changes need to be made. Thus, it leads to low cost open source spectrum management tool solution. Nowadays, commercial and open-source GIS software are available in the market [8]. The emergence of open-source GIS makes possible to build a low cost spectrum management tool. With this, organization only needs to employ suitable worker to modified and maintained the spectrum monitoring tool according to the needs of the organization. This will reduce the cost to manage radio spectrum in mobile communication.
The aim of this paper is to highlight the overview of spectrum management tool’s development. Section II provides the research scope and methodology. Section III specifies the formulation and modeling of the tool. Section IV shows the implementation while Section V outlines the preliminary outcomes of the studies and Section VI concludes the paper
II. RESEARCH SCOPE AND METHODOLOGY
A. Scope
The proposed spectrum management tool is built using open-source GIS software. The tool can be useful for regulatory bodies to monitor interference using the existing site database. By exploiting the advantages of GIS, spectrum occupancy cells could be visualized properly for monitoring purposed. It is also a practical approach to test interference before new site installation. The early development of the proposed tool does not aim to cover on every issue concerning to spectrum monitoring. It is focused on development of a tool with capability to identify interference between BS. The said tool is also focusing on interference from Global System for Mobile Communications (GSM) and Universal Mobile Telecommunications System (UMTS) cellular sites in Malaysia. By implementing the rules and regulations set by Malaysian Communication and Multimedia Commission (MCMC) [5] into the GIS software, better visualization of interference could be observed. It traces discrepancy in database such as operating frequency, transmitting power, tower height, and others by comparing the database provided by monitoring stations with the main database to minimize
interference. These resources could be managed properly using GIS [7]
B. Methodology
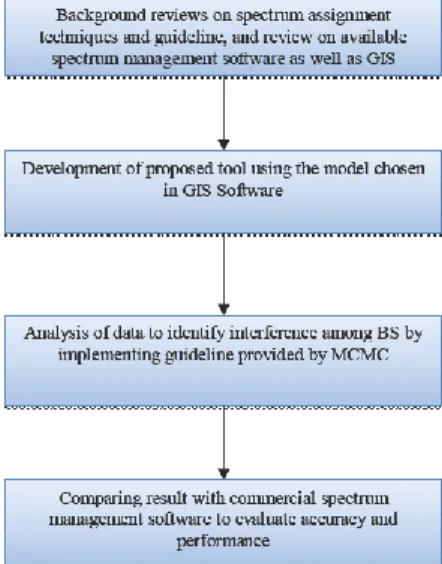
The following activities outlined in Fig. 2 are adapted during the development of spectrum monitoring tool.
Figure 2. Flow chart for research methodology
III. MODELLING AND FORMULATION
The GSM and UMTS channels are allocated using frequency band’s block approach. Each telecommunication company has been assigned with specific bandwidth but different frequency bands as shown in Fig. 3, Fig. 4, and Fig. 5. Every company should abide with channeling plan provided by MCMC as listed in Table I. to ensure minimal disruption. For both GSM900 and GSM1800, the guard band is 200KHz. UMTS2000 has frequency division (FDD) and time division (TDD) transmission. However, the initial stage of the proposed tool only concerned with FDD transmission.
Figure 3. GSM900 frequency band assignment[5]
Figure 5. UMTS2000frequency band assignment [5]
TABLE I. CHANNELING PLAN
Standard Lower Band
(MHz) Upper Band (MHz) Channel Bandwidth (MHz) GSM900 880 – 915 925 - 960 0.2 or multiple of 0.2 GSM1800 1710 - 1785 1805 - 1880 0.2 or multiple of 0.2 UMTS2000 1920 - 1980 2110 - 2200 5 or multiple of 5 In order to determine whether interference had occurred between cells, propagation distance should be first calculated in order to verify the coverage area of the cell.
The distance can be calculated using the free space path loss power ratio equation as given
r P t f P L (1) where 2 r 4 P t P fd c (2)
Combining (1) and (2) yields
2 4 f fd L c (3) (3) in decibel can be expressed as
10 10
( ) 32.45 20log ( ) 20log ( )
f
L dB f MHz d km (4)
By rearranging terms in (4), maximum distance can be calculated 10 10 ( ) 32.45 20 log ( ) ( ) log 20 Lf dB f MHz d km anti (5)
Once the distance is known, the required antenna height, h can be uncovered, with given h in meter
(
)
3.57
d km
h
(6) IV. IMPLEMENTATIONTABLE II. OPEN-SOURCE GISGENERAL COMPARISON
GIS Software Name QGIS GRASS GIS SAGA GIS
General Information
Reviewed version 1.8.0 6.4.3 2.0.8
Programming Language C++, Python C, C++, Python, Tcl C++
GUI QT wxGUI wxWidgets
GUI Flexibility High Satisfactory Low
License Free GNU General Public License Free GNU General Public License Free GNU General Public License Vector Analysis and
Editing Yes Yes Yes
Raster Analysis and Editing Yes Yes Yes
Printing Yes Yes Yes
Cross Platform? Yes Yes Yes
Online Module/Plugin
Development references Many Many Few
Databases Yes Yes Yes
Advantages
a) User friendly and easy to use b) GRASS extention for advance processing
c) Provide APIs for new plugin development
d) Flexible GUI
e) Easy documentation on plugin development
a) Offer advance data processing b) Provide APIs for new module development
C) Stable
a)No installation needed b) Extensive raster processing c) Provide APIs for new module development
Disadvantages a) Less analysis capabilities. a) Complicated for beginner
a) Less resource to help building new module b) Rigid GUI
Several researchers have used GIS in their radio wave planning research [9]-[11]. The proposed models and algorithm had been implemented using GIS software called Quantum GIS (QGIS) version 1.8.0 ‘Lisboa’. Several others open-source GIS software have been considered in this research. They are System for Automated Geoscientific Analyses (SAGA) GIS and Geographic Resources Analysis Support System (GRASS) GIS. Both SAGA and GRASS allow development of own custom module. SAGA is a good choice for heavy analytical and computational of spatial data [12]. However, it offers a very limited graphical user interface (GUI) programming. Furthermore, SAGA has little resources online on module development. GRASS GIS probably has the longest history among open-source GIS software [13]. It is stable and has lot of functionalities. However, with limited GIS knowledge, GRASS can prove to be a little bit complicated to understand.
Like SAGA and GRASS, QGIS also offered the flexibility to write own module [14]. In QGIS, it is known as plugin. The plugin is written in PyQT programming language (a combination of Python and QT programing). QT is used to write the GUI while the process is written in Python. QGIS offered more sophisticated GUI than the SAGA and GRASS since it is written in QT. QGIS has user-friendly documentation online, making it easier to develop new plugin. Furthermore, QGIS has a lot of support group. This is important for open-source software as it development is depended on the active community [15].It is also possible to write plugin in C++. However, Python is more popular due to its simplicity. Table II shows general comparison between the said GIS software.
Unlike commercial software, open-source software has few limitations. One of the main concerns is the quality of the software. Software’s quality can be defined through few criteria, mainly functionality, reliability, usability, efficiency, maintainability and portability [16]. In the current stage of development, QGIS has satisfied these criteria.
QGIS can connect with several databases mainly PostGreSQL, SQLite, MySQL and Oracle Spatial. The capability of establishing connection with database is important for this research since the input data are taken from the existing BS database. The data shall have sufficient information for the tool to perform calculation on propagation distance so then interference identification can be done.
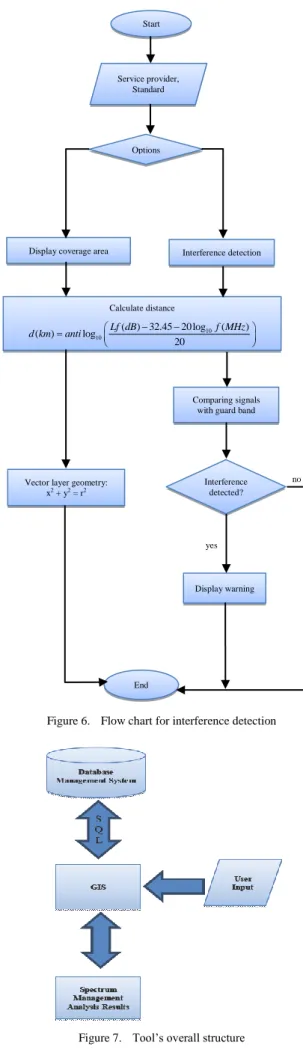
The flow chart shown in Fig. 6 illustrated the overall process of coverage area display and interference detection. The propagation distance is calculated first for each process. For coverage area display, a vector layer will be created, showing the coverage area in shape of circle. As for interference detection, each BS will be tested whether other BS coverage area operate within its coverage area. Guard band will be applied among them and if interference detected, a warning will be given.
Initial development of the proposed tool at this stage only incorporates the capability of displaying the coverage area of BS and detecting interference between BS. The overall structure of the tool is illustrated in Fig. 7.
Figure 6. Flow chart for interference detection
Figure 7. Tool’s overall structure yes
no Start
Options
Display coverage area Interference detection Service provider, Standard Calculate distance 10 10 ( ) 32.45 20 log ( ) ( ) log 20 Lf dB f MHz d km anti
Vector layer geometry: x2 + y2 = r2
Interference detected? Comparing signals
with guard band
Display warning
V. RESULT AND FINDING
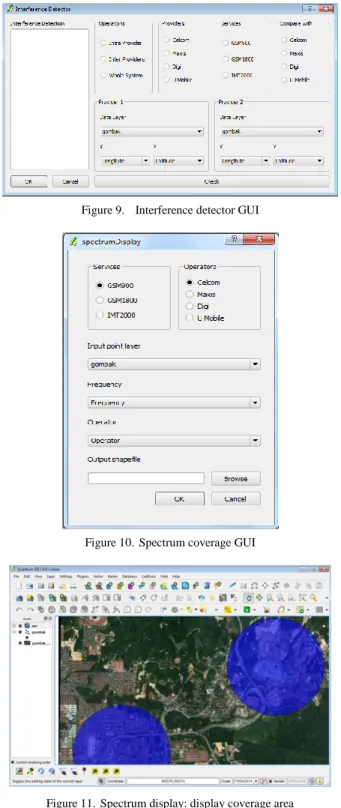
Two plugins called ‘Spectrum Display’ and ‘Interference Detector’ have been developed as shown in Fig. 8. Before plugins can be used properly, maps and database need to be imported first into QGIS. One of the advantages of QGIS is the active development of additional plugins by QGIS community. One of the additional plugins which can be downloaded is OpenLayers plugin. With this plugin, we can import map layer directly from Google Map, Bing Map, OpenStreet Map and others, giving the condition of having internet connection availability. This will save time since georeferencing of map is not needed and more accurate result can be obtained. However, QGIS does provide georeferencing of map manually. The database contained necessary data about the BS for plugins to perform its tasks correctly. One of the vital information is the location of BS. The location data will be used by QGIS to create a point-type vector layer that is overlay on top of the map layer.
Figure 8. Spectrum display plugin
From there, spectrum occupancy coverage area can be done by clicking on the ‘Spectrum Display’ plugins icons while interference identifying process can be done by clicking on the ‘Interference Detector’ plugins icons. User needs to input the necessary parameters from the GUI as shown in Fig. 9 and Fig. 10. The current development of the spectrum management tool allows identification of both co-channel interference as well as adjacent cell interference.The result for displaying coverage area is shown in Fig. 11. It is achieved by running the Spectrum Display plugin. The early result assumed the signal is propagated uniformly in circular manner. Hence, the circle on the map represents the area covered by BS. The execution of the process will create a polygon type vector layer in QGIS for the circle. The user will be asked to save the layer first before the process is executed. The output is displayed in 2D graphic. This will give a better visualization to identify interference when executing Interference Detector plugin. Any warning will be displayed in the text field box inside Interference Detector GUI. If no interference detected, it will simply display “No interference detected”. At this stage, Interference Detector is running separately from Spectrum Display. The next stage of development will have both operations operate within single plugin and a post monitoring functionality will also be included.
Figure 9. Interference detector GUI
Figure 10. Spectrum coverage GUI
Figure 11. Spectrum display: display coverage area
VI. CONCLUSION
The early phases development and results of the proposed spectrum management tool are presented in this paper. The tool is developed with the intention of identifying interference between BS in GSM and UMTS cellular network. BS coverage area will be visualized on digitized geographical map by calculating the propagation distance using free space path loss model. Any interference could be detected and warning will be given. The tool can be expanded further to accommodate new mobile communication technologies such as Long-Term Evolution (LTE) network. In future, more
constraints and functions will be included such as data discrepancy checker for spectrum monitoring to complete the proposed tool.
ACKNOWLEDGMENT
The authors acknowledge the Research Management Centre of the International Islamic University Malaysia (IIUM) for the financial support and would like to express special appreciation to the Malaysian Communications Multimedia Commission for the technical guidance and assistance. The reported research findings are part of the deliverables for the research funded under IIUM’s Research University Initiatives.
REFERENCES
[1] A. S. A Latef and R. Hassan, "Spectrum management system: A study," in Proc. 2011 International Conference on Electrical Engineering and Informatics, Bandung, 2011, pp. 1-6.
[2] P. Major, S. Millenderm, and G. C. Wagner, “Spectrum management using network management concepts,” in Proc. Military Communications Conference, Atlantic City, NJ, 1999, pp. 1153-1155.
[3] A. Goldsmith, Wireless Communications, Cambridge University Press, 2005, pp. 470-482.
[4] J. Schiller, Mobile Communication, 2nd ed., Great Britain, Pearson Education, 2003, pp. 61-64.
[5] Spectrum Management. SKMM (2012). Retrieved December 1.
[Online]. Available:
http://www.skmm.gov.my/Spectrum/Spectrum-Management.aspx [6] M-C. Popescu and N. Mastorakis, “Important aspects of using
geographical information system,” Wseas Transactions on Communications, vol. 9, no. 2, pp. 95-104, February 2010. [7] Z. Shu, H. Li, G. Liu, and Q. Xie, "Application of GIS in
telecommunication information resources management system," presented at 2011 International Conference on Information Management, Innovation Management and Industrial Engineering (ICIII), Shenzen, Nov. 2011.
[8] M. H. Selamat, M. S. Othman, N. H. M. Shamsuddin, N. I. M. Zukepli, and A. F.Hassan, “A review on open source architecture in geographical information systems,” in Proc. International Conference on Computer & Information Science, June 2012, pp. 962-966.
[9] S. Li, Z. Han, W. Li, and R. Shi, "A web geographical information system applied to radio station information management," in Proc. International Symposium on International Symposium on Computer Science and Computational Technology, Dec. 2008, pp. 360-363.
[10] A. Hrovat, I. Ozimek, A. Vilhar, T. Celcer, I. Sajeand, and T. Javornik, "Radio coverage calculations of terrestrial wireless networks using an open-source GRASS system," Wseas Transactions on Communications, vol. 9, no. 10, pp. 646-657, 2010.
[11] R. Umar, Z. Z. Abidin, and Z. A. Ibrahim, “Implementing the GIS technique for RFI mapping for radio astronomy in Malaysia,” in Proc. IEEE International Conference on Space Science and Communication (IconSpace), July 2011, pp. 25-27.
[12] SAGA GIS. Retrieved. (January 3, 2013). [Online]. Available: http://www.saga-gis.org
[13] Quantum GIS. Retrieved. (January 3, 2013). [Online]. Available: http://www.qgis.org/
[14] GRASS GIS. Retrieved. (January 3, 2013). [Online]. Available: http://grass.osgeo.org/
[15] F. Ahmed, P. Campbell, A. Jaffar, and L. F. Capretz, “Managing support requests in open source software project: The role of
onlineforums,” presented at 2nd IEEE International Conference on Computer Science and Information Technology, Beijing, Aug. 2009.
[16] D. Jankovic and R. Milidragovic, “Selecting the optimal opensource GIS software for local authorities by combining the ISO 9126 standard and AHP approach,” in Proc. 2012 the 35th International Convention, MIPRO, 21-25 May, 2012, pp. 1661-1665.
Mohamad Afif Saman graduated in 2012 B. Eng in Electronics-Computer and Information from the International Islamic University Malaysia. He is currently a research assistant whilst pursuing his MSc studies at the Electrical and Computer Engineering department, IIUM. His research interests are in open-source software development, embedded system and wireless communication.
Ahmad Fadzil Ismail is currently serving as a lecturer at the Department of Electrical and Computer Engineering, Faculty of Engineering, International Islamic University Malaysia. He completed his bachelor degree studies in Electrical Engineering at Gannon University, Pennsylvania, USA with Cum Laude Latin honors. He holds MSc from University of Essex, UK and PhD from University of Bath, UK. His research interests include millimeter and microwave propagation studies, development of active and passive target tracking algorithms and Cognitive Radio applications. He is a registered Professional Engineer with Board of Engineering Malaysia and also a Senior Member of the IEEE.
Huda Adibah Mohd Ramli completed her PhD at the Faculty of Engineering and Information Technology, University of Technology, Sydney (UTS), Australia. She received an M.Sc. in Software Engineering from University of Technology Malaysia in 2006) and B.Eng. in Electrical and Computer Engineering from International Islamic University Malaysia in 2003. She is now an assistant professor at faculty of Engineering, International Islamic University Malaysia. Her current research interests focus on radio resource management for the future wireless IP networks.
Khairayu Badron obtained her BEng and MSc from International Islamic University Malaysia (IIUM) in 2007 and 2011 respectively. She is currently one of the faculty members of Faculty of Engineering, IIUM and recently commenced her PhD studies in Radar and Radiometry research, quantifying propagation effects on microwave and millimeter links. Khairayu is a member of IEEE and has published and co-authored more than ten papers in International Journals as well as Conferences on subjects relating to rain attenuation in the tropical regions.
W. Hashim received his bachelor degree in Information Technology, Business Management and Language from University of York, UK in 1999. She then pursued her MSc in Multimedia Technology at University of Bath, UK in 2001. She completed her PhD studies from King’s College London, UK in 2008 in the field of Telecommunication Engineering. She is currently a staff researcher at the Wireless Communication Cluster, MIMOS Berhad with focus in cognitive radio, WLAN, OFDM, space-time coding, MIMO systems and wireless system.
![Figure 5. UMTS2000frequency band assignment [5]](https://thumb-us.123doks.com/thumbv2/123dok_us/1362088.2682321/3.893.93.789.110.1172/figure-umts-frequency-band-assignment.webp)